| Param | Original file | Final file |
|---|---|---|
| Filename | modeM0/AS1A02_103T01_9000000904_06666cztM0_level2.evt | modeM0/AS1A02_103T01_9000000904_06666cztM0_level2_quad_clean.evt |
| Size (bytes) | 1,055,874,240 | 134,349,120 |
| Size | 1007.0 MB | 128.1 MB |
| Events in quadrant A | 5,469,873 | 840,163 |
| Events in quadrant B | 5,572,264 | 850,412 |
| Events in quadrant C | 7,244,197 | 829,225 |
| Events in quadrant D | 12,904,557 | 742,433 |
| Mode M0 | |||
|---|---|---|---|
| Quadrant | BADHDUFLAG | Total packets | Discarded packets |
| A | 0 | 24226 | 1 |
| B | 0 | 24221 | 1 |
| C | 0 | 29301 | 1 |
| D | 0 | 46247 | 1 |
| Mode M9 | |||
|---|---|---|---|
| Quadrant | BADHDUFLAG | Total packets | Discarded packets |
| A | 0 | 9 | 0 |
| B | 0 | 9 | 0 |
| C | 0 | 9 | 0 |
| D | 0 | 9 | 0 |
| Mode SS | |||
|---|---|---|---|
| Quadrant | BADHDUFLAG | Total packets | Discarded packets |
| A | 0 | 238 | 0 |
| B | 0 | 238 | 0 |
| C | 0 | 238 | 0 |
| D | 0 | 238 | 0 |
| Quadrant | Total seconds | Saturated seconds | Saturation percentage |
|---|---|---|---|
| A | 11643 | 236 | 2.026969% |
| B | 11643 | 171 | 1.468694% |
| C | 11643 | 157 | 1.348450% |
| D | 11643 | 2433 | 20.896676% |
Noise dominated data is calculated using 1-second bins in cleaned event files. If a bin has >2000 counts, and if more than 50% of those come from <1% of pixels, then it is considered to be noise-dominated and hence unusable.
| Quadrant | # 1 sec bins | Bins with >0 counts | Bins with >2000 counts | High rate bins dominated by noise | Noise dominated (total time) | Noise dominated (detector-on time) | Marked lightcurve |
|---|---|---|---|---|---|---|---|
| A | 12103 | 11644 | 0 | 0 | 0.00% | 0.00% | 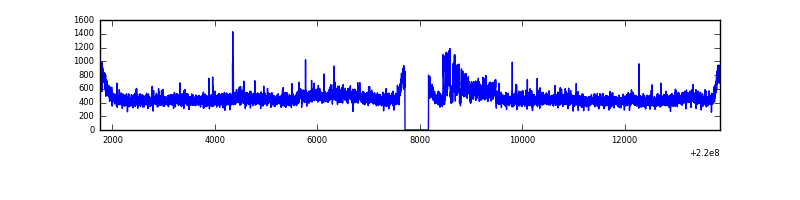 |
| B | 12103 | 11644 | 11 | 11 | 0.09% | 0.09% | 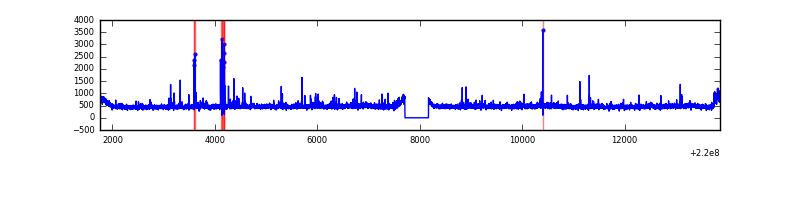 |
| C | 12103 | 11644 | 3 | 3 | 0.02% | 0.03% | 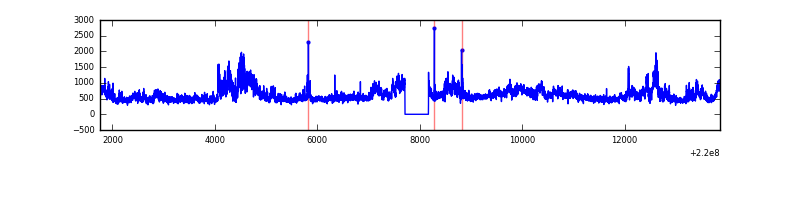 |
| D | 12103 | 11644 | 1916 | 1916 | 15.83% | 16.45% | 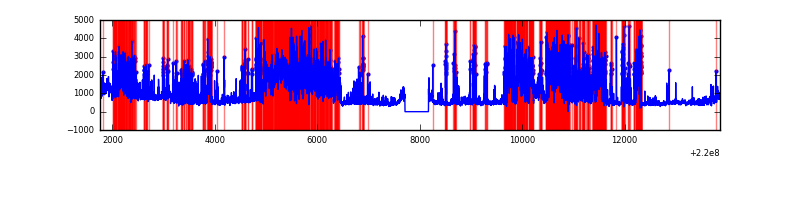 |
Top three noisy pixels from each quadrant. If the there are fewer than three noisy pixels in the level2.evt file, extra rows are filled as -1
| Pixel properties | Quadrant properties | ||||||
|---|---|---|---|---|---|---|---|
| Quadrant | DetID | PixID | Counts | Sigma | Mean | Median | Sigma |
| A | 14 | 111 | 188861 | 685.65 | 1339 | 1308 | 273.5 |
| A | 15 | 239 | 62042 | 222.03 | 1339 | 1308 | 273.5 |
| A | 8 | 15 | 30895 | 108.16 | 1339 | 1308 | 273.5 |
| B | 0 | 214 | 68083 | 254.94 | 1353 | 1319 | 261.9 |
| B | 4 | 80 | 53652 | 199.83 | 1353 | 1319 | 261.9 |
| B | 4 | 81 | 48149 | 178.82 | 1353 | 1319 | 261.9 |
| C | 9 | 247 | 2142287 | 7064.09 | 1300 | 1305 | 303.1 |
| C | 8 | 128 | 13078 | 38.84 | 1300 | 1305 | 303.1 |
| C | 13 | 61 | 10430 | 30.11 | 1300 | 1305 | 303.1 |
| D | 2 | 33 | 3916440 | 13495.2 | 1193 | 1156 | 290.1 |
| D | 2 | 63 | 2218814 | 7643.82 | 1193 | 1156 | 290.1 |
| D | 13 | 169 | 1022426 | 3520.11 | 1193 | 1156 | 290.1 |
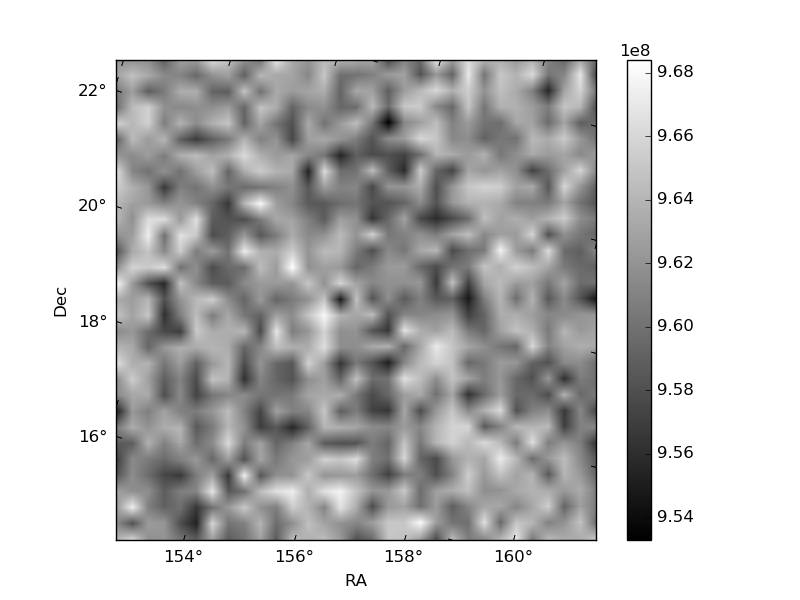
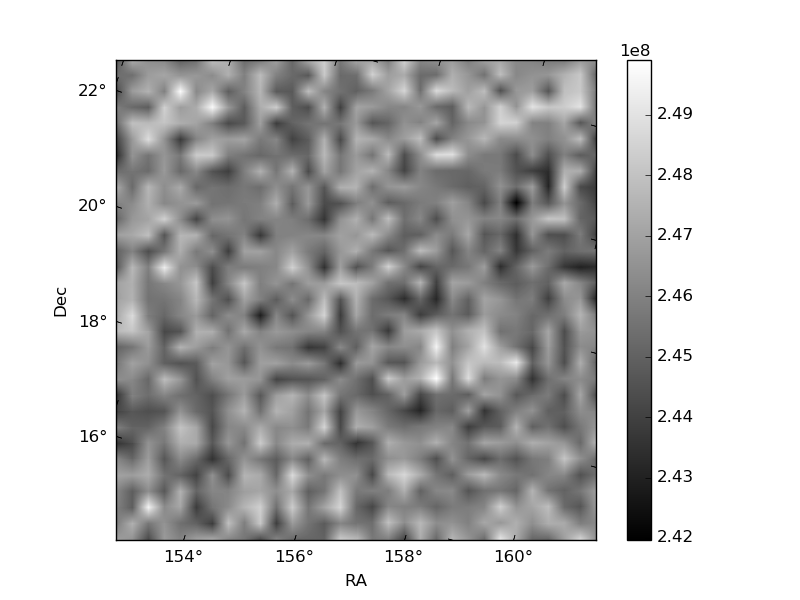
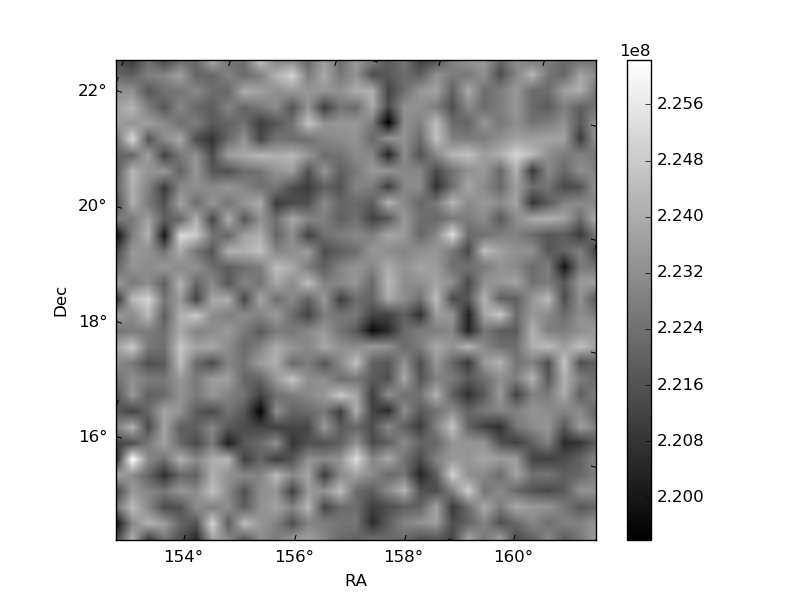
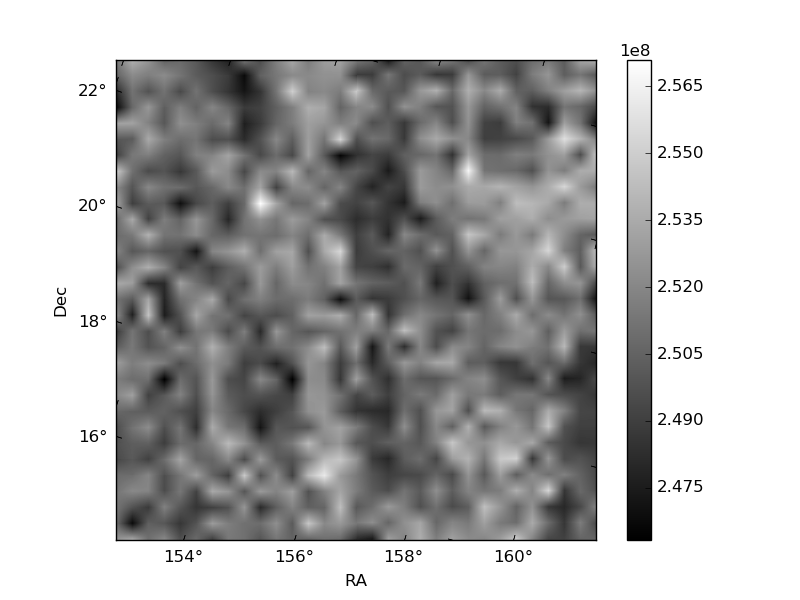
Histogram calculated using DETX and DETY for each event in the final _common_clean file
| Quadrant A | 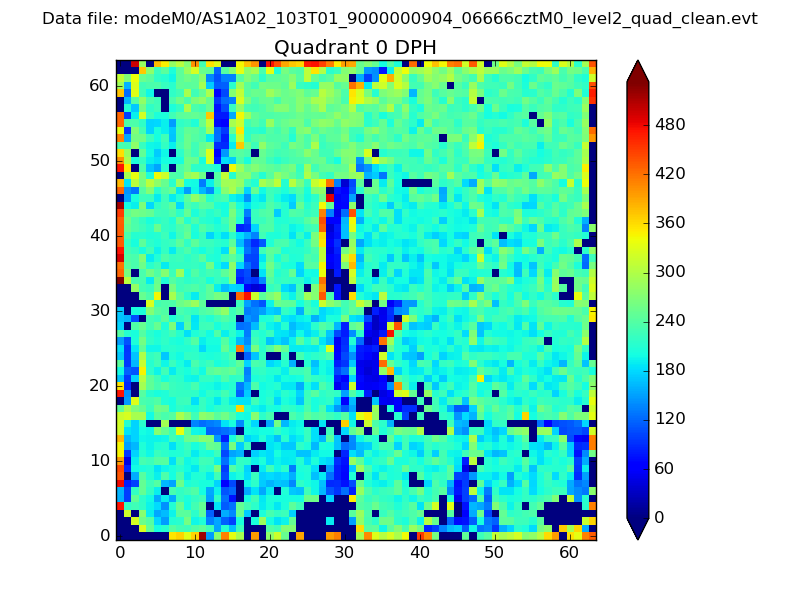 |
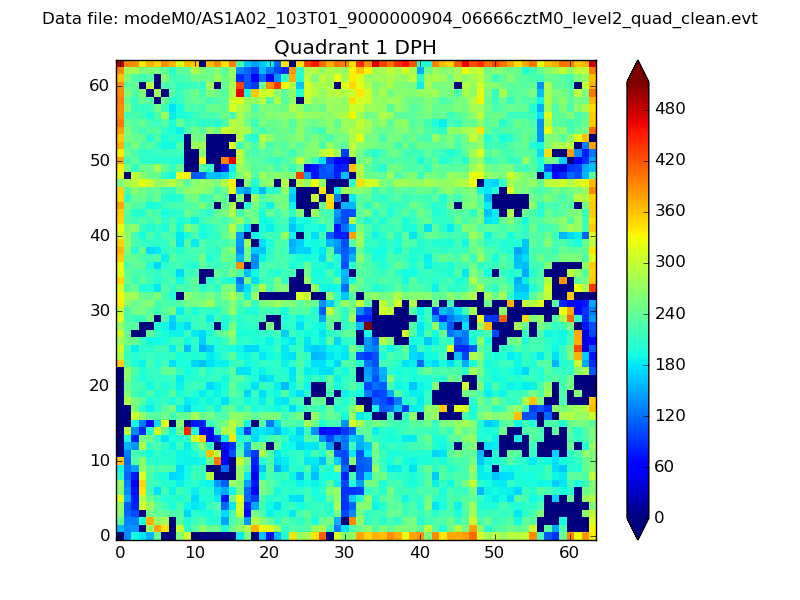 |
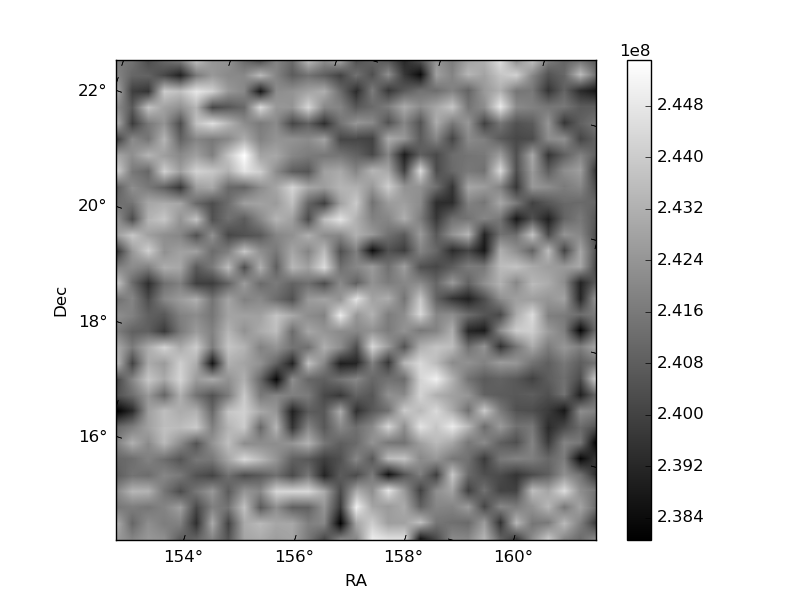
Quadrant B |
|---|---|---|---|
| Quadrant D | 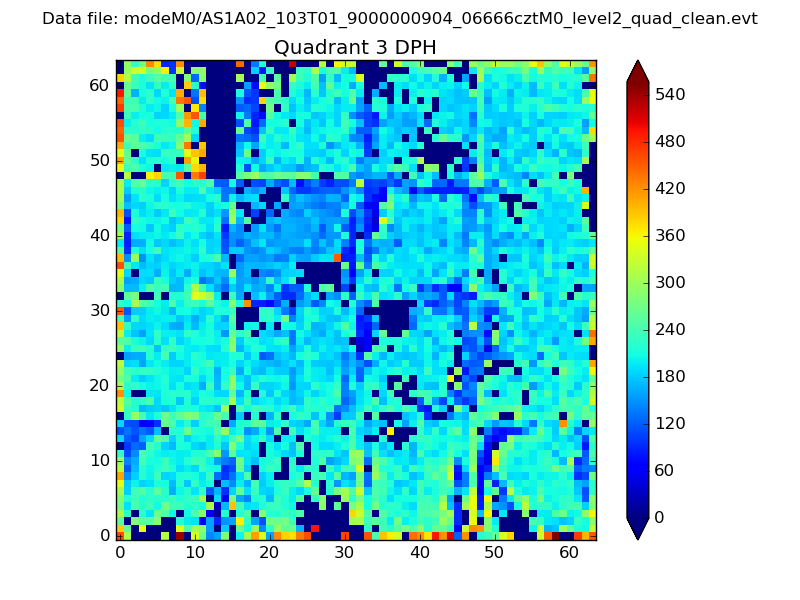 |
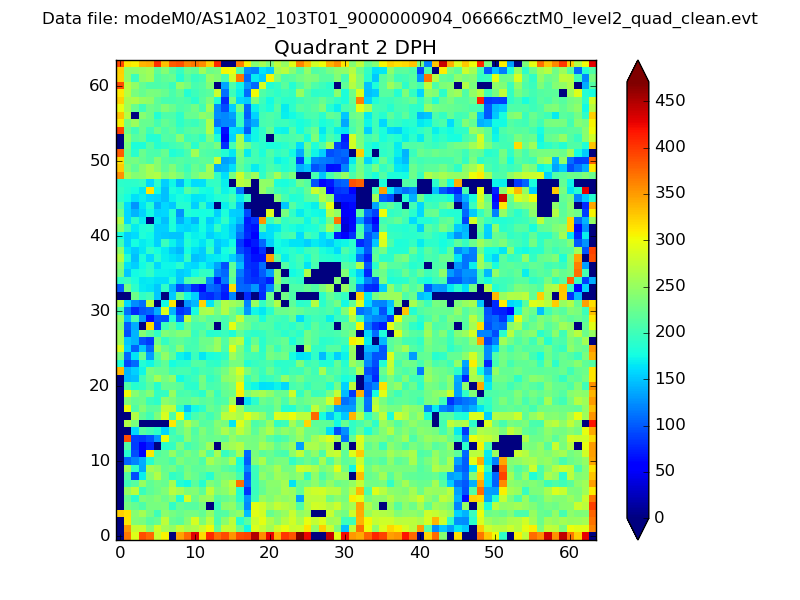 |
Quadrant C |
| Plot type | Count rate plots | Images |
|---|---|---|
| Comparison with Poisson distribution Blue bars denote a histogram of data divided into 1 sec bins. Red curve is a Poisson curve with rate = median count rate of data. |
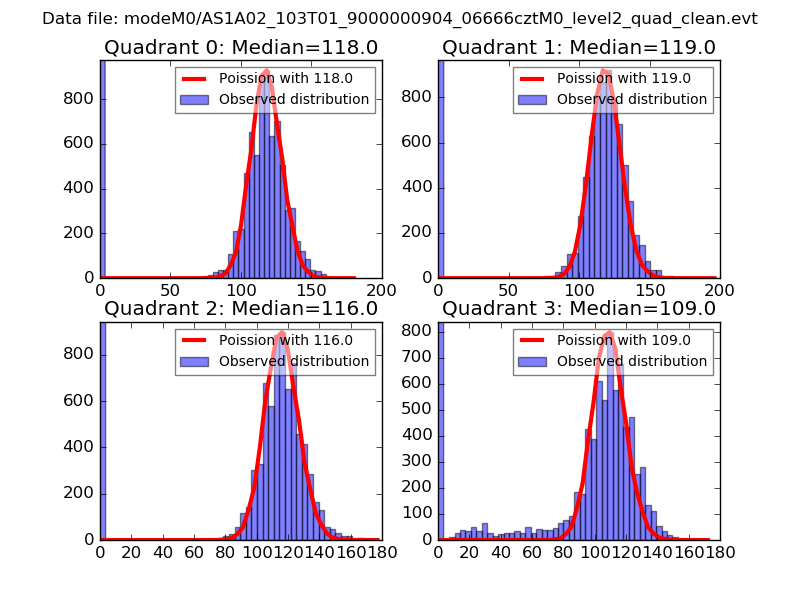 |
 |
| Quadrant-wise count rates Data is divided into 100 sec bins |
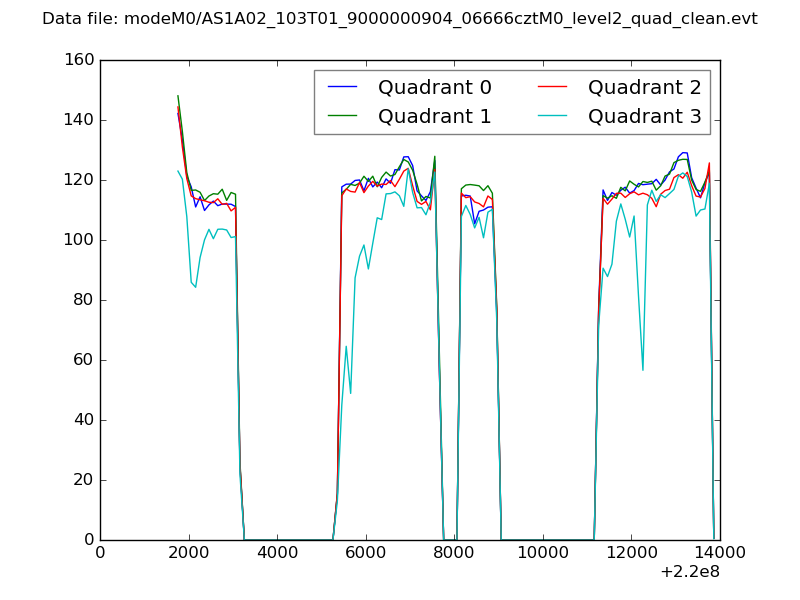 |
|
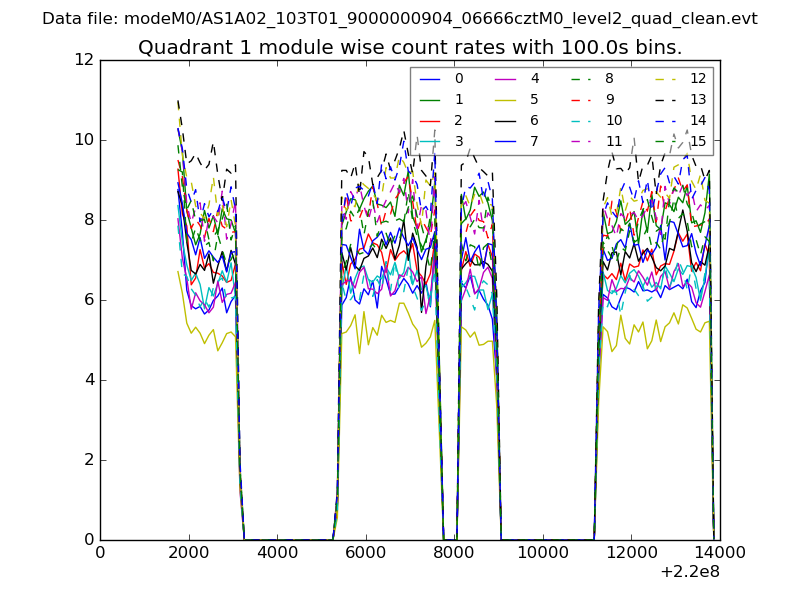
| Module-wise count rates for Quadrant A Data is divided into 100 sec bins |
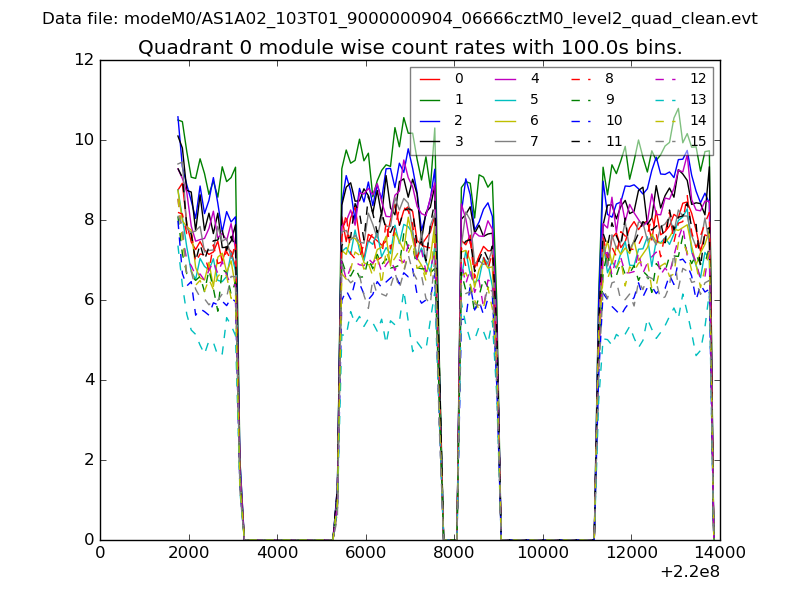 |
 |
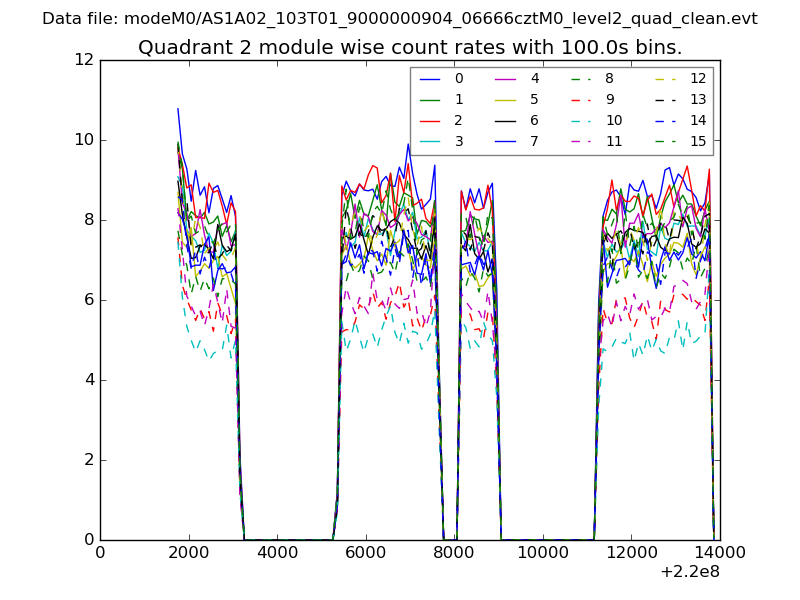
| Module-wise count rates for Quadrant B Data is divided into 100 sec bins |
 |
 |
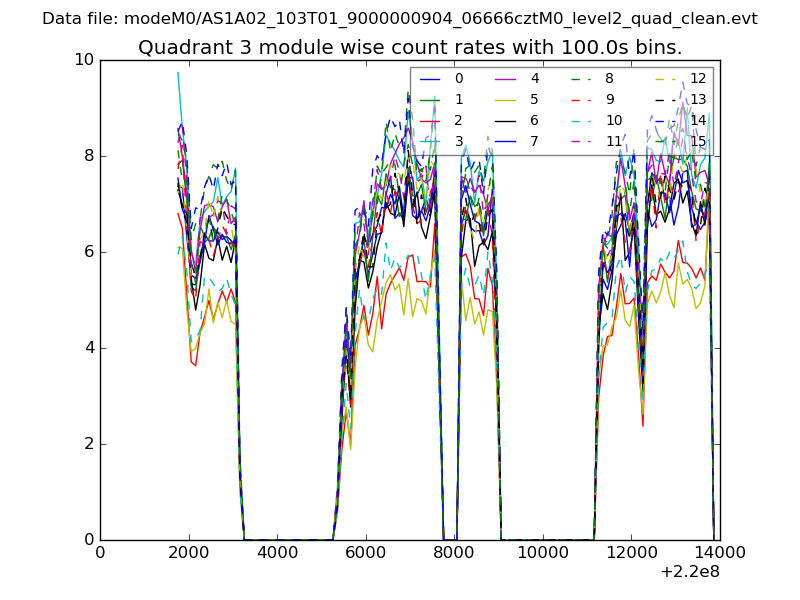
| Module-wise count rates for Quadrant C Data is divided into 100 sec bins |
 |
 |
| Module-wise count rates for Quadrant D Data is divided into 100 sec bins |
 |
 |
| Parameter | Plot |
|---|---|
| CZT HV Monitor |  |
| D_VDD | 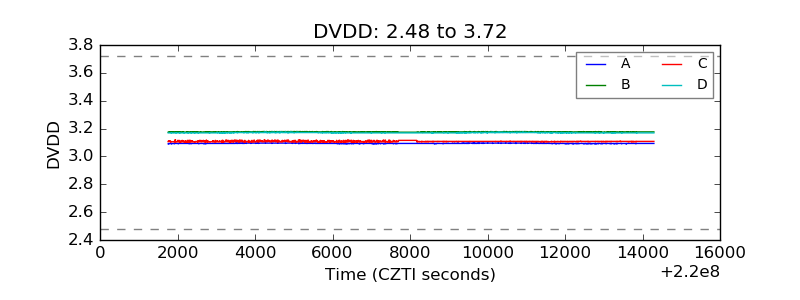 |
| Temperature 1 | 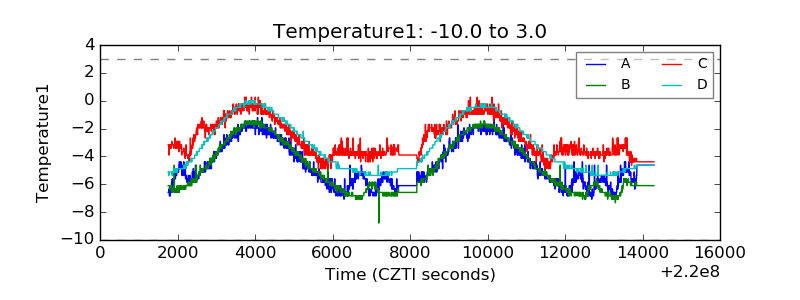 |
| Veto HV Monitor | 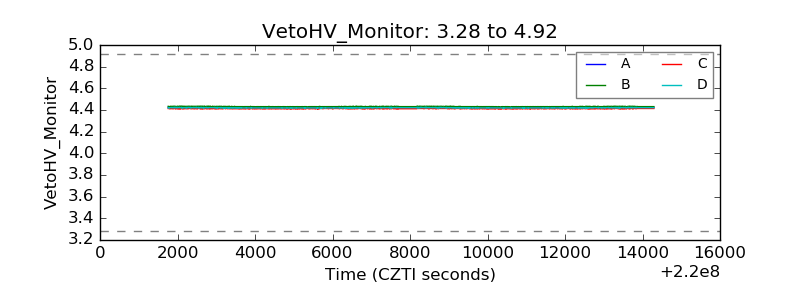 |
| Veto LLD | 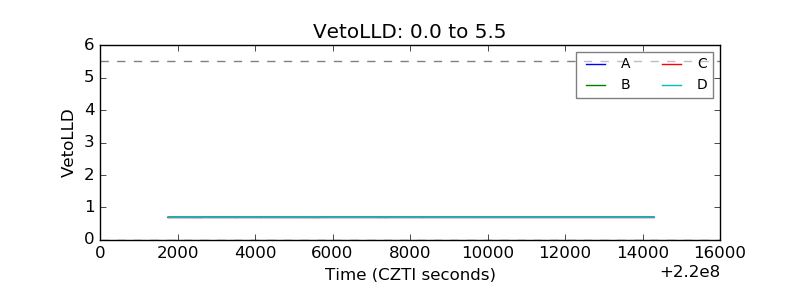 |
| Alpha Counter | 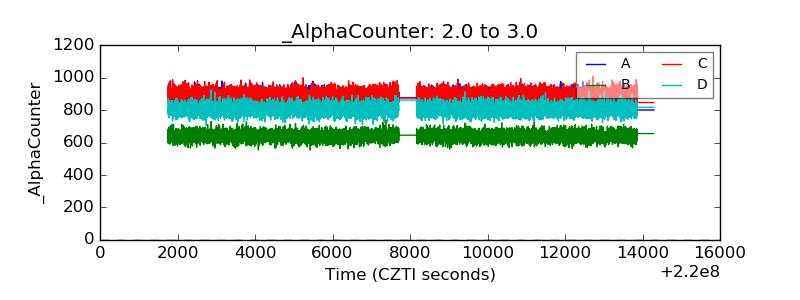 |
| _CPM_Rate | 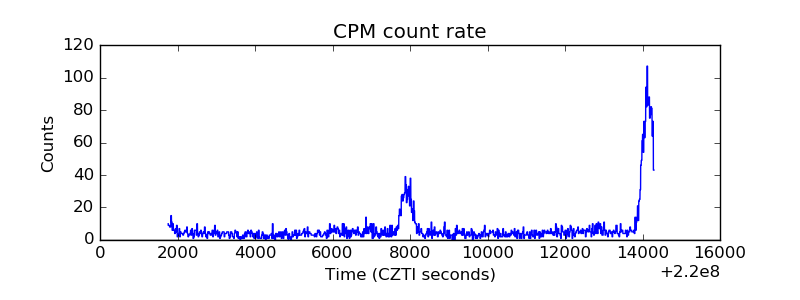 |
| CZT Counter | 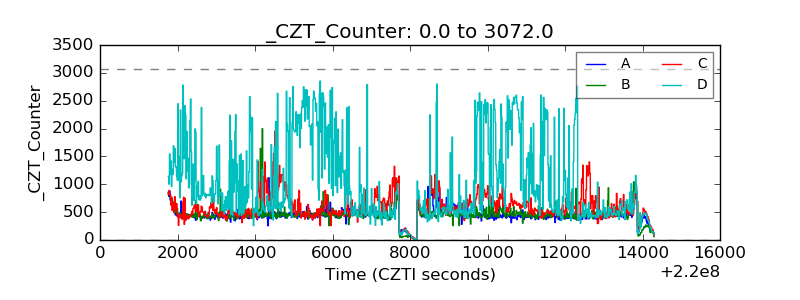 |
| +2.5 Volts monitor |  |
| +5 Volts monitor |  |
| _ROLL_ROT | 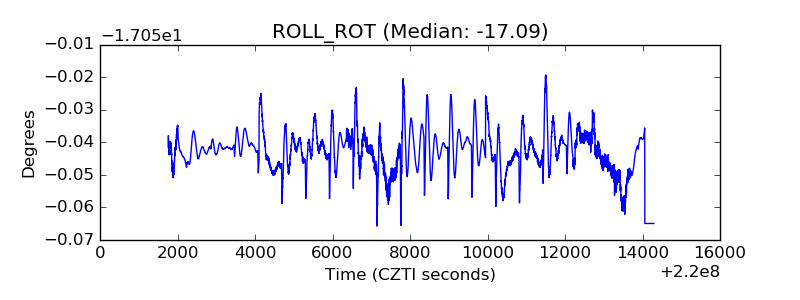 |
| _Roll_DEC | 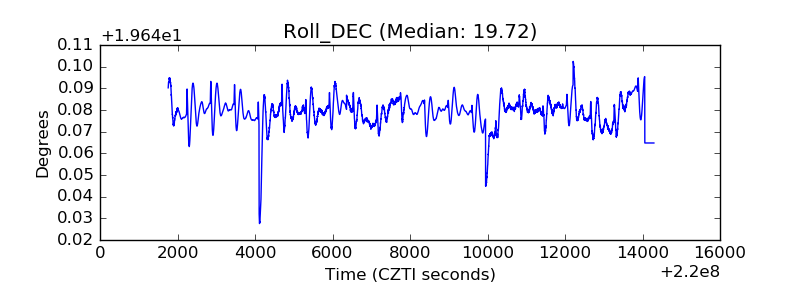 |
| _Roll_RA | 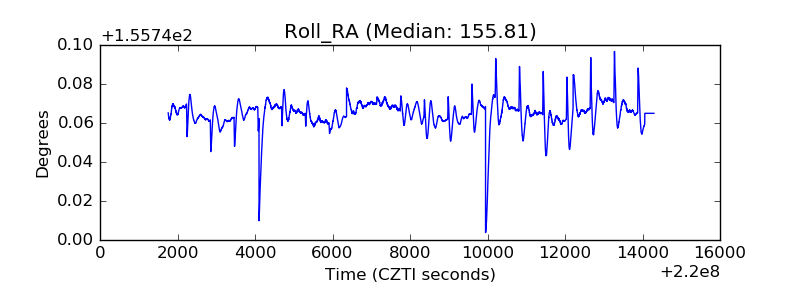 |
| Veto Counter | 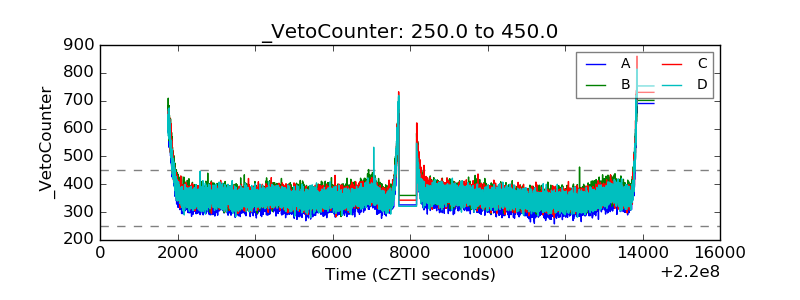 |