| Param | Original file | Final file |
|---|---|---|
| Filename | modeM0/AS1A02_075T01_9000000906cztM0_level2.fits | modeM0/AS1A02_075T01_9000000906cztM0_level2_quad_clean.evt |
| Size (bytes) | 63,475,200 | 56,257,920 |
| Size | 60.5 MB | 53.7 MB |
| Events in quadrant A | 383,594 | 328,486 |
| Events in quadrant B | 373,752 | 320,639 |
| Events in quadrant C | 376,596 | 304,070 |
| Events in quadrant D | 278,150 | 240,112 |
| Mode M9 | |||
|---|---|---|---|
| Quadrant | BADHDUFLAG | Total packets | Discarded packets |
| A | 0 | 7 | 0 |
| B | 0 | 7 | 0 |
| C | 0 | 7 | 0 |
| D | 0 | 7 | 0 |
| Mode M0 | |||
|---|---|---|---|
| Quadrant | BADHDUFLAG | Total packets | Discarded packets |
| A | 0 | 14842 | 0 |
| B | 0 | 14996 | 0 |
| C | 0 | 17275 | 0 |
| D | 0 | 29996 | 0 |
| Mode SS | |||
|---|---|---|---|
| Quadrant | BADHDUFLAG | Total packets | Discarded packets |
| A | 0 | 148 | 0 |
| B | 0 | 148 | 0 |
| C | 0 | 148 | 0 |
| D | 0 | 148 | 0 |
| Quadrant | Total seconds | Saturated seconds | Saturation percentage |
|---|---|---|---|
| A | 7313 | 66 | 0.902502% |
| B | 7313 | 73 | 0.998222% |
| C | 7313 | 54 | 0.738411% |
| D | 7313 | 1966 | 26.883632% |
Noise dominated data is calculated using 1-second bins in cleaned event files. If a bin has >2000 counts, and if more than 50% of those come from <1% of pixels, then it is considered to be noise-dominated and hence unusable.
| Quadrant | # 1 sec bins | Bins with >0 counts | Bins with >2000 counts | High rate bins dominated by noise | Noise dominated (total time) | Noise dominated (detector-on time) | Marked lightcurve |
|---|---|---|---|---|---|---|---|
| A | 8053 | 7313 | 0 | 0 | 0.00% | 0.00% | 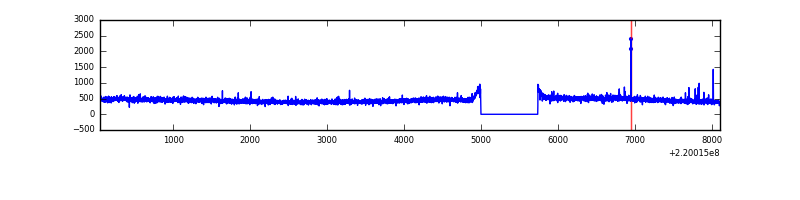 |
| B | 8053 | 7313 | 0 | 0 | 0.00% | 0.00% | 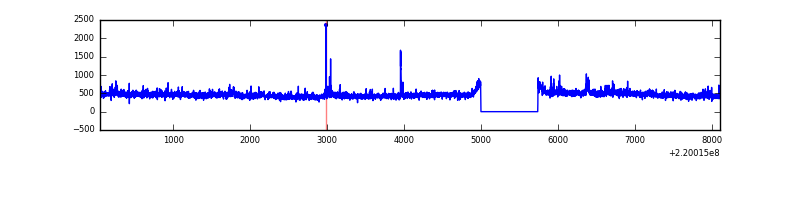 |
| C | 8053 | 7314 | 0 | 0 | 0.00% | 0.00% |  |
| D | 8053 | 7233 | 0 | 0 | 0.00% | 0.00% |  |
Top three noisy pixels from each quadrant. If the there are fewer than three noisy pixels in the level2.evt file, extra rows are filled as -1
| Pixel properties | Quadrant properties | ||||||
|---|---|---|---|---|---|---|---|
| Quadrant | DetID | PixID | Counts | Sigma | Mean | Median | Sigma |
| A | 14 | 188 | 383 | 10.65 | 99 | 93 | 27.2 |
| A | 0 | 29 | 373 | 10.28 | 99 | 93 | 27.2 |
| A | 14 | 204 | 342 | 9.14 | 99 | 93 | 27.2 |
| B | 2 | 9 | 336 | 10.64 | 98 | 93 | 22.8 |
| B | 12 | 226 | 272 | 7.83 | 98 | 93 | 22.8 |
| B | 5 | 128 | 264 | 7.48 | 98 | 93 | 22.8 |
| C | 1 | 81 | 287 | 6.95 | 99 | 92 | 28.1 |
| C | 1 | 80 | 281 | 6.73 | 99 | 92 | 28.1 |
| C | 3 | 158 | 274 | 6.49 | 99 | 92 | 28.1 |
| D | 7 | 5 | 210 | 5.95 | 79 | 72 | 23.2 |
| D | 3 | 31 | 205 | 5.73 | 79 | 72 | 23.2 |
| D | 3 | 14 | 203 | 5.65 | 79 | 72 | 23.2 |
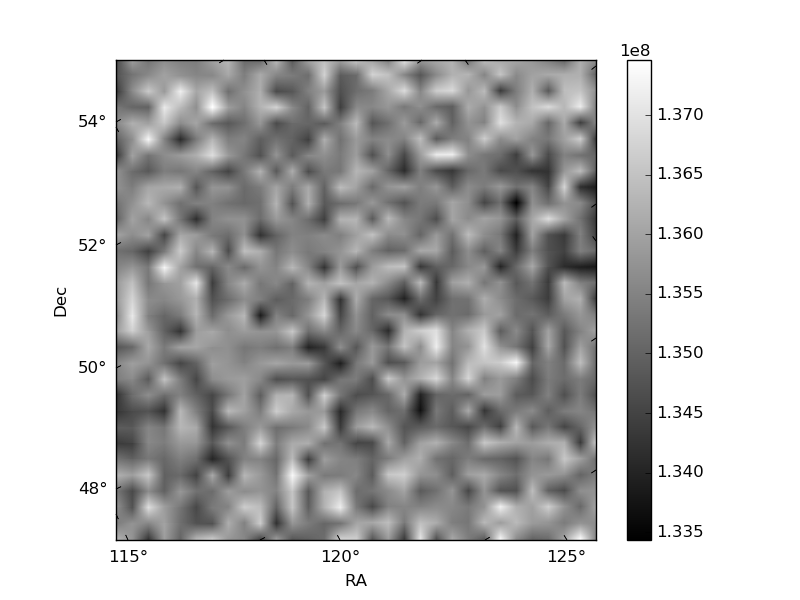
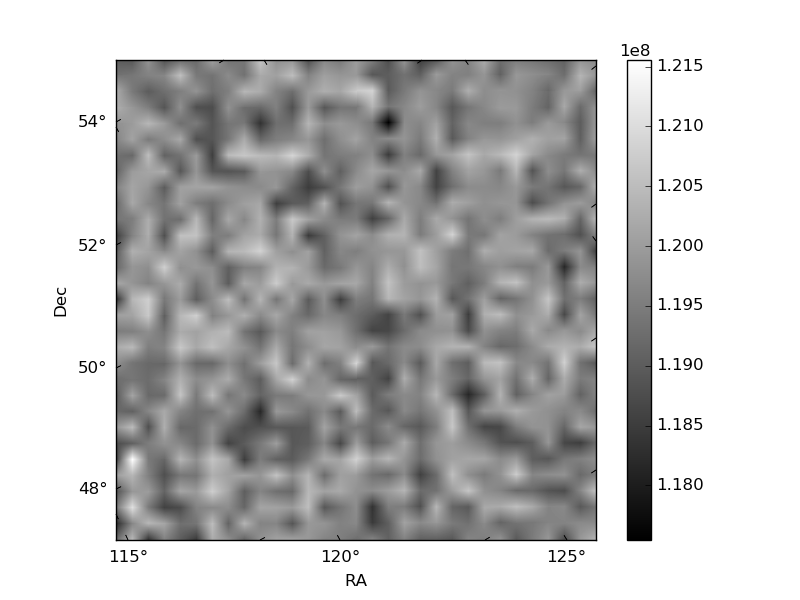
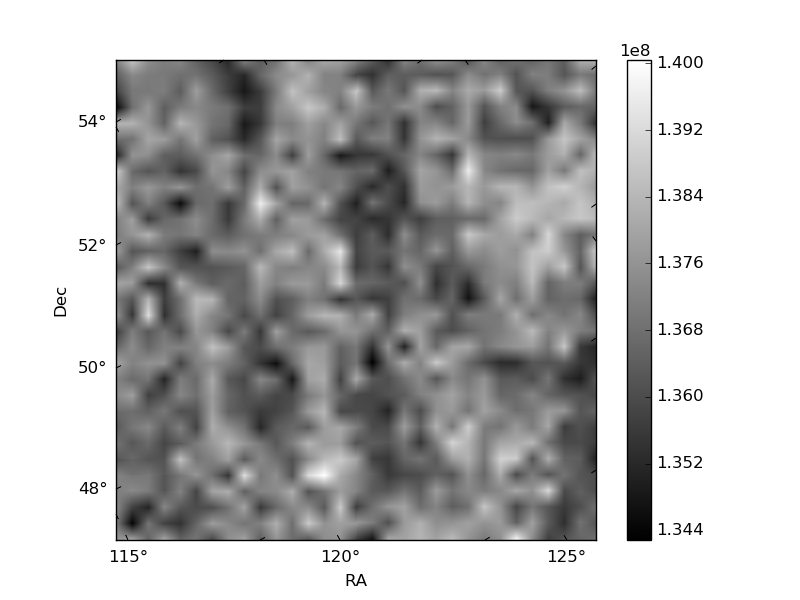
Histogram calculated using DETX and DETY for each event in the final _common_clean file
| Quadrant A |  |
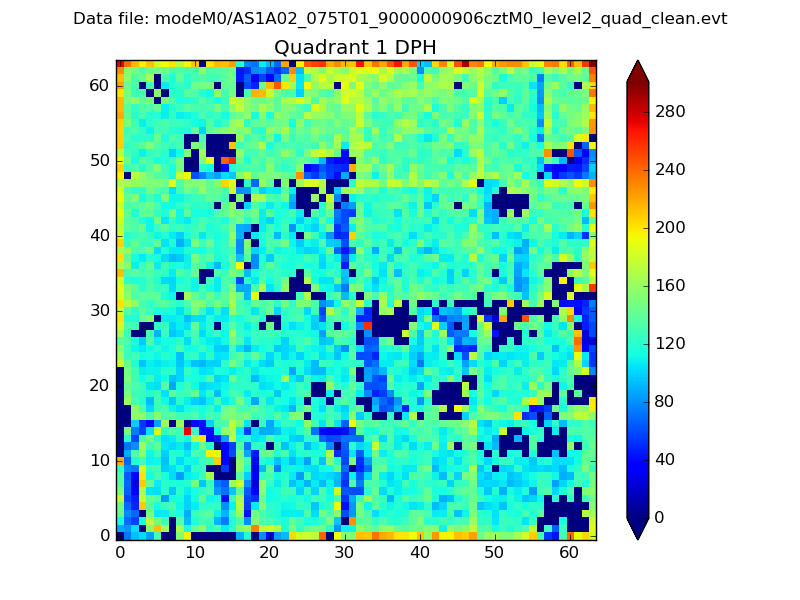 |
Quadrant B |
|---|---|---|---|
| Quadrant D |  |
 |
Quadrant C |
| Plot type | Count rate plots | Images |
|---|---|---|
| Comparison with Poisson distribution Blue bars denote a histogram of data divided into 1 sec bins. Red curve is a Poisson curve with rate = median count rate of data. |
 |
 |
| Quadrant-wise count rates Data is divided into 100 sec bins |
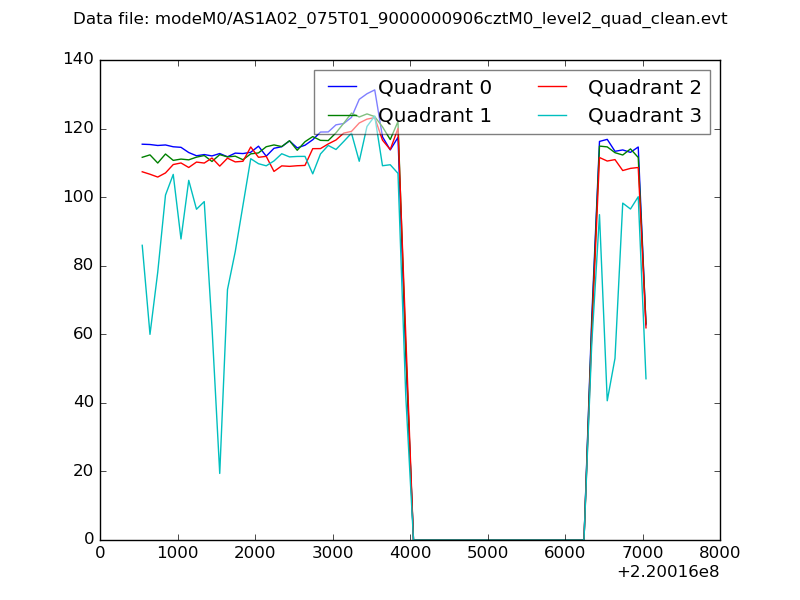 |
|
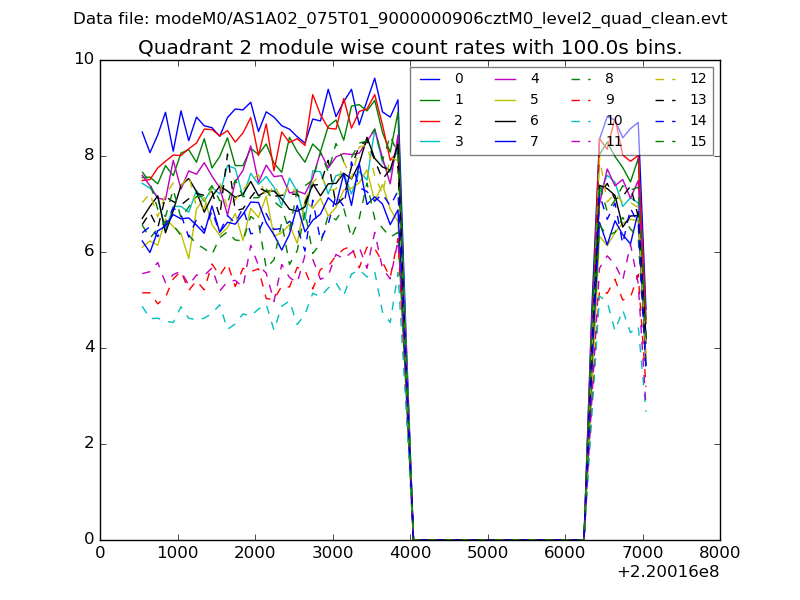
| Module-wise count rates for Quadrant A Data is divided into 100 sec bins |
 |
 |
| Module-wise count rates for Quadrant B Data is divided into 100 sec bins |
 |
 |
| Module-wise count rates for Quadrant C Data is divided into 100 sec bins |
 |
 |
| Module-wise count rates for Quadrant D Data is divided into 100 sec bins |
 |
 |
| Parameter | Plot |
|---|---|
| CZT HV Monitor | 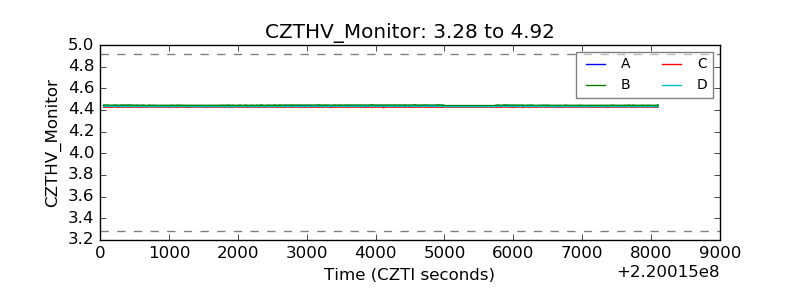 |
| D_VDD | 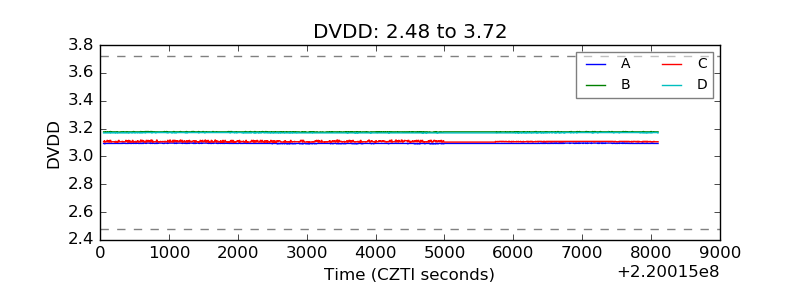 |
| Temperature 1 | 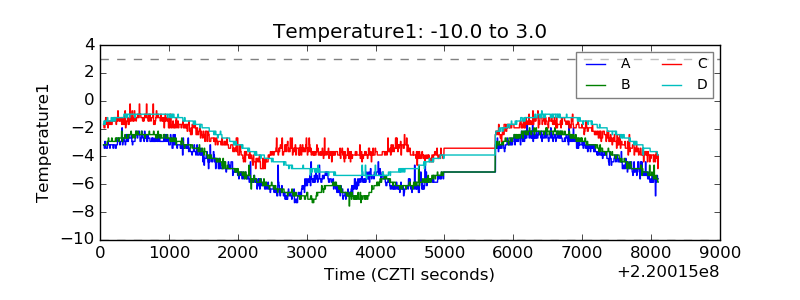 |
| Veto HV Monitor |  |
| Veto LLD |  |
| Alpha Counter |  |
| _CPM_Rate |  |
| CZT Counter |  |
| +2.5 Volts monitor |  |
| +5 Volts monitor |  |
| _ROLL_ROT | 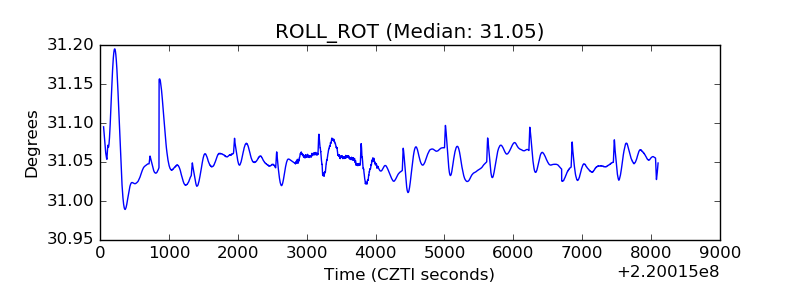 |
| _Roll_DEC | 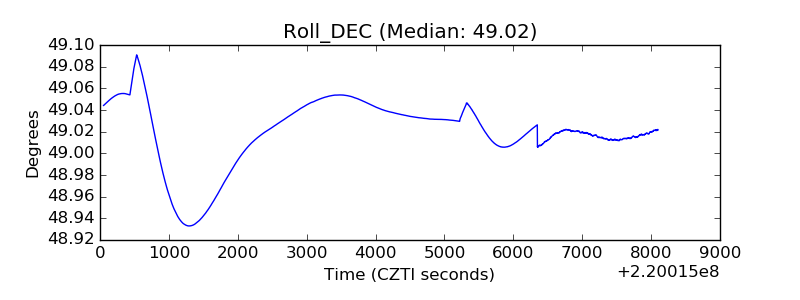 |
| _Roll_RA | 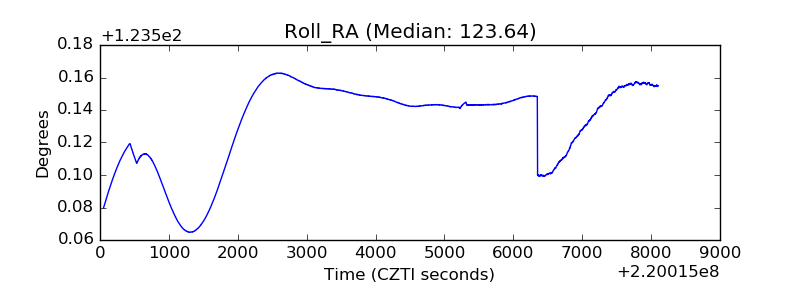 |
| Veto Counter | 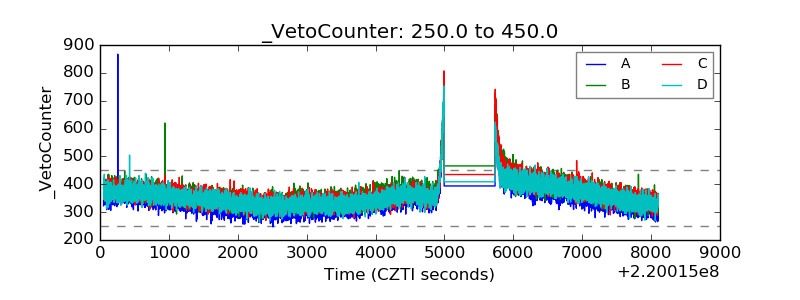 |