| Param | Original file | Final file |
|---|---|---|
| Filename | modeM0/AS1A02_075T01_9000000906_06666cztM0_level2.evt | modeM0/AS1A02_075T01_9000000906_06666cztM0_level2_quad_clean.evt |
| Size (bytes) | 574,871,040 | 65,724,480 |
| Size | 548.2 MB | 62.7 MB |
| Events in quadrant A | 2,935,251 | 402,230 |
| Events in quadrant B | 3,064,977 | 397,976 |
| Events in quadrant C | 3,769,372 | 388,650 |
| Events in quadrant D | 7,197,630 | 345,563 |
| Mode M9 | |||
|---|---|---|---|
| Quadrant | BADHDUFLAG | Total packets | Discarded packets |
| A | 0 | 7 | 0 |
| B | 0 | 7 | 0 |
| C | 0 | 7 | 0 |
| D | 0 | 7 | 0 |
| Mode M0 | |||
|---|---|---|---|
| Quadrant | BADHDUFLAG | Total packets | Discarded packets |
| A | 0 | 13246 | 2 |
| B | 0 | 13408 | 1 |
| C | 0 | 15691 | 1 |
| D | 0 | 25870 | 1 |
| Mode SS | |||
|---|---|---|---|
| Quadrant | BADHDUFLAG | Total packets | Discarded packets |
| A | 0 | 132 | 0 |
| B | 0 | 132 | 0 |
| C | 0 | 132 | 0 |
| D | 0 | 132 | 0 |
| Quadrant | Total seconds | Saturated seconds | Saturation percentage |
|---|---|---|---|
| A | 6521 | 63 | 0.966109% |
| B | 6521 | 72 | 1.104125% |
| C | 6521 | 54 | 0.828094% |
| D | 6521 | 1662 | 25.486889% |
Noise dominated data is calculated using 1-second bins in cleaned event files. If a bin has >2000 counts, and if more than 50% of those come from <1% of pixels, then it is considered to be noise-dominated and hence unusable.
| Quadrant | # 1 sec bins | Bins with >0 counts | Bins with >2000 counts | High rate bins dominated by noise | Noise dominated (total time) | Noise dominated (detector-on time) | Marked lightcurve |
|---|---|---|---|---|---|---|---|
| A | 7261 | 6522 | 2 | 2 | 0.03% | 0.03% | 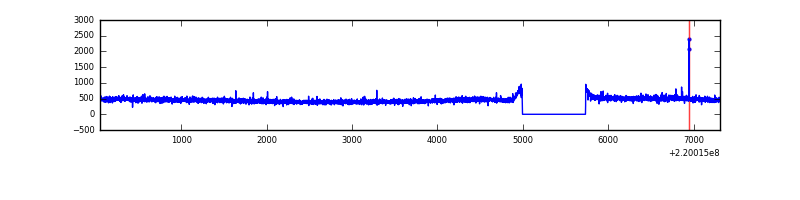 |
| B | 7261 | 6522 | 1 | 1 | 0.01% | 0.02% | 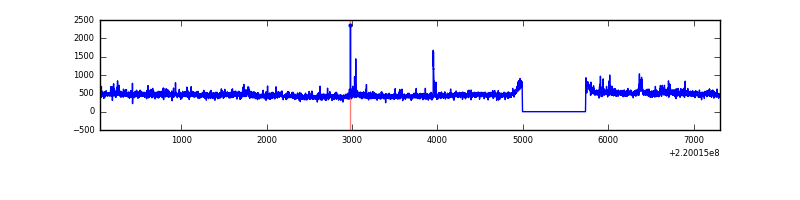 |
| C | 7261 | 6522 | 12 | 12 | 0.17% | 0.18% |  |
| D | 7261 | 6521 | 1215 | 1215 | 16.73% | 18.63% | 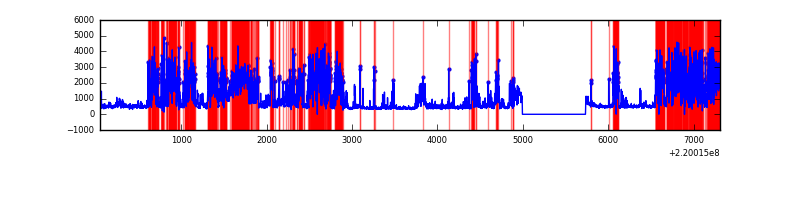 |
Top three noisy pixels from each quadrant. If the there are fewer than three noisy pixels in the level2.evt file, extra rows are filled as -1
| Pixel properties | Quadrant properties | ||||||
|---|---|---|---|---|---|---|---|
| Quadrant | DetID | PixID | Counts | Sigma | Mean | Median | Sigma |
| A | 3 | 1 | 14565 | 89.48 | 753 | 734 | 154.6 |
| A | 8 | 15 | 8638 | 51.14 | 753 | 734 | 154.6 |
| A | 0 | 226 | 7173 | 41.66 | 753 | 734 | 154.6 |
| B | 4 | 80 | 36912 | 246.07 | 756 | 737 | 147.0 |
| B | 0 | 228 | 34071 | 226.75 | 756 | 737 | 147.0 |
| B | 4 | 81 | 25188 | 166.32 | 756 | 737 | 147.0 |
| C | 9 | 247 | 909921 | 5392.56 | 725 | 728 | 168.6 |
| C | 8 | 128 | 12082 | 67.34 | 725 | 728 | 168.6 |
| C | 8 | 112 | 6005 | 31.3 | 725 | 728 | 168.6 |
| D | 2 | 33 | 4481653 | 28453.3 | 642 | 622 | 157.5 |
| D | 8 | 195 | 94789 | 597.93 | 642 | 622 | 157.5 |
| D | 2 | 63 | 87557 | 552.01 | 642 | 622 | 157.5 |
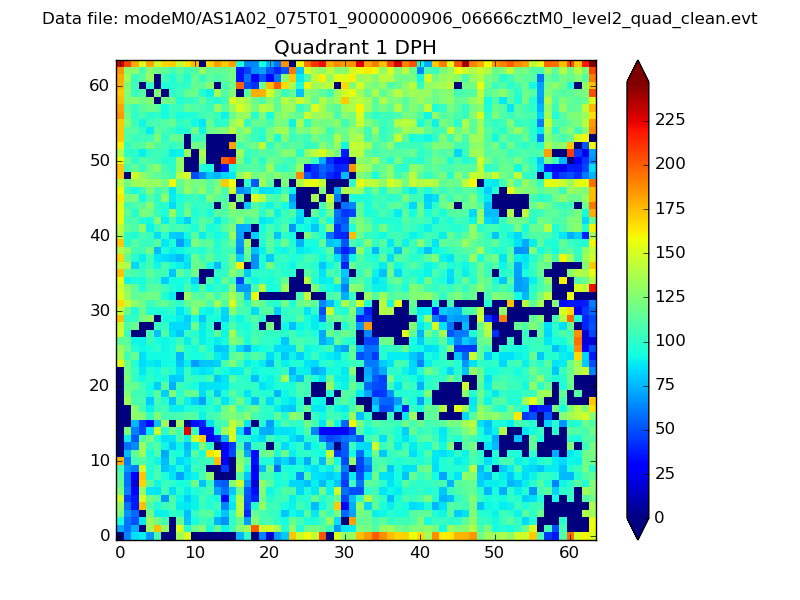
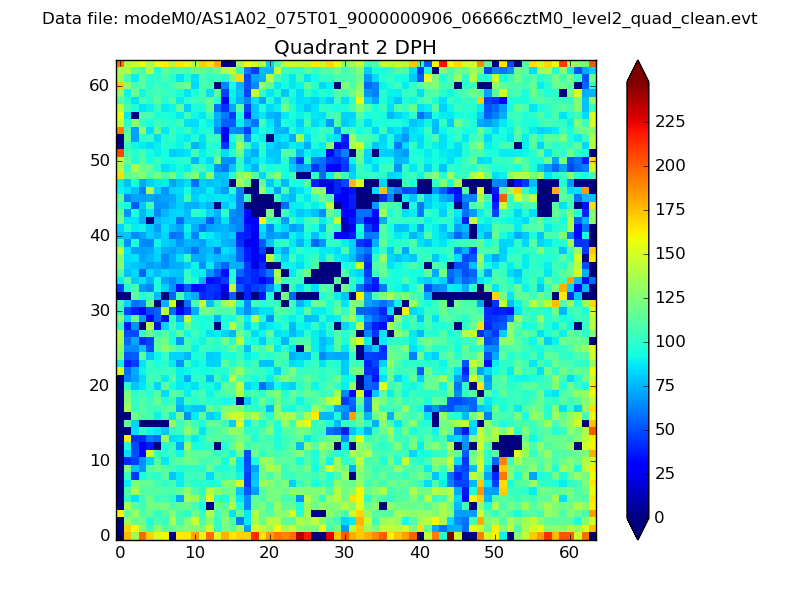
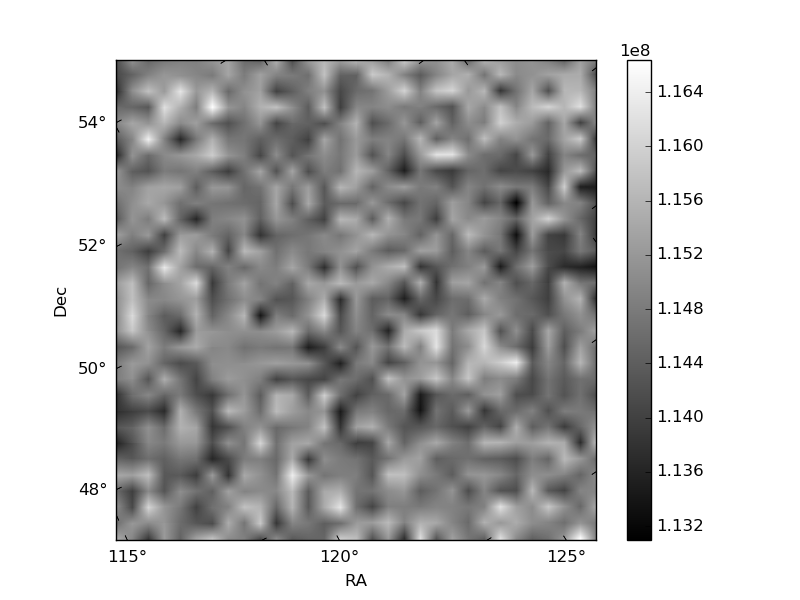
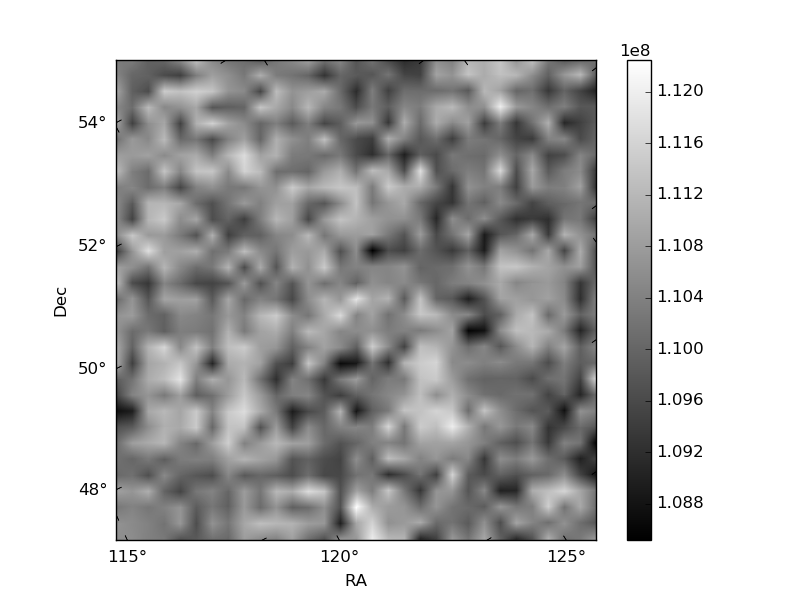
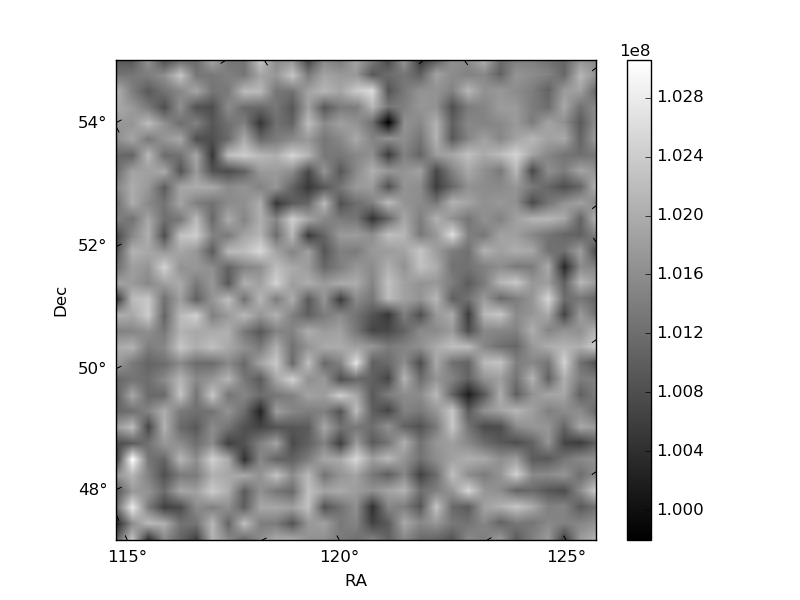
Histogram calculated using DETX and DETY for each event in the final _common_clean file
| Quadrant A |  |
 |
Quadrant B |
|---|---|---|---|
| Quadrant D | 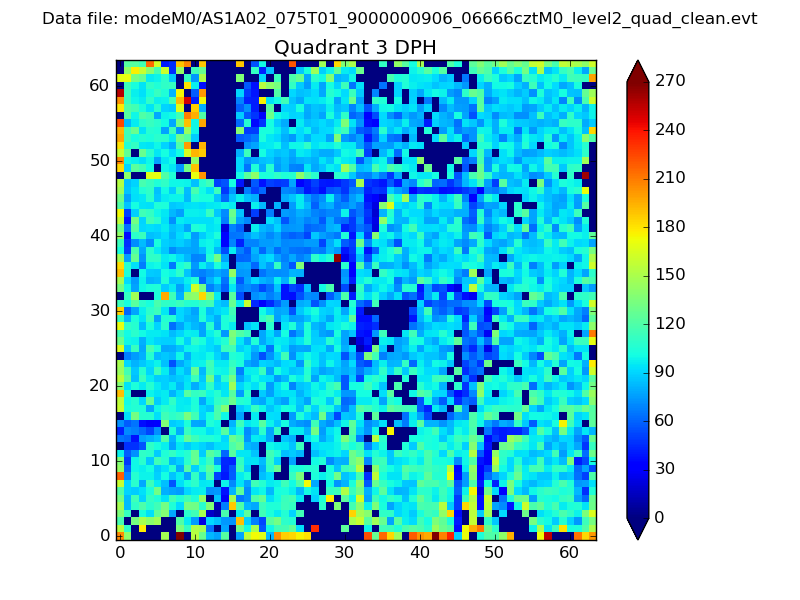 |
 |
Quadrant C |
| Plot type | Count rate plots | Images |
|---|---|---|
| Comparison with Poisson distribution Blue bars denote a histogram of data divided into 1 sec bins. Red curve is a Poisson curve with rate = median count rate of data. |
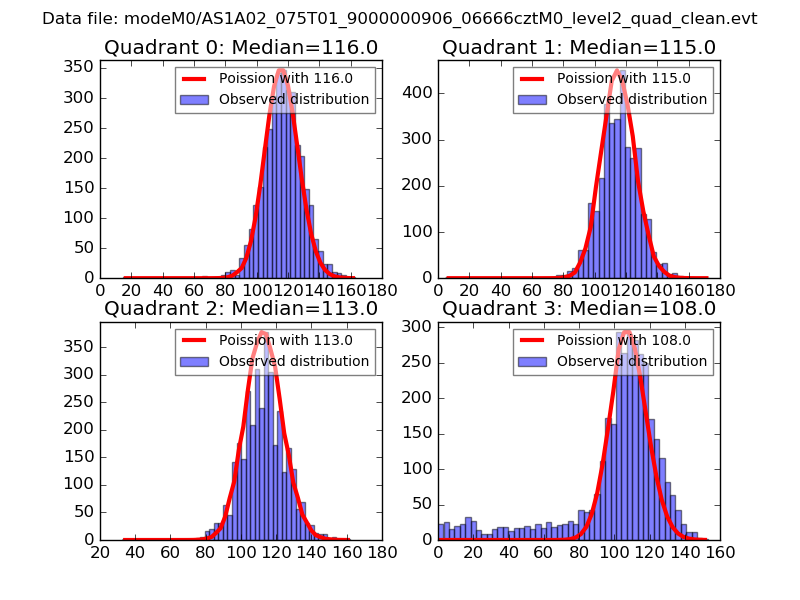 |
 |
| Quadrant-wise count rates Data is divided into 100 sec bins |
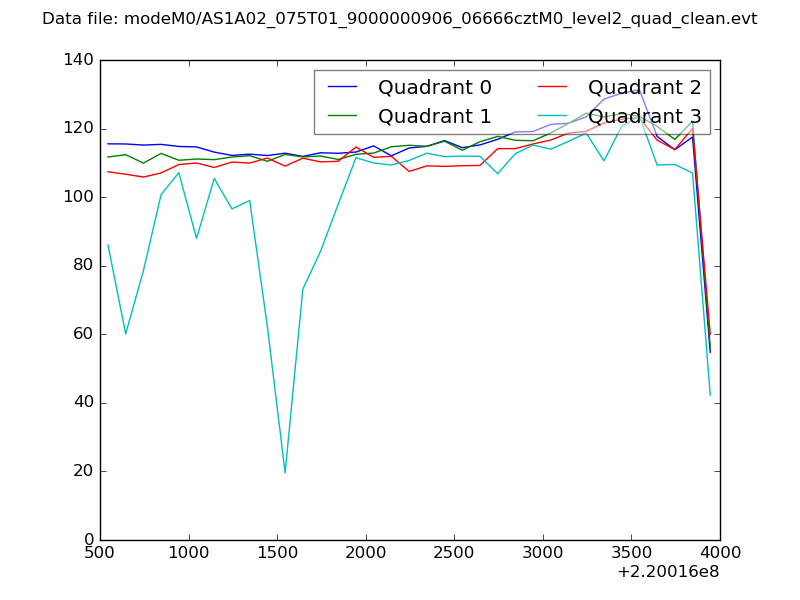 |
|
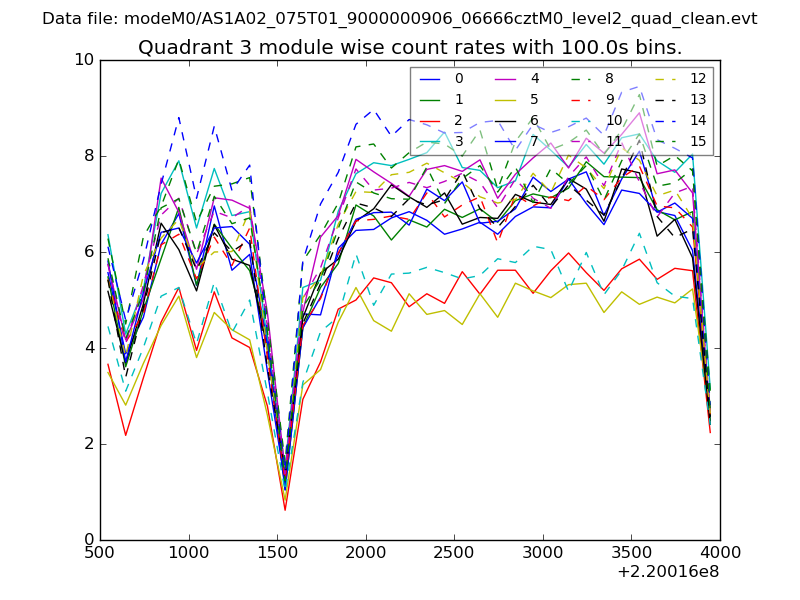
| Module-wise count rates for Quadrant A Data is divided into 100 sec bins |
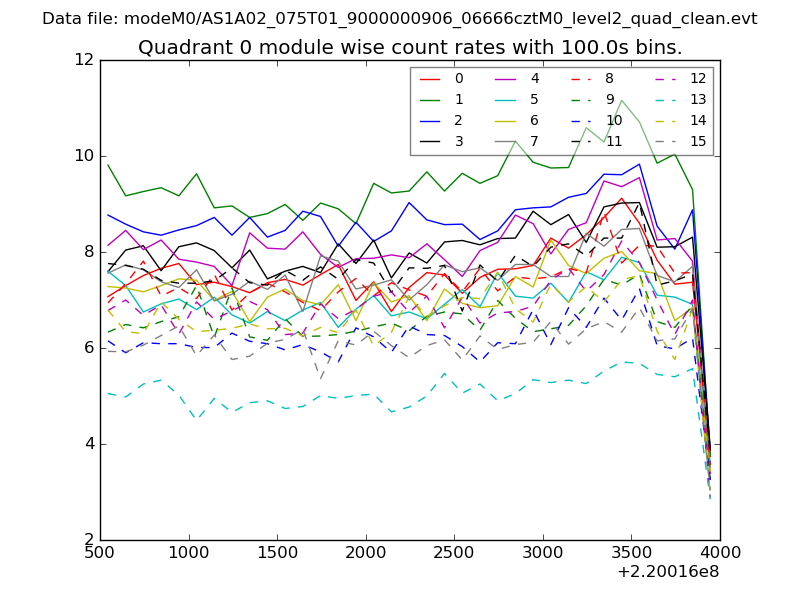 |
 |
| Module-wise count rates for Quadrant B Data is divided into 100 sec bins |
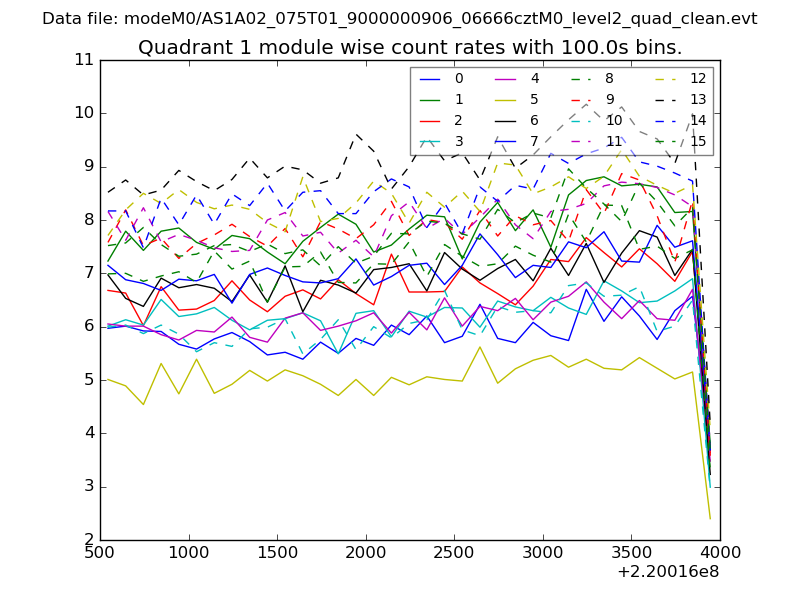 |
 |
| Module-wise count rates for Quadrant C Data is divided into 100 sec bins |
 |
 |
| Module-wise count rates for Quadrant D Data is divided into 100 sec bins |
 |
 |
| Parameter | Plot |
|---|---|
| CZT HV Monitor | 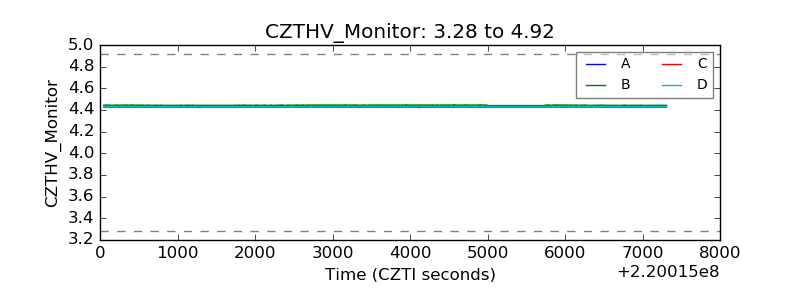 |
| D_VDD | 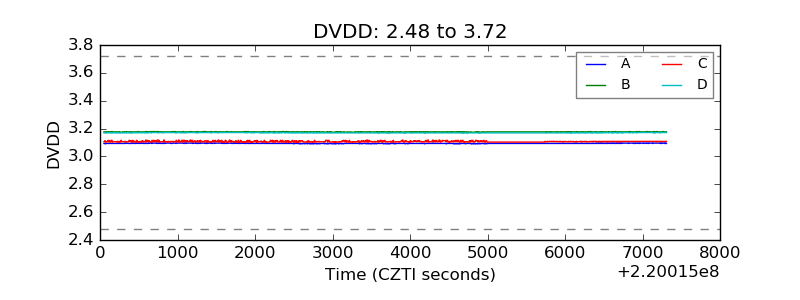 |
| Temperature 1 | 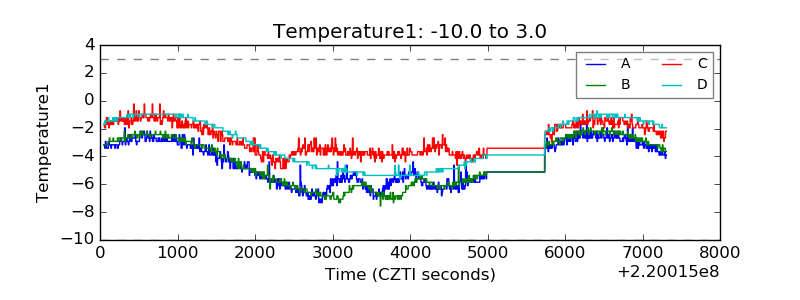 |
| Veto HV Monitor | 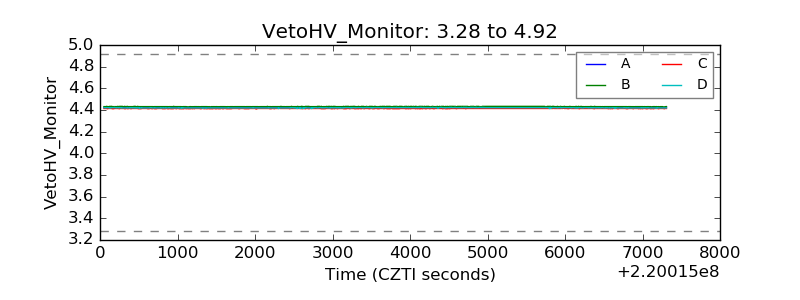 |
| Veto LLD | 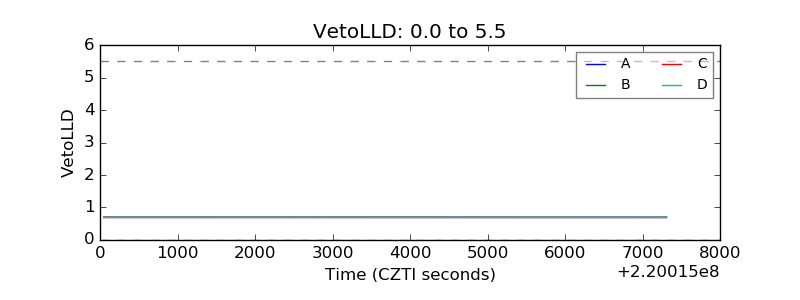 |
| Alpha Counter | 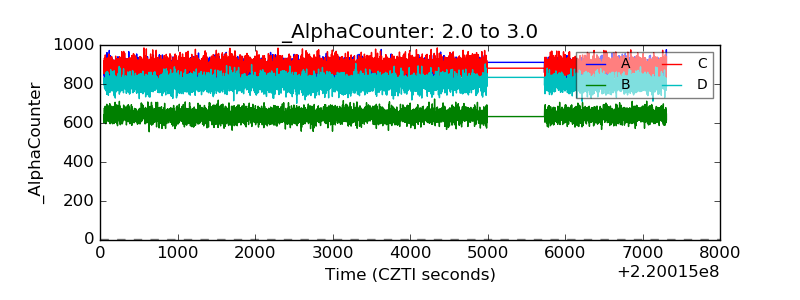 |
| _CPM_Rate | 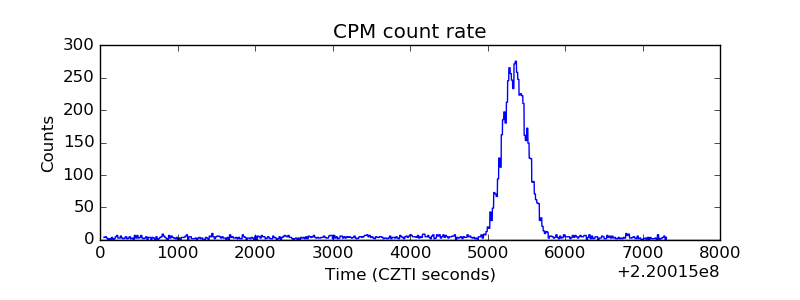 |
| CZT Counter | 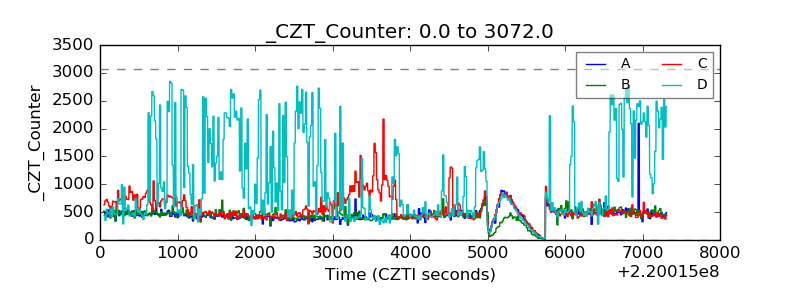 |
| +2.5 Volts monitor |  |
| +5 Volts monitor |  |
| _ROLL_ROT | 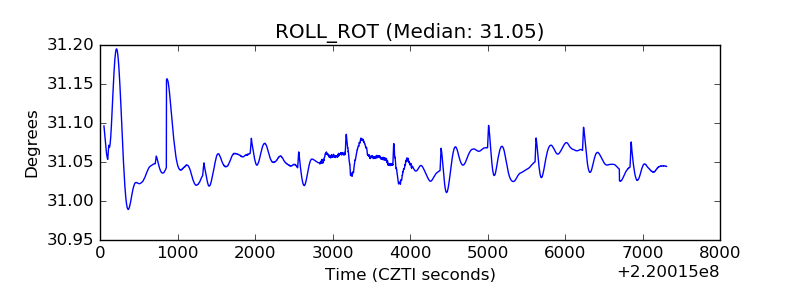 |
| _Roll_DEC | 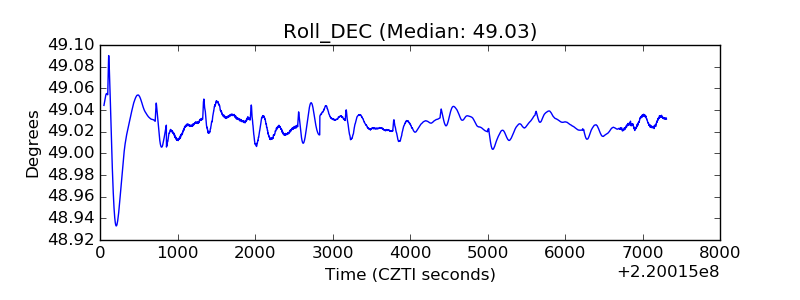 |
| _Roll_RA | 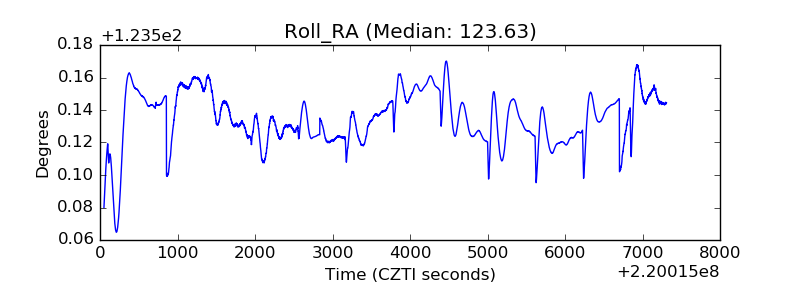 |
| Veto Counter | 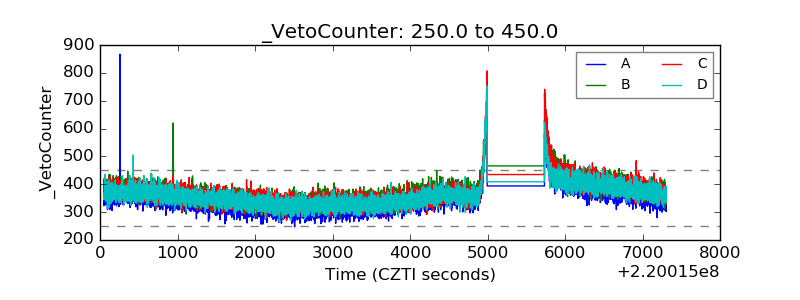 |