| Param | Original file | Final file |
|---|---|---|
| Filename | modeM0/AS1A02_075T01_9000000906_06667cztM0_level2.evt | modeM0/AS1A02_075T01_9000000906_06667cztM0_level2_quad_clean.evt |
| Size (bytes) | 225,835,200 | 15,549,120 |
| Size | 215.4 MB | 14.8 MB |
| Events in quadrant A | 1,133,075 | 81,634 |
| Events in quadrant B | 1,157,266 | 80,557 |
| Events in quadrant C | 1,080,876 | 77,953 |
| Events in quadrant D | 3,304,971 | 59,169 |
| Mode M9 | |||
|---|---|---|---|
| Quadrant | BADHDUFLAG | Total packets | Discarded packets |
| A | 0 | 5 | 0 |
| B | 0 | 5 | 0 |
| C | 0 | 5 | 0 |
| D | 0 | 6 | 0 |
| Mode M0 | |||
|---|---|---|---|
| Quadrant | BADHDUFLAG | Total packets | Discarded packets |
| A | 0 | 4868 | 1 |
| B | 0 | 4925 | 1 |
| C | 0 | 4794 | 1 |
| D | 0 | 11385 | 1 |
| Mode SS | |||
|---|---|---|---|
| Quadrant | BADHDUFLAG | Total packets | Discarded packets |
| A | 0 | 48 | 0 |
| B | 0 | 48 | 0 |
| C | 0 | 48 | 0 |
| D | 0 | 48 | 0 |
| Quadrant | Total seconds | Saturated seconds | Saturation percentage |
|---|---|---|---|
| A | 2366 | 22 | 0.929839% |
| B | 2366 | 22 | 0.929839% |
| C | 2366 | 11 | 0.464920% |
| D | 2366 | 958 | 40.490279% |
Noise dominated data is calculated using 1-second bins in cleaned event files. If a bin has >2000 counts, and if more than 50% of those come from <1% of pixels, then it is considered to be noise-dominated and hence unusable.
| Quadrant | # 1 sec bins | Bins with >0 counts | Bins with >2000 counts | High rate bins dominated by noise | Noise dominated (total time) | Noise dominated (detector-on time) | Marked lightcurve |
|---|---|---|---|---|---|---|---|
| A | 2366 | 2366 | 2 | 2 | 0.08% | 0.08% | 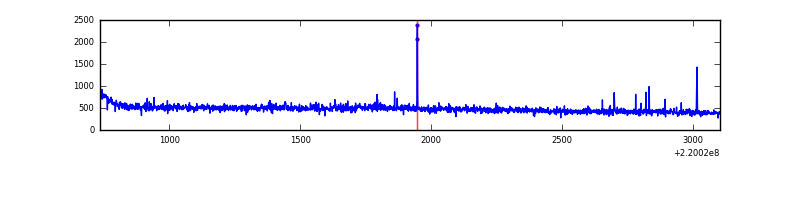 |
| B | 2366 | 2366 | 0 | 0 | 0.00% | 0.00% | 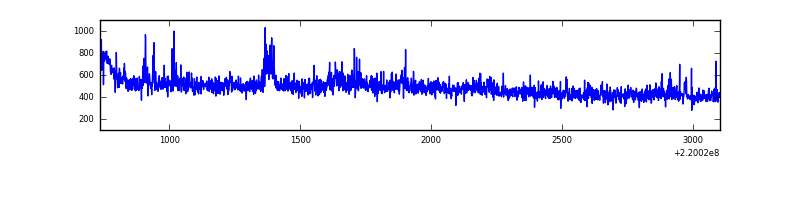 |
| C | 2366 | 2366 | 0 | 0 | 0.00% | 0.00% | 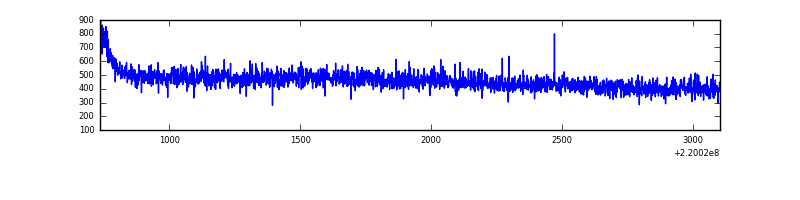 |
| D | 2366 | 2365 | 698 | 698 | 29.50% | 29.51% | 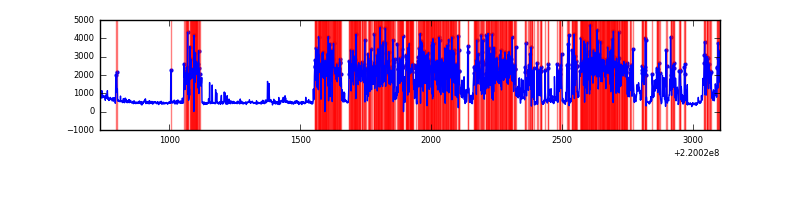 |
Top three noisy pixels from each quadrant. If the there are fewer than three noisy pixels in the level2.evt file, extra rows are filled as -1
| Pixel properties | Quadrant properties | ||||||
|---|---|---|---|---|---|---|---|
| Quadrant | DetID | PixID | Counts | Sigma | Mean | Median | Sigma |
| A | 3 | 1 | 12586 | 202.49 | 287 | 279 | 60.8 |
| A | 14 | 111 | 12026 | 193.27 | 287 | 279 | 60.8 |
| A | 8 | 15 | 3424 | 51.74 | 287 | 279 | 60.8 |
| B | 0 | 214 | 14429 | 246.77 | 286 | 279 | 57.3 |
| B | 4 | 81 | 13975 | 238.85 | 286 | 279 | 57.3 |
| B | 15 | 204 | 5862 | 97.36 | 286 | 279 | 57.3 |
| C | 9 | 247 | 3016 | 41.82 | 276 | 277 | 65.5 |
| C | 13 | 61 | 2090 | 27.68 | 276 | 277 | 65.5 |
| C | 9 | 221 | 735 | 6.99 | 276 | 277 | 65.5 |
| D | 2 | 33 | 2375837 | 42659.7 | 223 | 216 | 55.7 |
| D | 2 | 152 | 24480 | 435.72 | 223 | 216 | 55.7 |
| D | 13 | 169 | 23080 | 410.58 | 223 | 216 | 55.7 |
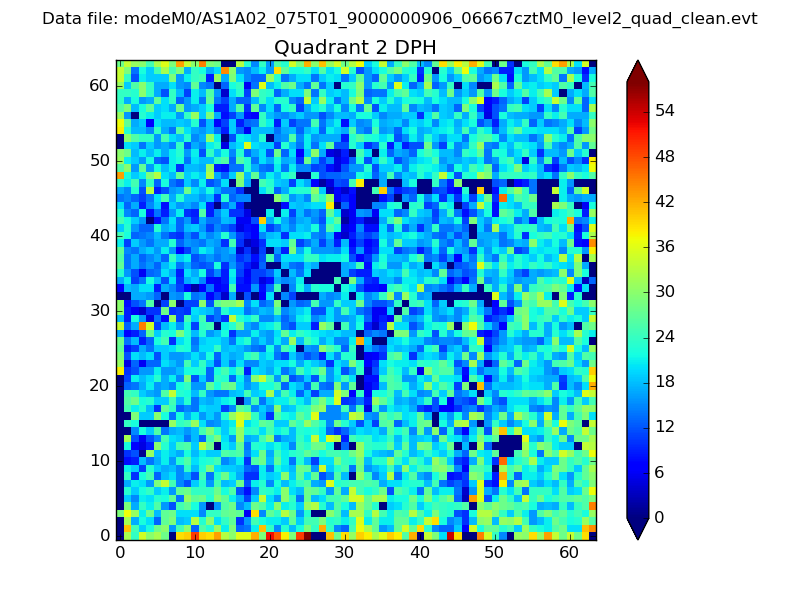
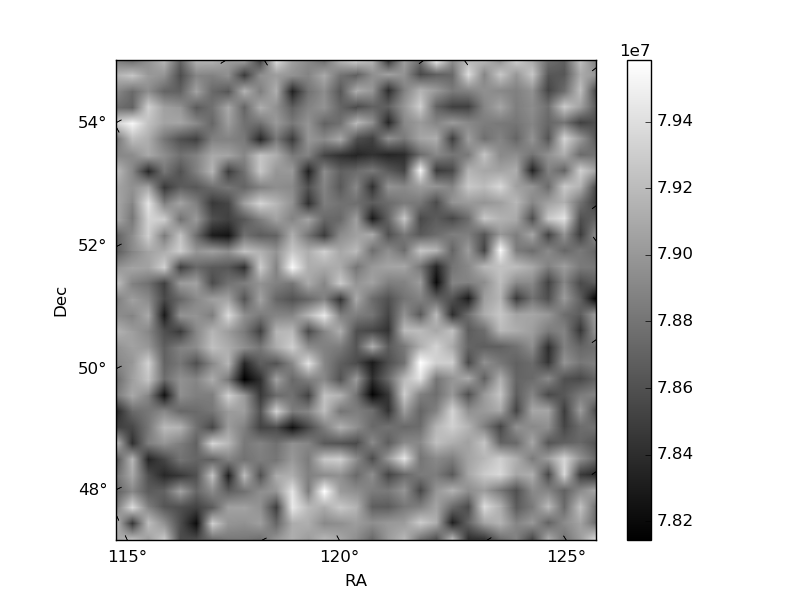
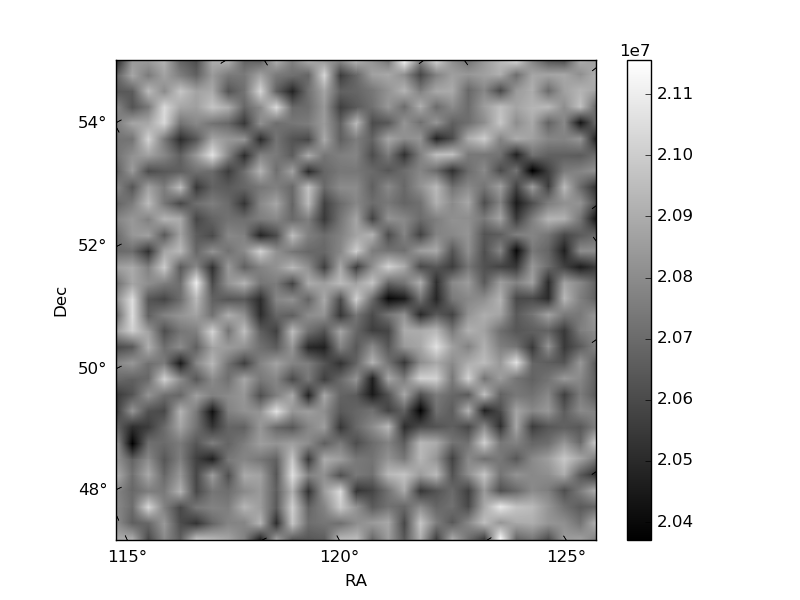
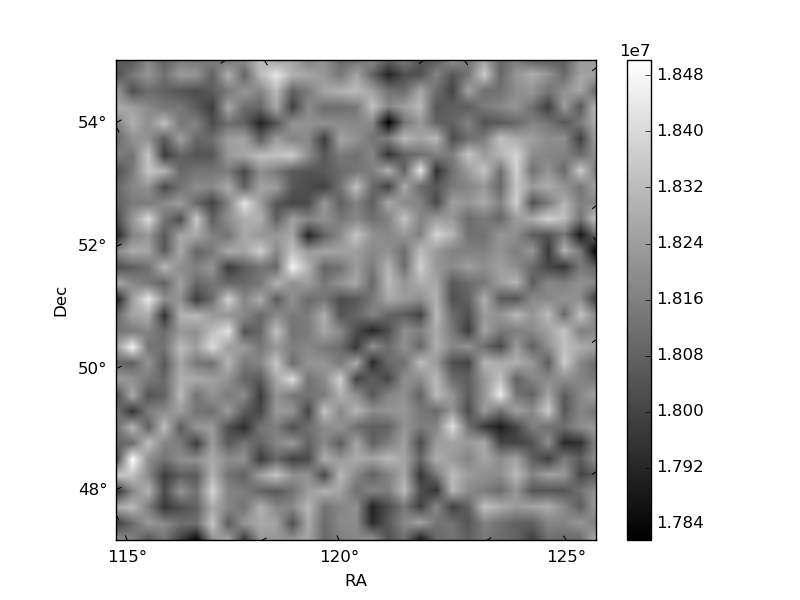
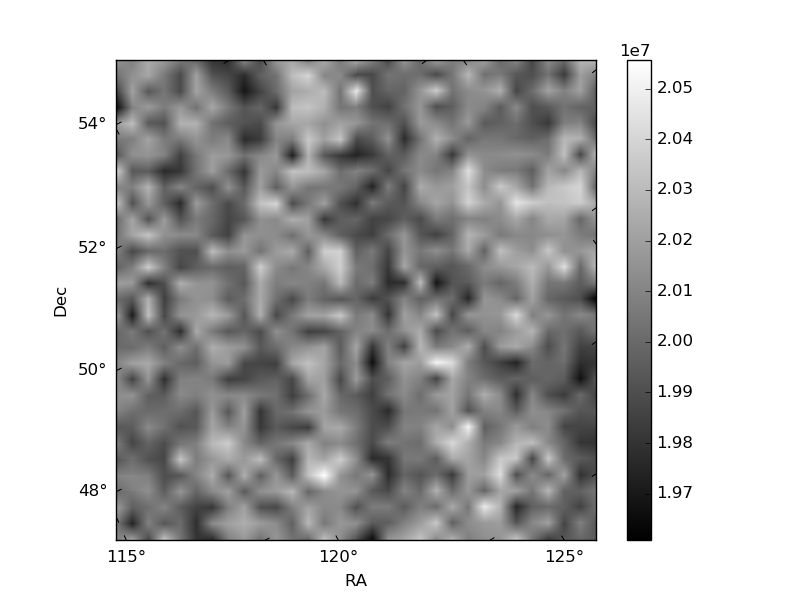
Histogram calculated using DETX and DETY for each event in the final _common_clean file
| Quadrant A | 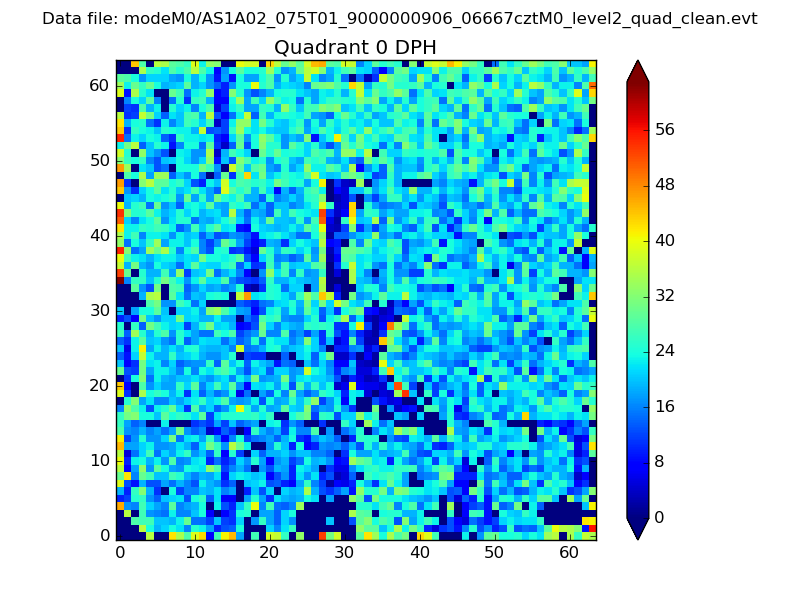 |
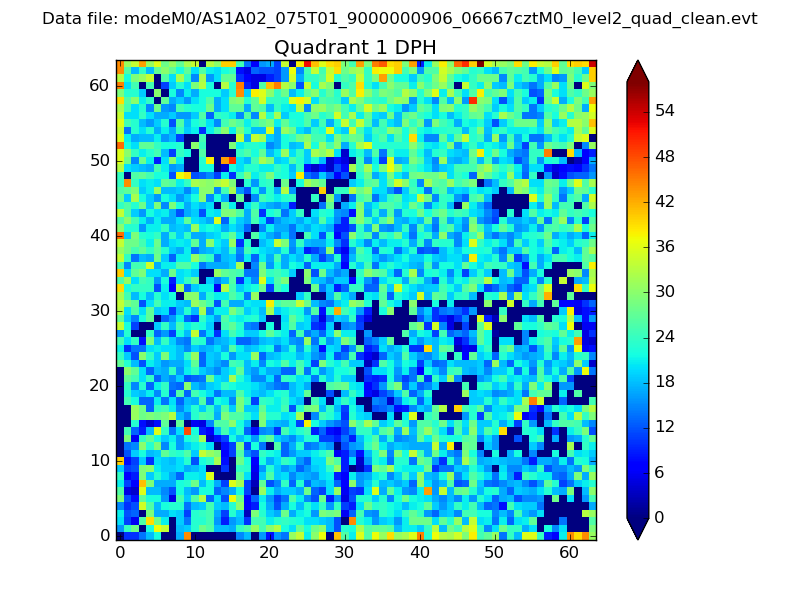 |
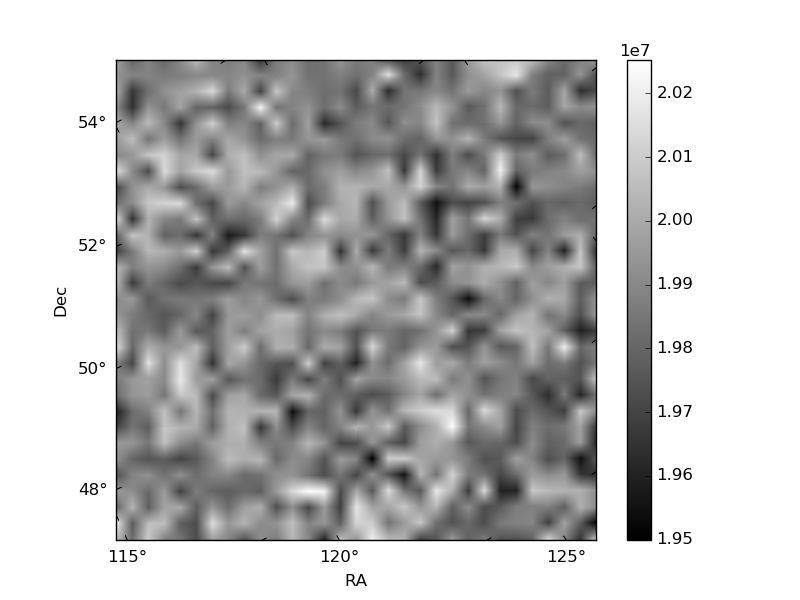
Quadrant B |
|---|---|---|---|
| Quadrant D | 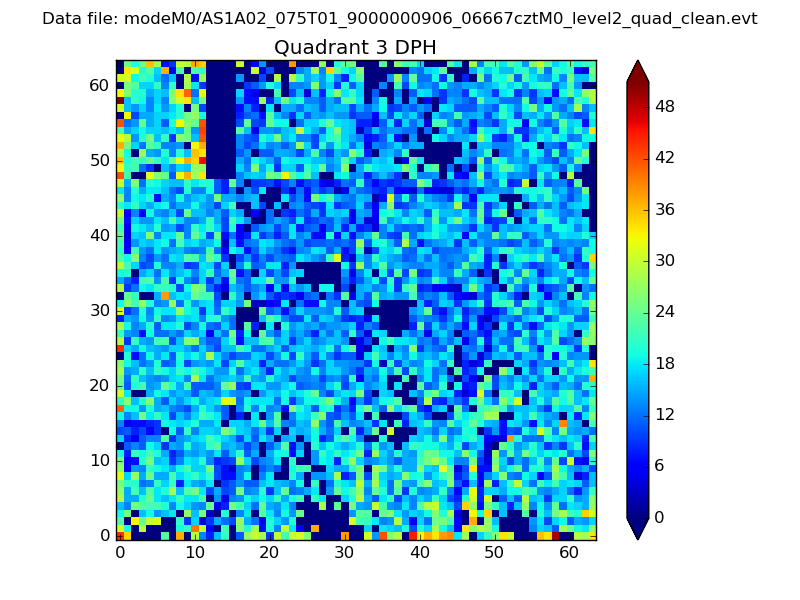 |
 |
Quadrant C |
| Plot type | Count rate plots | Images |
|---|---|---|
| Comparison with Poisson distribution Blue bars denote a histogram of data divided into 1 sec bins. Red curve is a Poisson curve with rate = median count rate of data. |
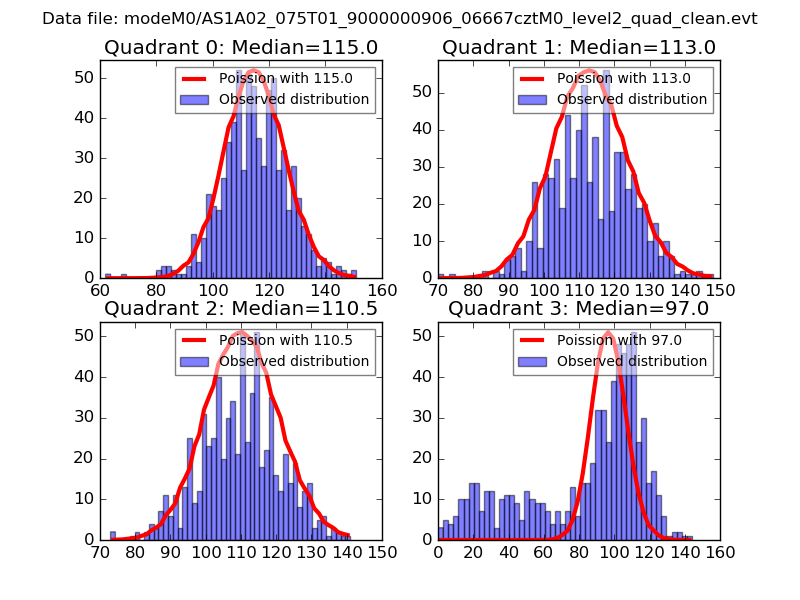 |
 |
| Quadrant-wise count rates Data is divided into 100 sec bins |
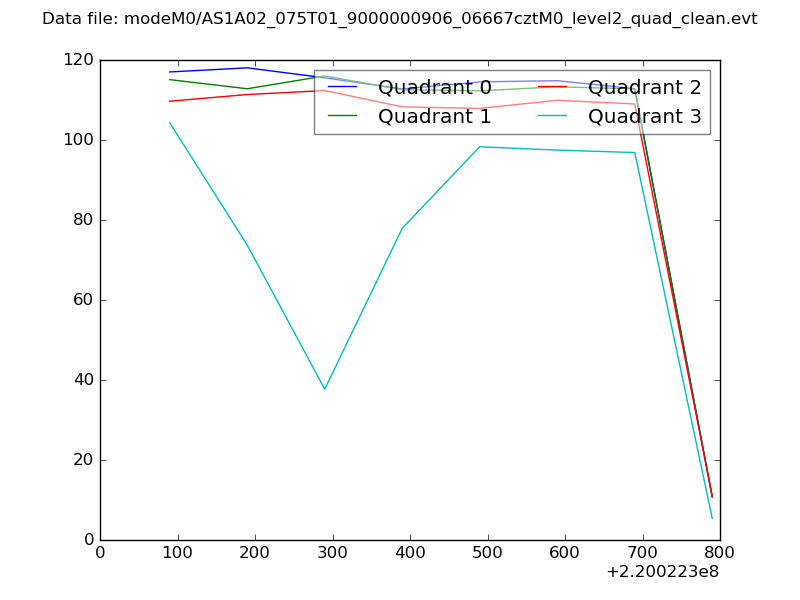 |
|
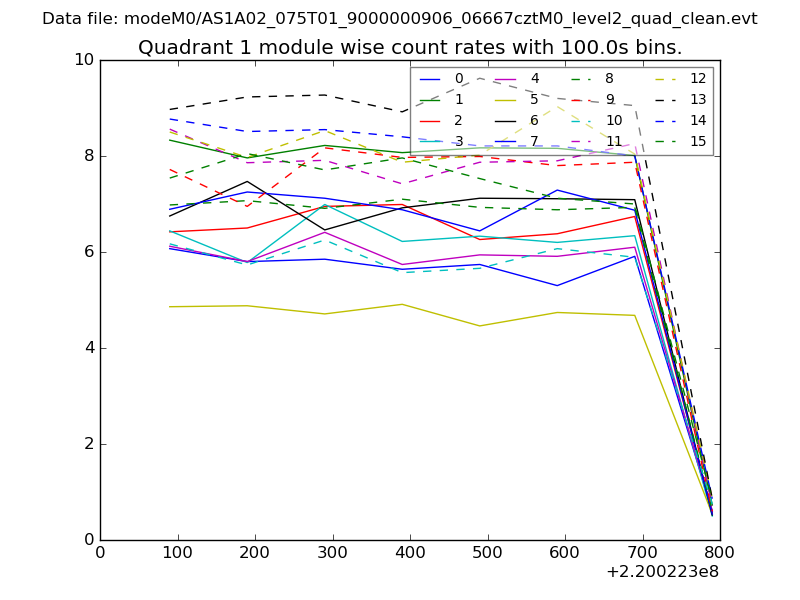
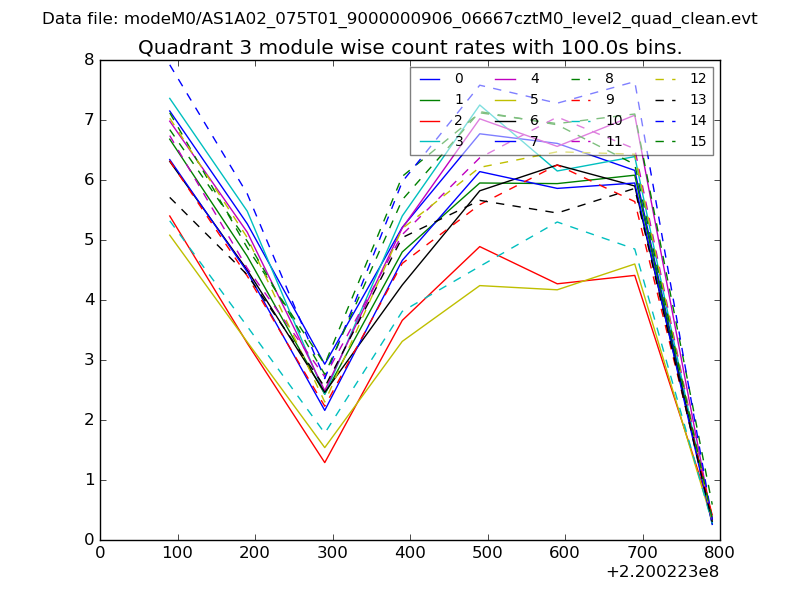
| Module-wise count rates for Quadrant A Data is divided into 100 sec bins |
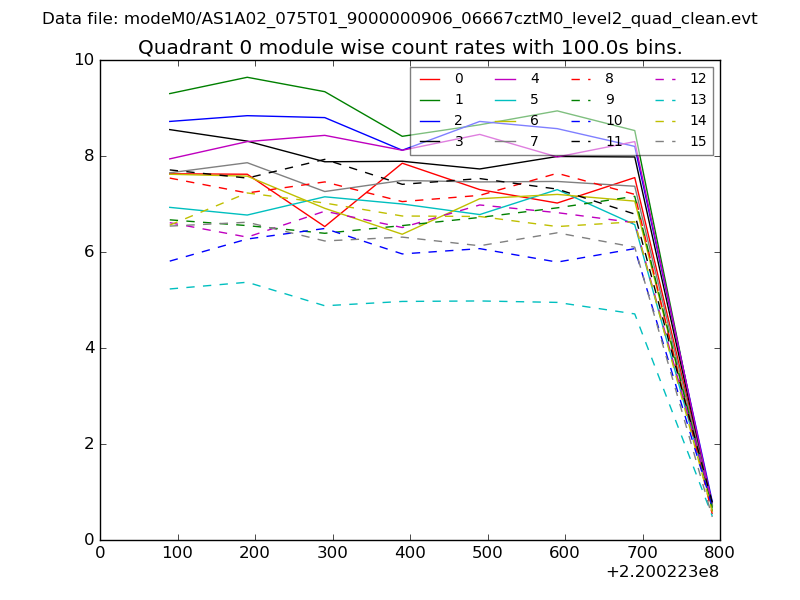 |
 |
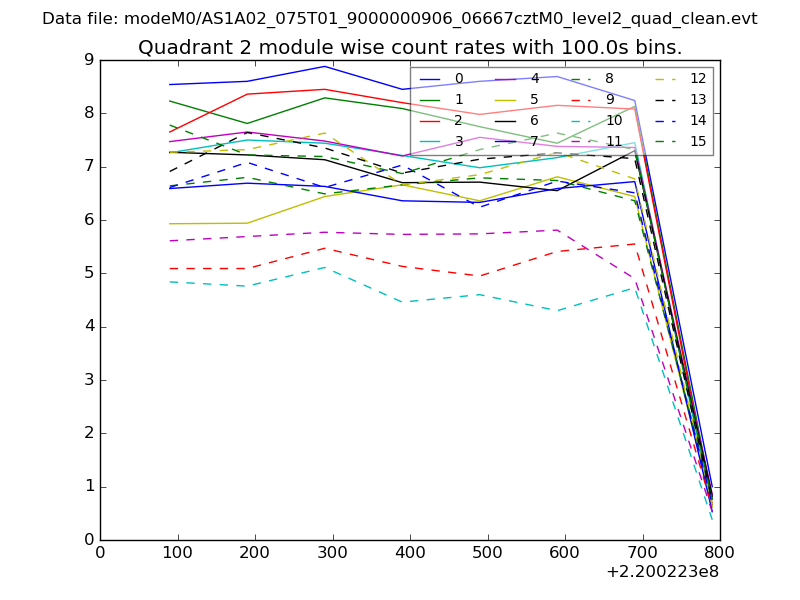
| Module-wise count rates for Quadrant B Data is divided into 100 sec bins |
 |
 |
| Module-wise count rates for Quadrant C Data is divided into 100 sec bins |
 |
 |
| Module-wise count rates for Quadrant D Data is divided into 100 sec bins |
 |
 |
| Parameter | Plot |
|---|---|
| CZT HV Monitor | 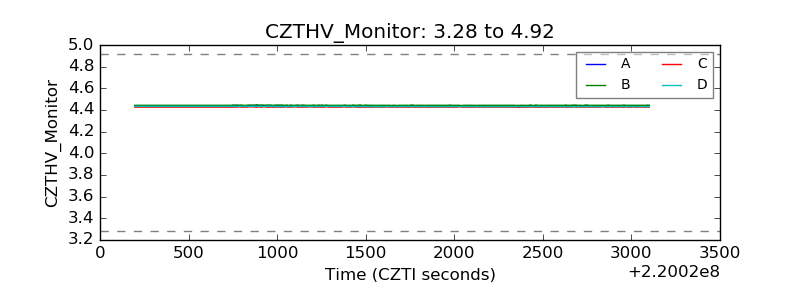 |
| D_VDD | 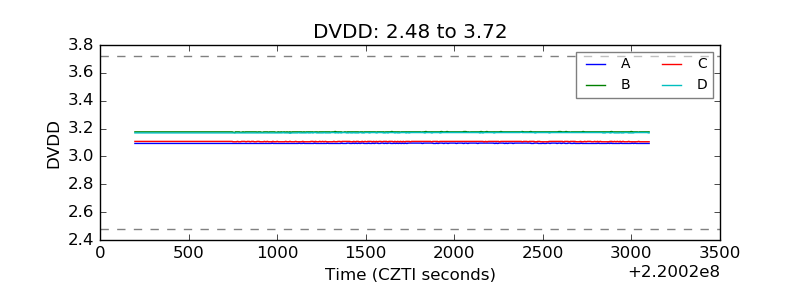 |
| Temperature 1 | 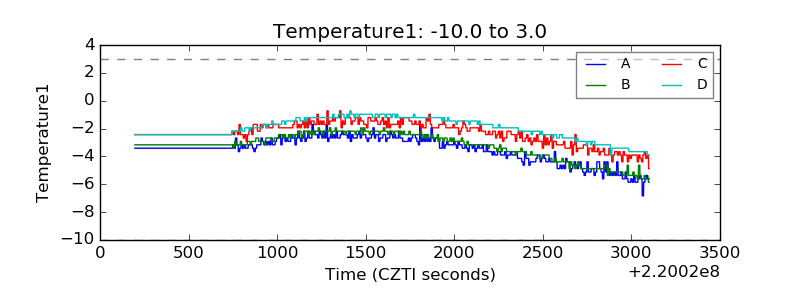 |
| Veto HV Monitor | 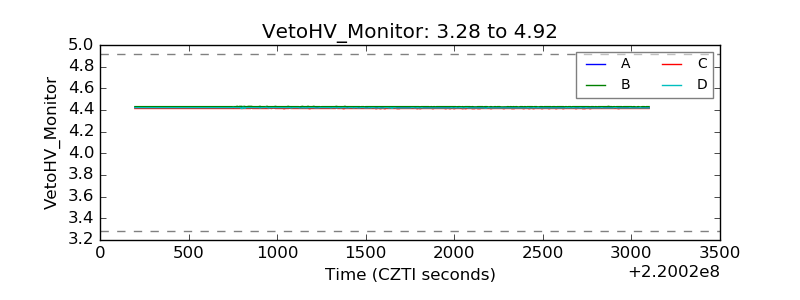 |
| Veto LLD | 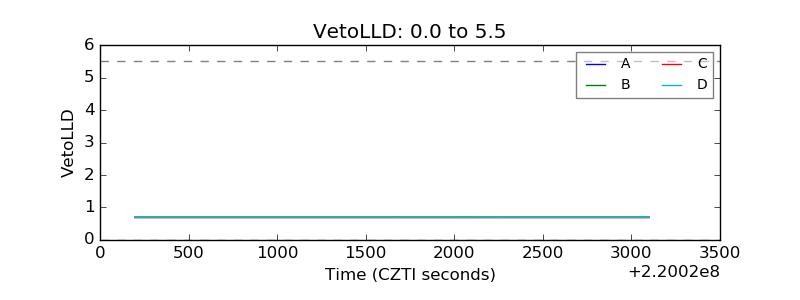 |
| Alpha Counter | 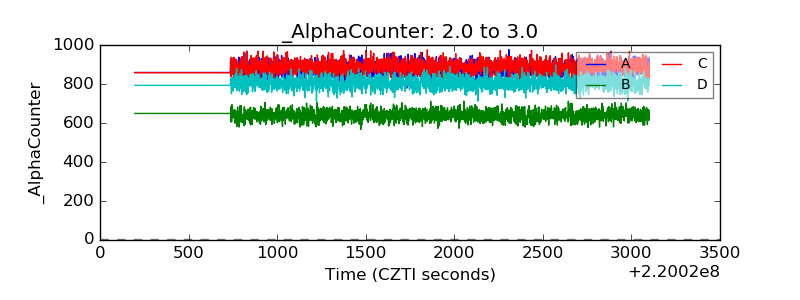 |
| _CPM_Rate | 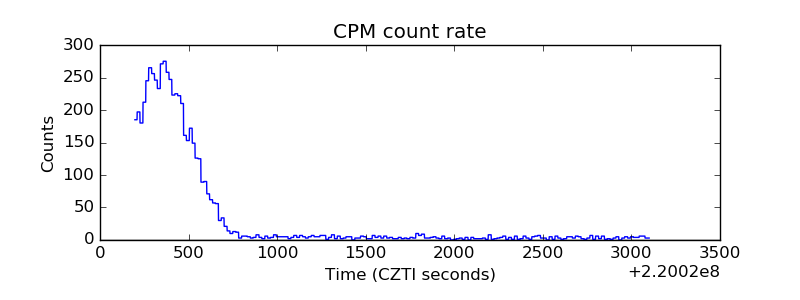 |
| CZT Counter | 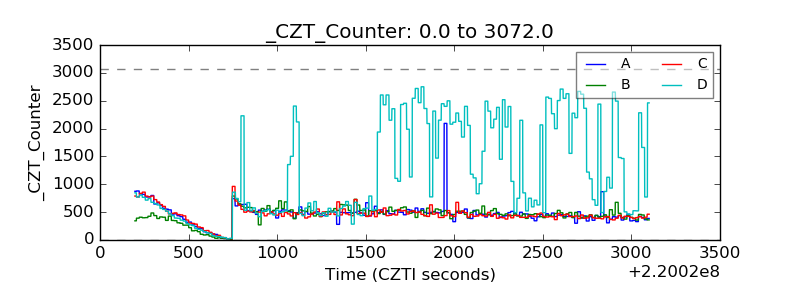 |
| +2.5 Volts monitor |  |
| +5 Volts monitor |  |
| _ROLL_ROT | 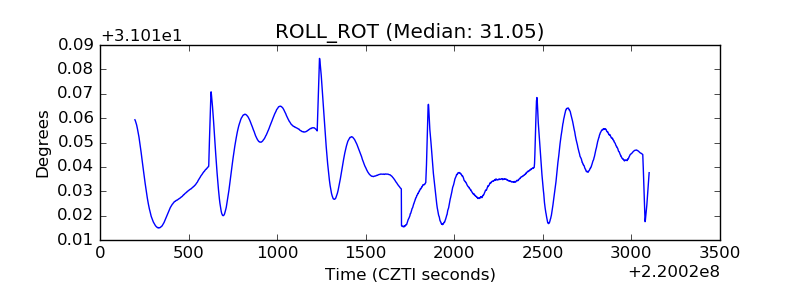 |
| _Roll_DEC | 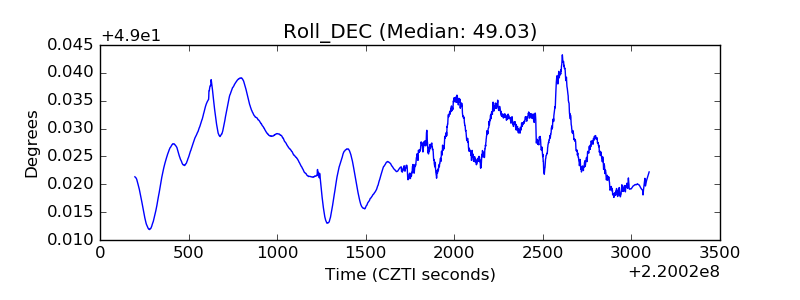 |
| _Roll_RA | 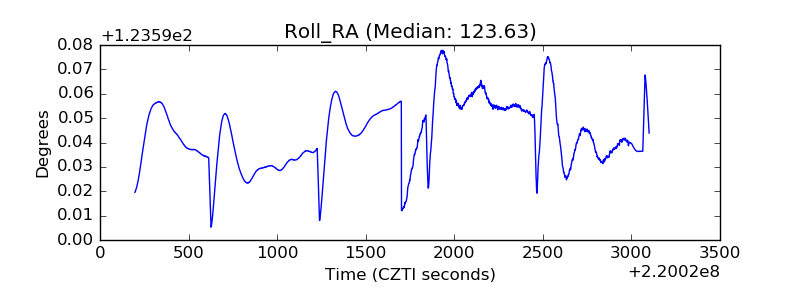 |
| Veto Counter | 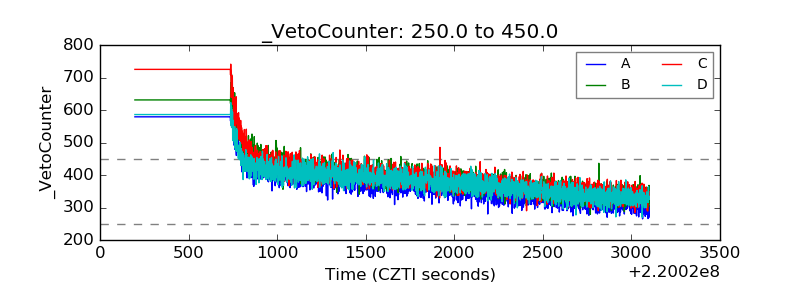 |