| Param | Original file | Final file |
|---|---|---|
| Filename | modeM0/AS1A02_170T03_9000000910cztM0_level2.fits | modeM0/AS1A02_170T03_9000000910cztM0_level2_quad_clean.evt |
| Size (bytes) | 160,534,080 | 135,037,440 |
| Size | 153.1 MB | 128.8 MB |
| Events in quadrant A | 967,814 | 790,162 |
| Events in quadrant B | 985,126 | 785,130 |
| Events in quadrant C | 1,003,170 | 760,088 |
| Events in quadrant D | 660,798 | 510,403 |
| Mode M0 | |||
|---|---|---|---|
| Quadrant | BADHDUFLAG | Total packets | Discarded packets |
| A | 0 | 41723 | 0 |
| B | 0 | 40358 | 0 |
| C | 0 | 39817 | 0 |
| D | 0 | 72327 | 0 |
| Mode M9 | |||
|---|---|---|---|
| Quadrant | BADHDUFLAG | Total packets | Discarded packets |
| A | 0 | 50 | 0 |
| B | 0 | 50 | 0 |
| C | 0 | 50 | 0 |
| D | 0 | 50 | 0 |
| Mode SS | |||
|---|---|---|---|
| Quadrant | BADHDUFLAG | Total packets | Discarded packets |
| A | 0 | 368 | 0 |
| B | 0 | 368 | 0 |
| C | 0 | 368 | 0 |
| D | 0 | 368 | 0 |
| Quadrant | Total seconds | Saturated seconds | Saturation percentage |
|---|---|---|---|
| A | 18029 | 381 | 2.113262% |
| B | 18029 | 252 | 1.397748% |
| C | 18029 | 245 | 1.358922% |
| D | 18029 | 5004 | 27.755283% |
Noise dominated data is calculated using 1-second bins in cleaned event files. If a bin has >2000 counts, and if more than 50% of those come from <1% of pixels, then it is considered to be noise-dominated and hence unusable.
| Quadrant | # 1 sec bins | Bins with >0 counts | Bins with >2000 counts | High rate bins dominated by noise | Noise dominated (total time) | Noise dominated (detector-on time) | Marked lightcurve |
|---|---|---|---|---|---|---|---|
| A | 23044 | 17729 | 0 | 0 | 0.00% | 0.00% |  |
| B | 23044 | 17873 | 0 | 0 | 0.00% | 0.00% |  |
| C | 23044 | 17940 | 0 | 0 | 0.00% | 0.00% |  |
| D | 23044 | 17068 | 0 | 0 | 0.00% | 0.00% |  |
Top three noisy pixels from each quadrant. If the there are fewer than three noisy pixels in the level2.evt file, extra rows are filled as -1
| Pixel properties | Quadrant properties | ||||||
|---|---|---|---|---|---|---|---|
| Quadrant | DetID | PixID | Counts | Sigma | Mean | Median | Sigma |
| A | 14 | 188 | 1034 | 12.34 | 251 | 236 | 64.7 |
| A | 0 | 29 | 997 | 11.77 | 251 | 236 | 64.7 |
| A | 14 | 204 | 914 | 10.49 | 251 | 236 | 64.7 |
| B | 2 | 9 | 836 | 11.01 | 259 | 247 | 53.5 |
| B | 5 | 128 | 690 | 8.28 | 259 | 247 | 53.5 |
| B | 3 | 80 | 674 | 7.98 | 259 | 247 | 53.5 |
| C | 12 | 250 | 806 | 8.0 | 264 | 247 | 69.9 |
| C | 9 | 188 | 735 | 6.98 | 264 | 247 | 69.9 |
| C | 1 | 80 | 733 | 6.95 | 264 | 247 | 69.9 |
| D | 3 | 14 | 513 | 6.53 | 188 | 171 | 52.4 |
| D | 4 | 246 | 504 | 6.36 | 188 | 171 | 52.4 |
| D | 7 | 5 | 503 | 6.34 | 188 | 171 | 52.4 |
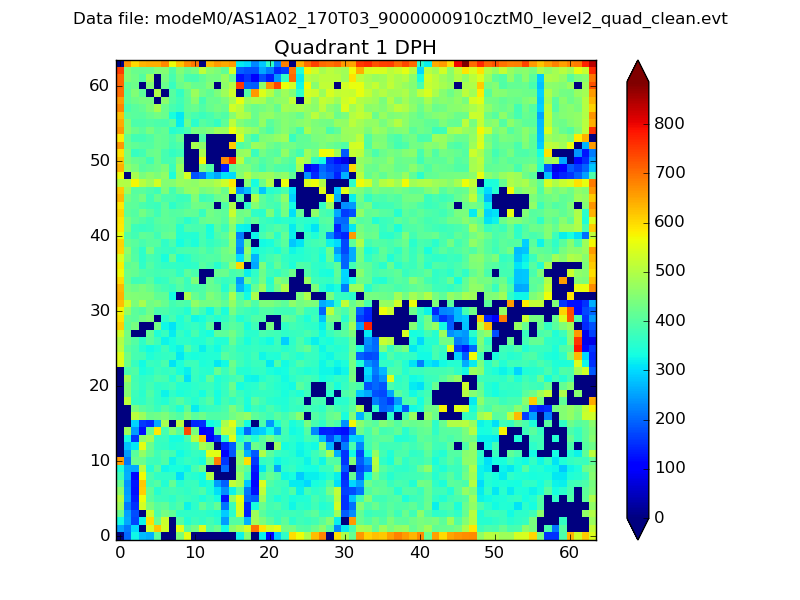
Histogram calculated using DETX and DETY for each event in the final _common_clean file
| Quadrant A |  |
 |
Quadrant B |
|---|---|---|---|
| Quadrant D | 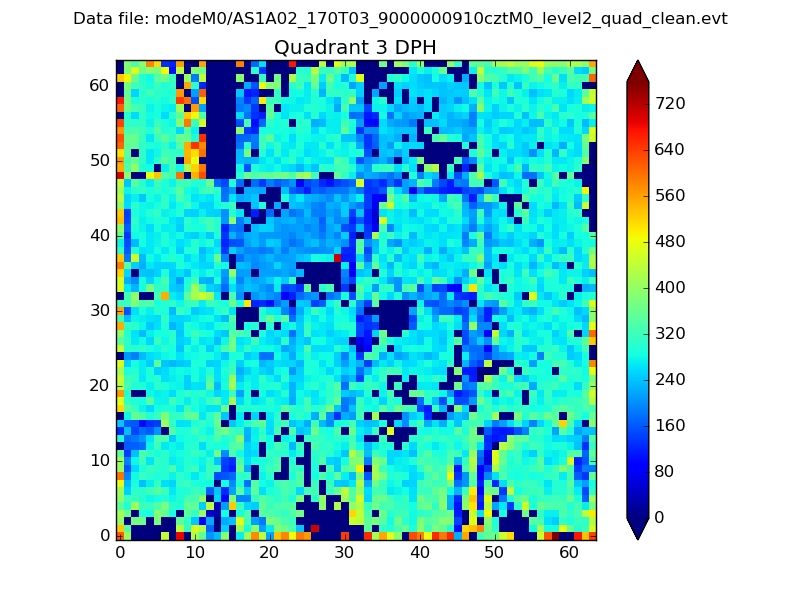 |
 |
Quadrant C |
| Plot type | Count rate plots | Images |
|---|---|---|
| Comparison with Poisson distribution Blue bars denote a histogram of data divided into 1 sec bins. Red curve is a Poisson curve with rate = median count rate of data. |
 |
 |
| Quadrant-wise count rates Data is divided into 100 sec bins |
 |
|
| Module-wise count rates for Quadrant A Data is divided into 100 sec bins |
 |
 |
| Module-wise count rates for Quadrant B Data is divided into 100 sec bins |
 |
 |
| Module-wise count rates for Quadrant C Data is divided into 100 sec bins |
 |
 |
| Module-wise count rates for Quadrant D Data is divided into 100 sec bins |
 |
 |
| Parameter | Plot |
|---|---|
| CZT HV Monitor |  |
| D_VDD |  |
| Temperature 1 |  |
| Veto HV Monitor |  |
| Veto LLD |  |
| Alpha Counter |  |
| _CPM_Rate |  |
| CZT Counter |  |
| +2.5 Volts monitor |  |
| +5 Volts monitor |  |
| _ROLL_ROT |  |
| _Roll_DEC |  |
| _Roll_RA |  |
| Veto Counter |  |