| Param | Original file | Final file |
|---|---|---|
| Filename | modeM0/AS1A02_170T03_9000000910_06670cztM0_level2.evt | modeM0/AS1A02_170T03_9000000910_06670cztM0_level2_quad_clean.evt |
| Size (bytes) | 421,629,120 | 44,510,400 |
| Size | 402.1 MB | 42.4 MB |
| Events in quadrant A | 2,621,492 | 320,648 |
| Events in quadrant B | 2,263,320 | 318,000 |
| Events in quadrant C | 2,256,411 | 315,513 |
| Events in quadrant D | 5,396,466 | 151,386 |
| Mode M0 | |||
|---|---|---|---|
| Quadrant | BADHDUFLAG | Total packets | Discarded packets |
| A | 0 | 10118 | 2 |
| B | 0 | 9180 | 1 |
| C | 0 | 9136 | 1 |
| D | 0 | 18429 | 1 |
| Mode M9 | |||
|---|---|---|---|
| Quadrant | BADHDUFLAG | Total packets | Discarded packets |
| A | 0 | 11 | 0 |
| B | 0 | 11 | 0 |
| C | 0 | 11 | 0 |
| D | 0 | 11 | 0 |
| Mode SS | |||
|---|---|---|---|
| Quadrant | BADHDUFLAG | Total packets | Discarded packets |
| A | 0 | 70 | 0 |
| B | 0 | 70 | 0 |
| C | 0 | 70 | 0 |
| D | 0 | 70 | 0 |
| Quadrant | Total seconds | Saturated seconds | Saturation percentage |
|---|---|---|---|
| A | 3402 | 267 | 7.848325% |
| B | 3402 | 161 | 4.732510% |
| C | 3402 | 155 | 4.556143% |
| D | 3402 | 1700 | 49.970606% |
Noise dominated data is calculated using 1-second bins in cleaned event files. If a bin has >2000 counts, and if more than 50% of those come from <1% of pixels, then it is considered to be noise-dominated and hence unusable.
| Quadrant | # 1 sec bins | Bins with >0 counts | Bins with >2000 counts | High rate bins dominated by noise | Noise dominated (total time) | Noise dominated (detector-on time) | Marked lightcurve |
|---|---|---|---|---|---|---|---|
| A | 4552 | 3402 | 204 | 204 | 4.48% | 6.00% |  |
| B | 4552 | 3403 | 74 | 74 | 1.63% | 2.17% | 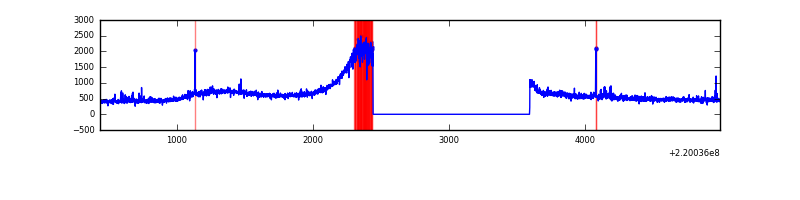 |
| C | 4552 | 3403 | 106 | 106 | 2.33% | 3.11% | 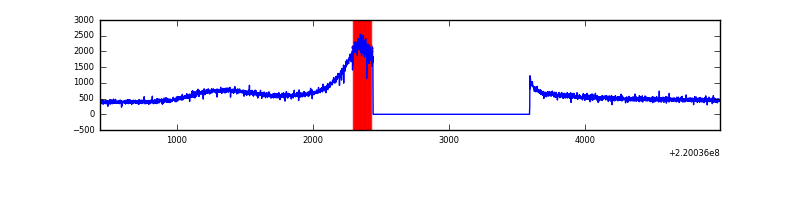 |
| D | 4552 | 3402 | 1351 | 1351 | 29.68% | 39.71% | 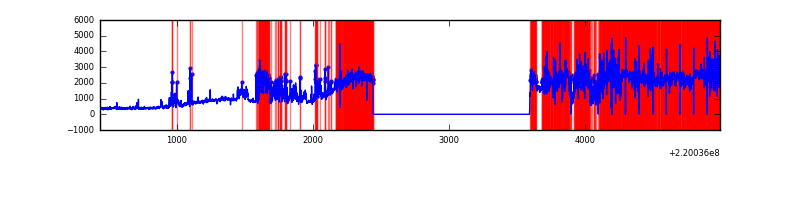 |
Top three noisy pixels from each quadrant. If the there are fewer than three noisy pixels in the level2.evt file, extra rows are filled as -1
| Pixel properties | Quadrant properties | ||||||
|---|---|---|---|---|---|---|---|
| Quadrant | DetID | PixID | Counts | Sigma | Mean | Median | Sigma |
| A | 3 | 1 | 9483 | 53.33 | 667 | 655 | 165.5 |
| A | 4 | 2 | 7199 | 39.54 | 667 | 655 | 165.5 |
| A | 8 | 15 | 6924 | 37.87 | 667 | 655 | 165.5 |
| B | 4 | 81 | 21755 | 163.09 | 572 | 563 | 129.9 |
| B | 0 | 214 | 19149 | 143.03 | 572 | 563 | 129.9 |
| B | 4 | 48 | 12353 | 90.73 | 572 | 563 | 129.9 |
| C | 1 | 16 | 5738 | 31.55 | 575 | 575 | 163.6 |
| C | 13 | 61 | 4024 | 21.08 | 575 | 575 | 163.6 |
| C | 9 | 16 | 2052 | 9.03 | 575 | 575 | 163.6 |
| D | 2 | 33 | 2846825 | 17432.33 | 504 | 488 | 163.3 |
| D | 2 | 63 | 391531 | 2394.93 | 504 | 488 | 163.3 |
| D | 14 | 34 | 85046 | 517.87 | 504 | 488 | 163.3 |
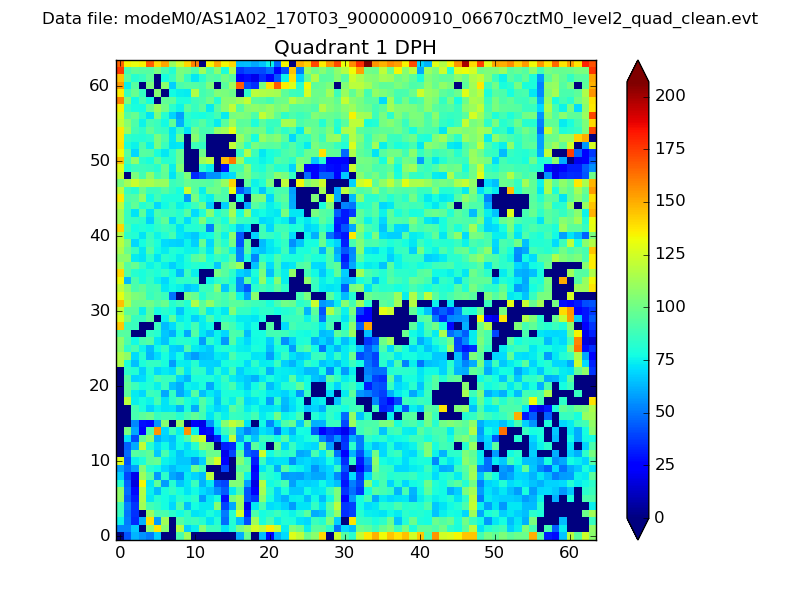
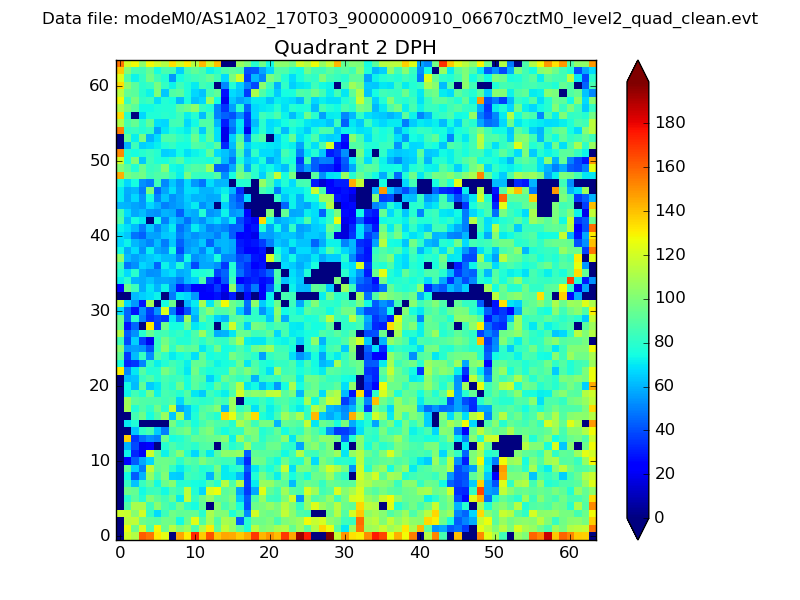
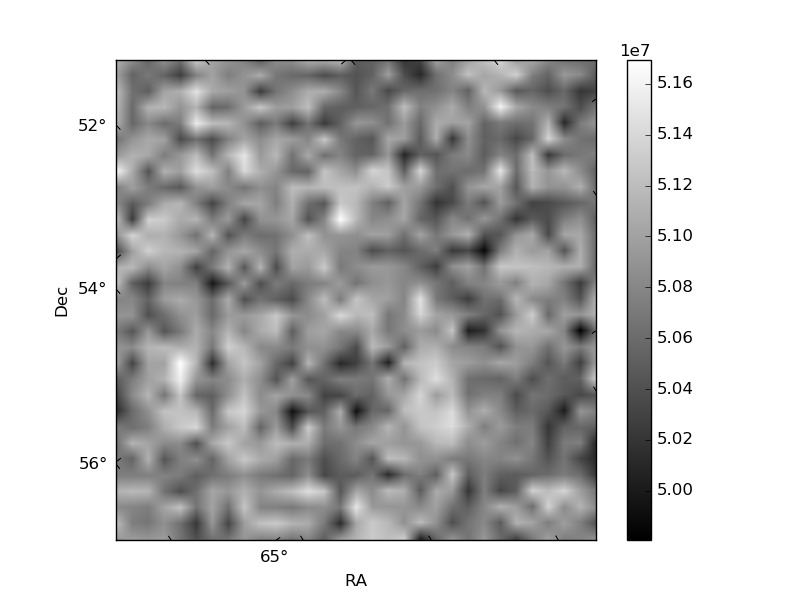
Histogram calculated using DETX and DETY for each event in the final _common_clean file
| Quadrant A |  |
 |
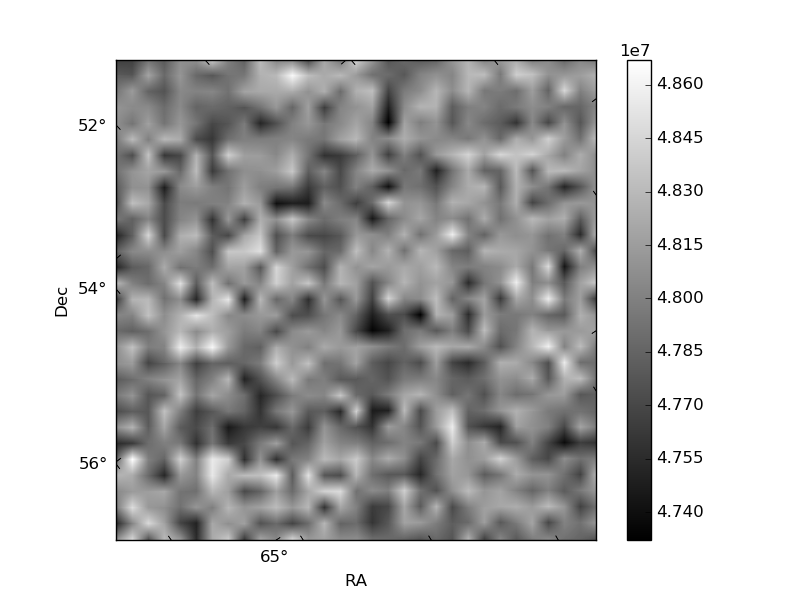
Quadrant B |
|---|---|---|---|
| Quadrant D | 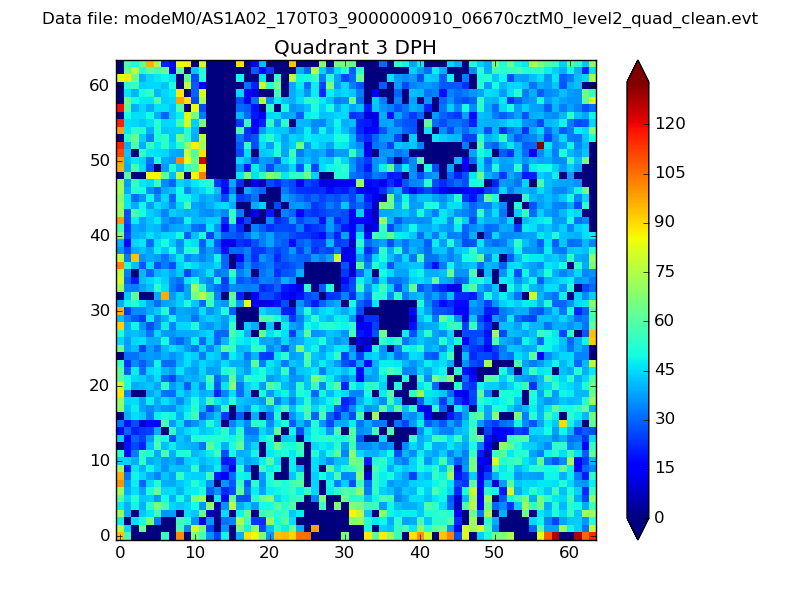 |
 |
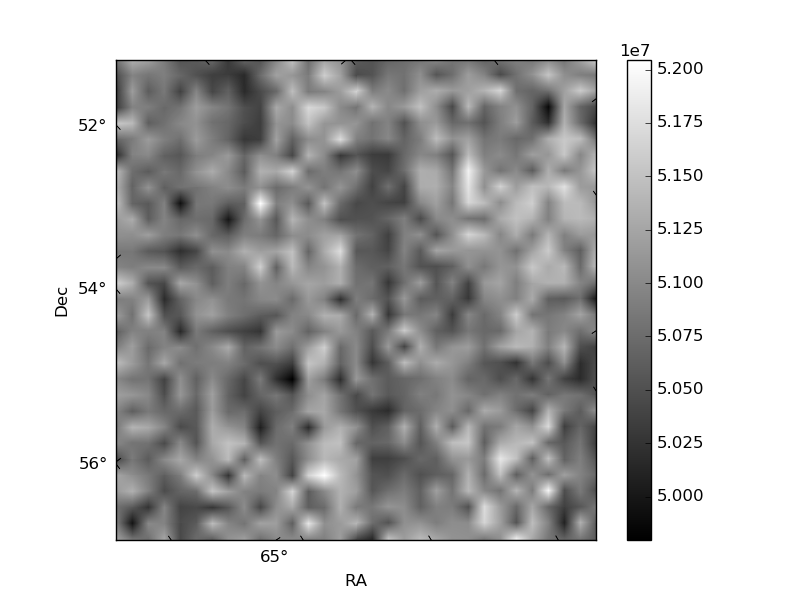
Quadrant C |
| Plot type | Count rate plots | Images |
|---|---|---|
| Comparison with Poisson distribution Blue bars denote a histogram of data divided into 1 sec bins. Red curve is a Poisson curve with rate = median count rate of data. |
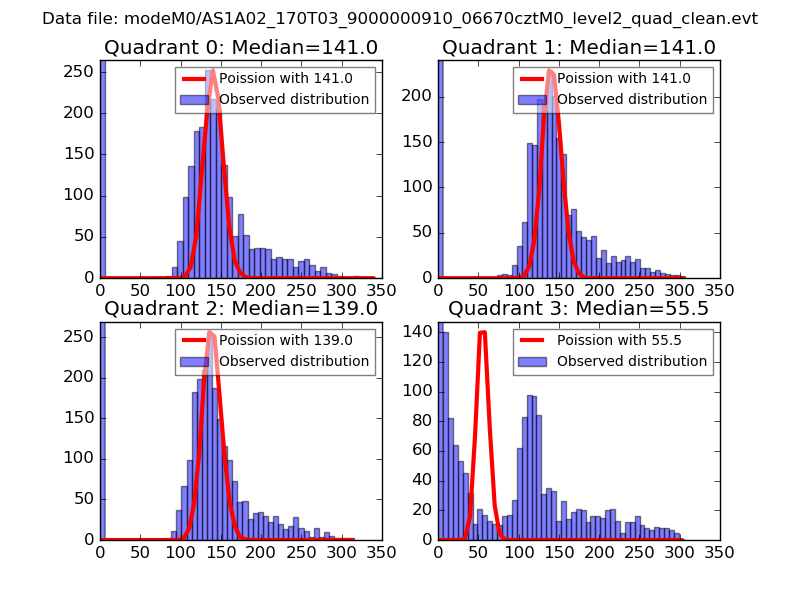 |
 |
| Quadrant-wise count rates Data is divided into 100 sec bins |
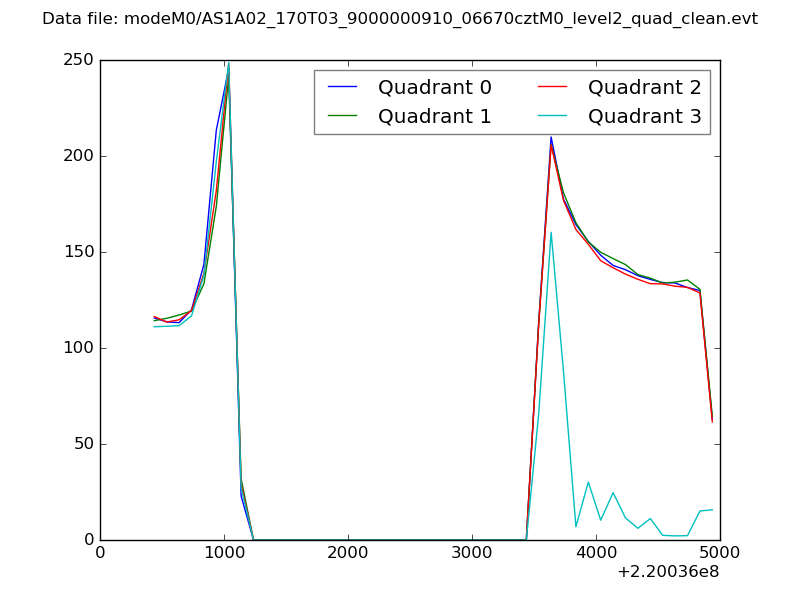 |
|
| Module-wise count rates for Quadrant A Data is divided into 100 sec bins |
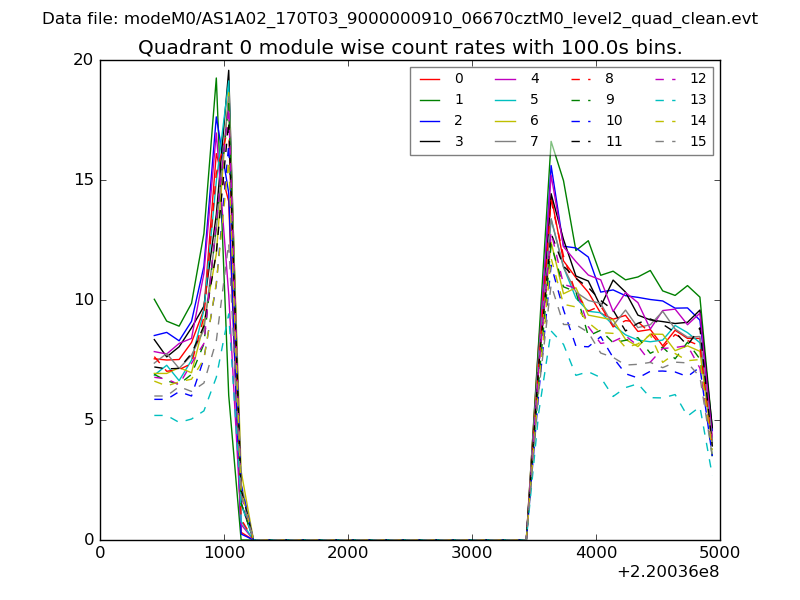 |
 |
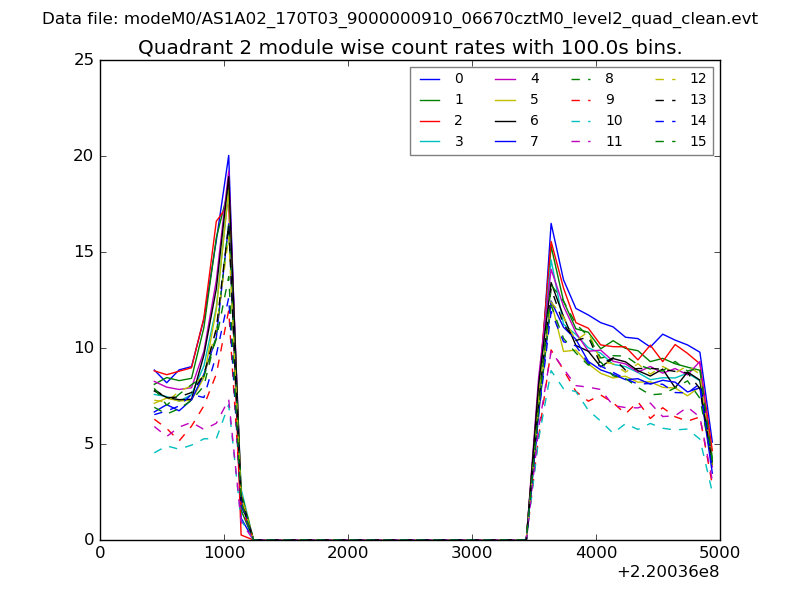
| Module-wise count rates for Quadrant B Data is divided into 100 sec bins |
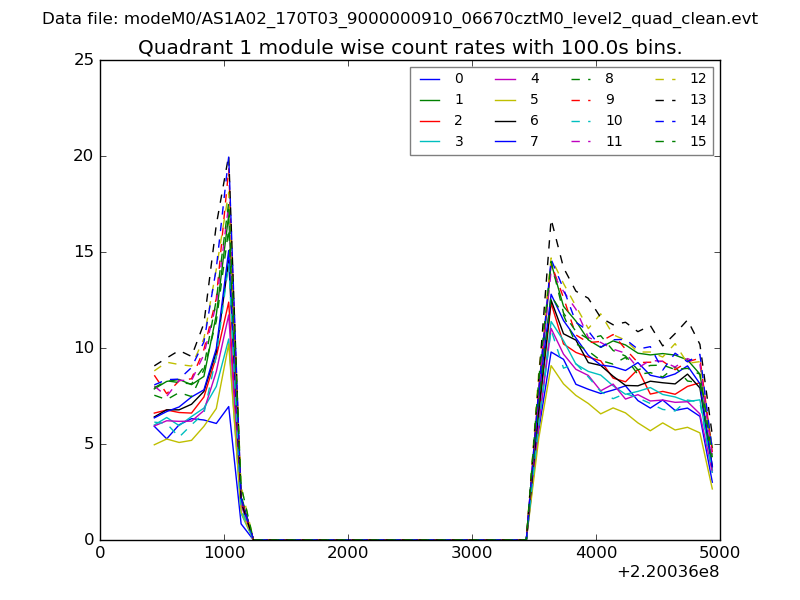 |
 |
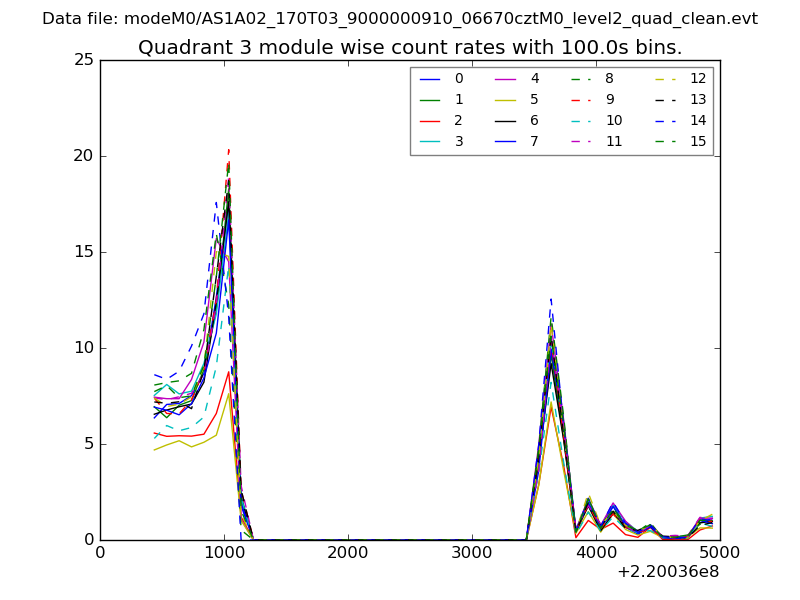
| Module-wise count rates for Quadrant C Data is divided into 100 sec bins |
 |
 |
| Module-wise count rates for Quadrant D Data is divided into 100 sec bins |
 |
 |
| Parameter | Plot |
|---|---|
| CZT HV Monitor | 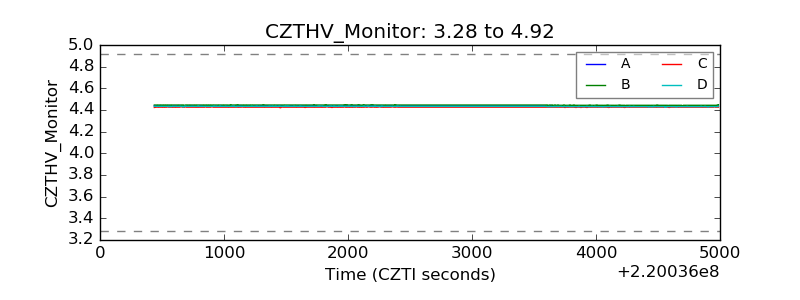 |
| D_VDD | 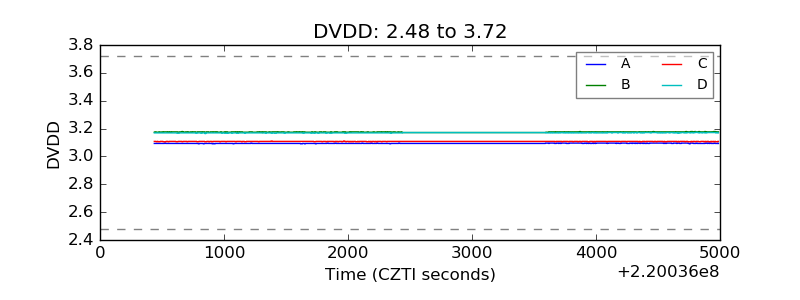 |
| Temperature 1 | 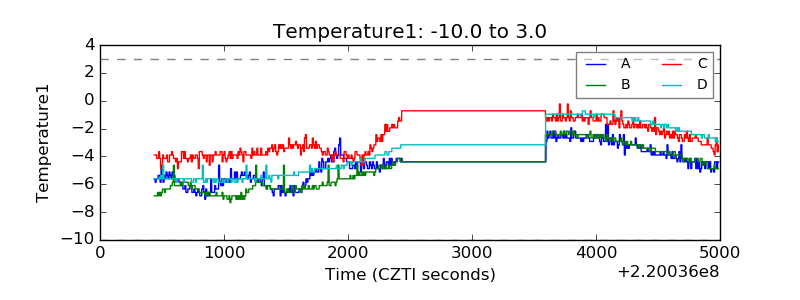 |
| Veto HV Monitor | 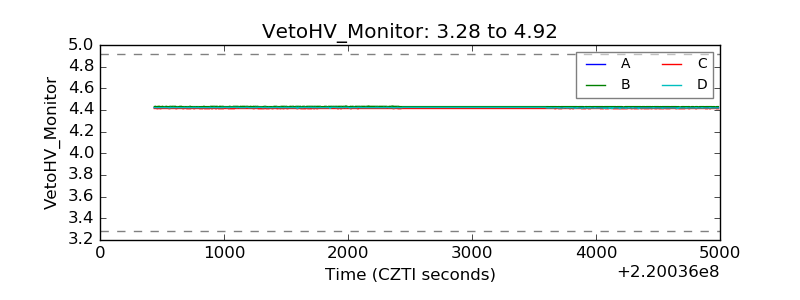 |
| Veto LLD | 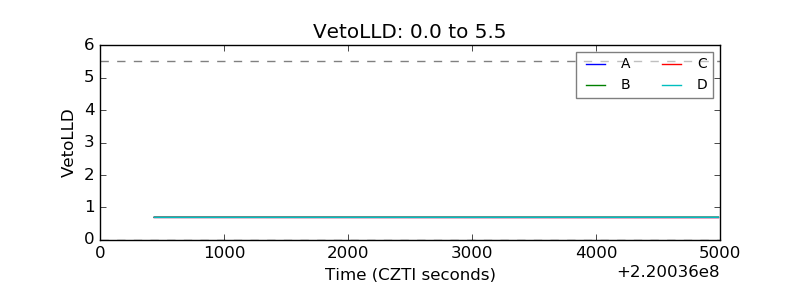 |
| Alpha Counter | 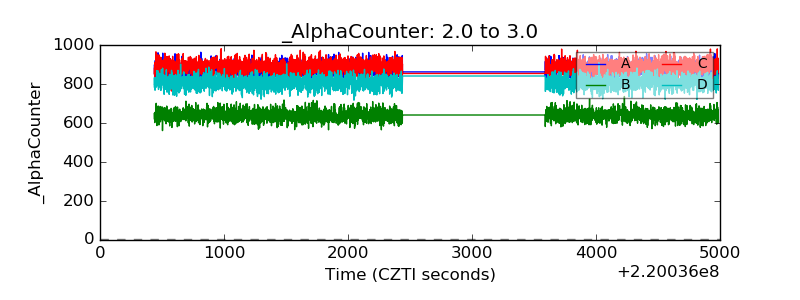 |
| _CPM_Rate | 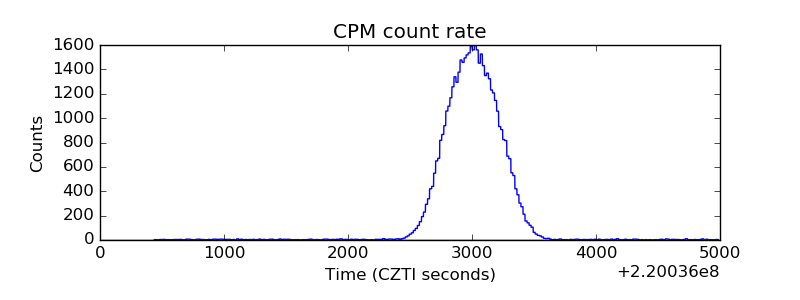 |
| CZT Counter | 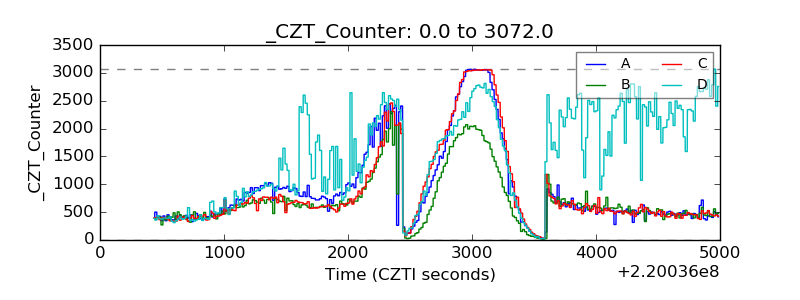 |
| +2.5 Volts monitor |  |
| +5 Volts monitor |  |
| _ROLL_ROT | 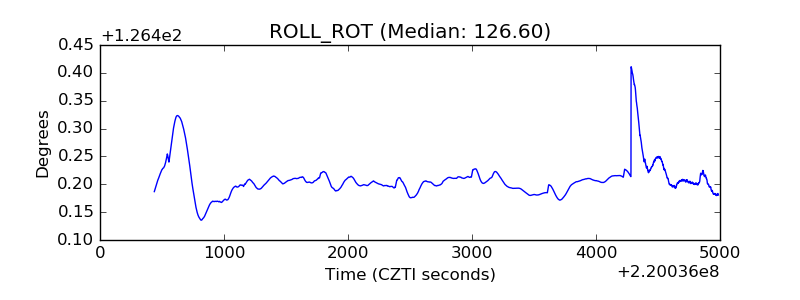 |
| _Roll_DEC | 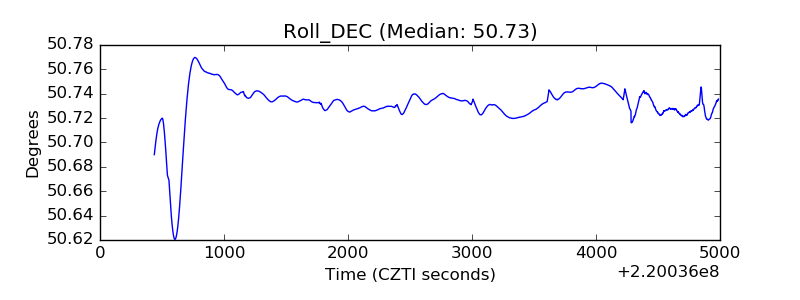 |
| _Roll_RA | 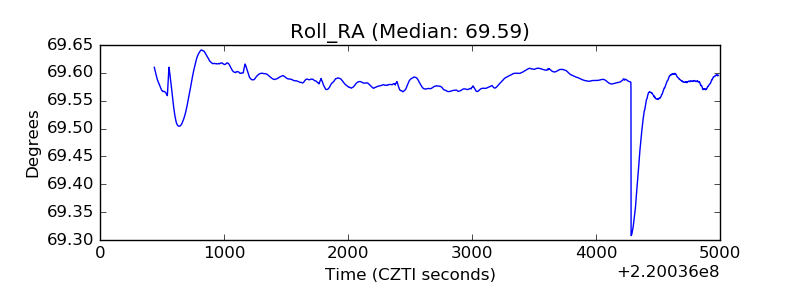 |
| Veto Counter | 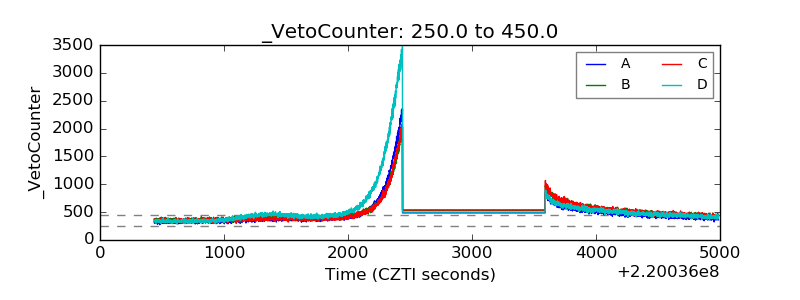 |