| Param | Original file | Final file |
|---|---|---|
| Filename | modeM0/AS1A02_170T03_9000000910_06671cztM0_level2.evt | modeM0/AS1A02_170T03_9000000910_06671cztM0_level2_quad_clean.evt |
| Size (bytes) | 642,522,240 | 86,307,840 |
| Size | 612.8 MB | 82.3 MB |
| Events in quadrant A | 3,463,186 | 626,750 |
| Events in quadrant B | 3,178,141 | 633,986 |
| Events in quadrant C | 3,002,346 | 628,264 |
| Events in quadrant D | 9,388,499 | 284,479 |
| Mode M0 | |||
|---|---|---|---|
| Quadrant | BADHDUFLAG | Total packets | Discarded packets |
| A | 0 | 14656 | 2 |
| B | 0 | 13765 | 1 |
| C | 0 | 13356 | 1 |
| D | 0 | 32322 | 1 |
| Mode M9 | |||
|---|---|---|---|
| Quadrant | BADHDUFLAG | Total packets | Discarded packets |
| A | 0 | 12 | 0 |
| B | 0 | 12 | 0 |
| C | 0 | 12 | 0 |
| D | 0 | 12 | 0 |
| Mode SS | |||
|---|---|---|---|
| Quadrant | BADHDUFLAG | Total packets | Discarded packets |
| A | 0 | 128 | 0 |
| B | 0 | 128 | 0 |
| C | 0 | 128 | 0 |
| D | 0 | 128 | 0 |
| Quadrant | Total seconds | Saturated seconds | Saturation percentage |
|---|---|---|---|
| A | 6285 | 88 | 1.400159% |
| B | 6285 | 52 | 0.827367% |
| C | 6285 | 49 | 0.779634% |
| D | 6285 | 3271 | 52.044551% |
Noise dominated data is calculated using 1-second bins in cleaned event files. If a bin has >2000 counts, and if more than 50% of those come from <1% of pixels, then it is considered to be noise-dominated and hence unusable.
| Quadrant | # 1 sec bins | Bins with >0 counts | Bins with >2000 counts | High rate bins dominated by noise | Noise dominated (total time) | Noise dominated (detector-on time) | Marked lightcurve |
|---|---|---|---|---|---|---|---|
| A | 7520 | 6286 | 16 | 16 | 0.21% | 0.25% | 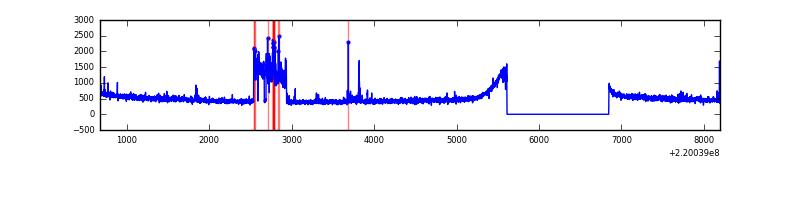 |
| B | 7520 | 6286 | 4 | 4 | 0.05% | 0.06% | 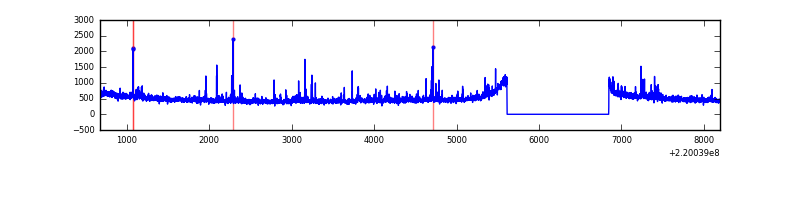 |
| C | 7520 | 6286 | 0 | 0 | 0.00% | 0.00% | 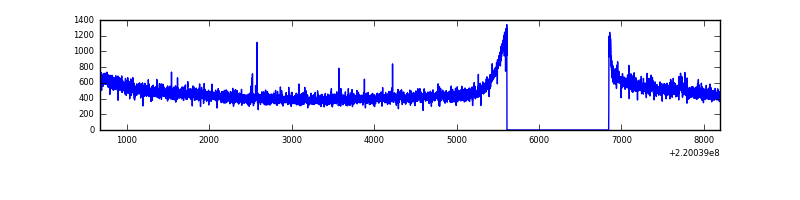 |
| D | 7520 | 6286 | 2421 | 2421 | 32.19% | 38.51% | 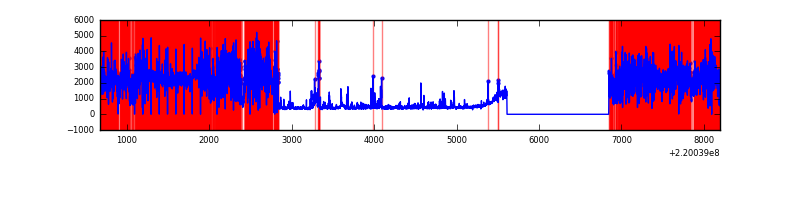 |
Top three noisy pixels from each quadrant. If the there are fewer than three noisy pixels in the level2.evt file, extra rows are filled as -1
| Pixel properties | Quadrant properties | ||||||
|---|---|---|---|---|---|---|---|
| Quadrant | DetID | PixID | Counts | Sigma | Mean | Median | Sigma |
| A | 14 | 111 | 408245 | 2588.22 | 782 | 769 | 157.4 |
| A | 8 | 15 | 23413 | 143.83 | 782 | 769 | 157.4 |
| A | 3 | 1 | 12769 | 76.22 | 782 | 769 | 157.4 |
| B | 4 | 81 | 61496 | 414.23 | 773 | 756 | 146.6 |
| B | 4 | 80 | 47638 | 319.72 | 773 | 756 | 146.6 |
| B | 0 | 214 | 21106 | 138.78 | 773 | 756 | 146.6 |
| C | 9 | 247 | 26371 | 146.58 | 755 | 760 | 174.7 |
| C | 1 | 16 | 24333 | 134.91 | 755 | 760 | 174.7 |
| C | 12 | 4 | 7690 | 39.66 | 755 | 760 | 174.7 |
| D | 2 | 33 | 6849847 | 55799.58 | 492 | 479 | 122.7 |
| D | 2 | 63 | 283502 | 2305.7 | 492 | 479 | 122.7 |
| D | 14 | 34 | 108489 | 879.92 | 492 | 479 | 122.7 |
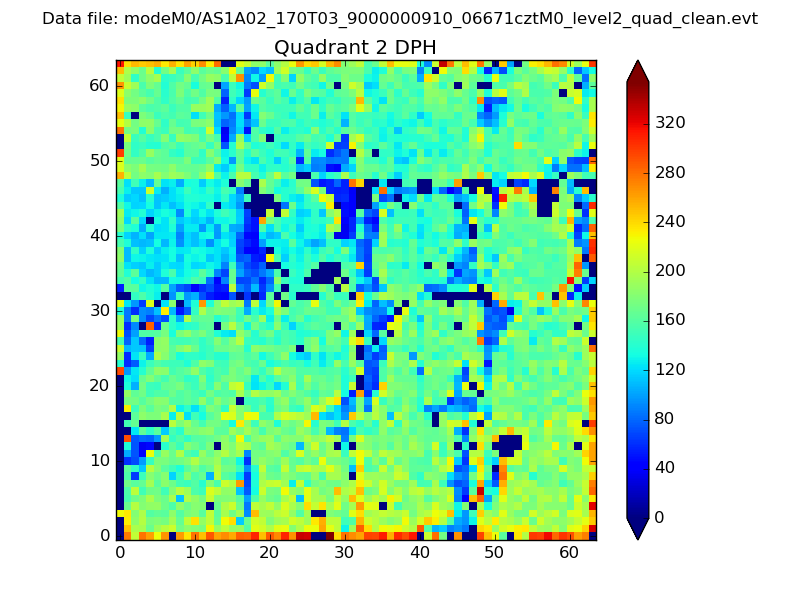
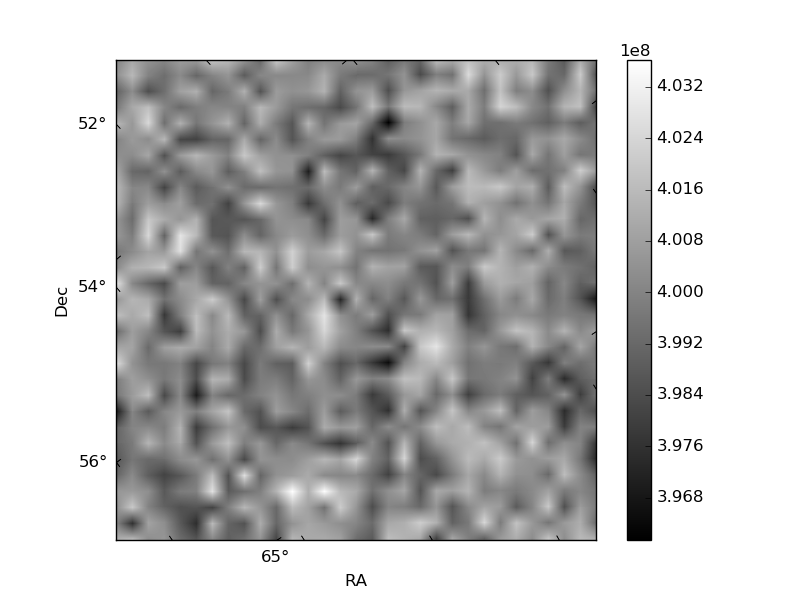
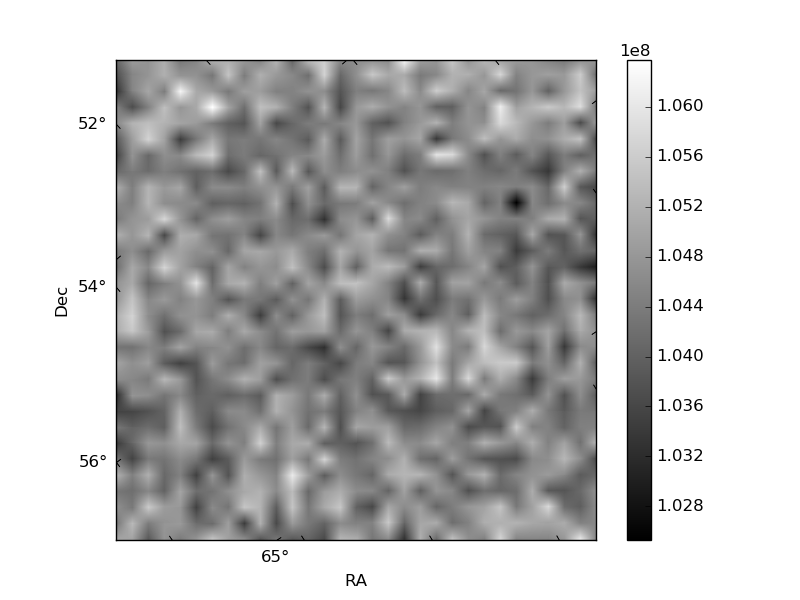
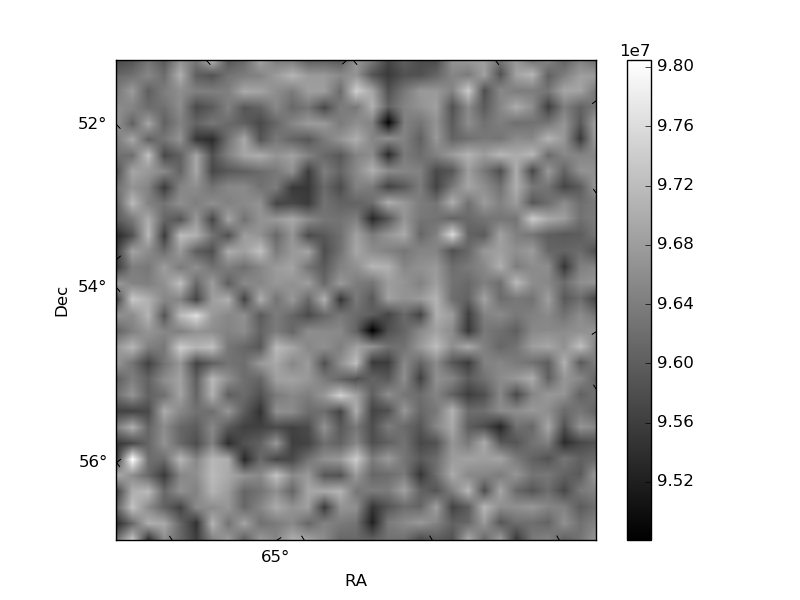
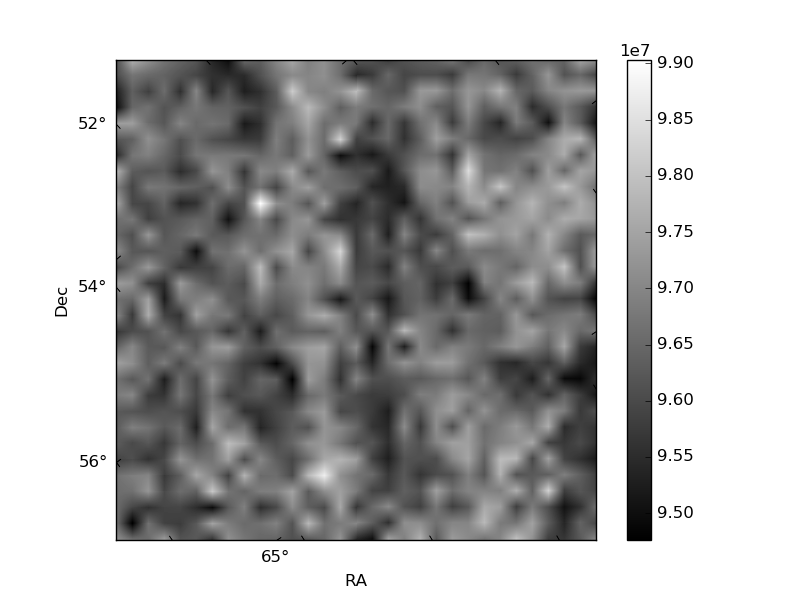
Histogram calculated using DETX and DETY for each event in the final _common_clean file
| Quadrant A | 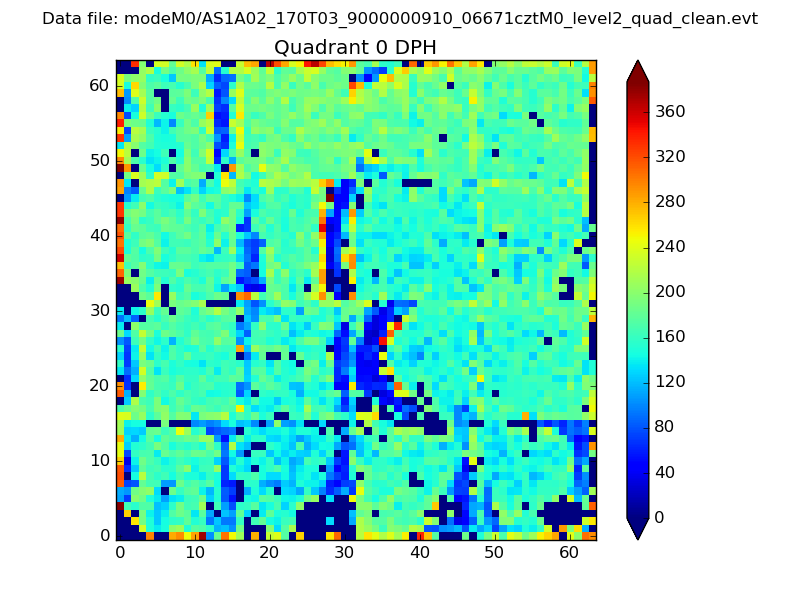 |
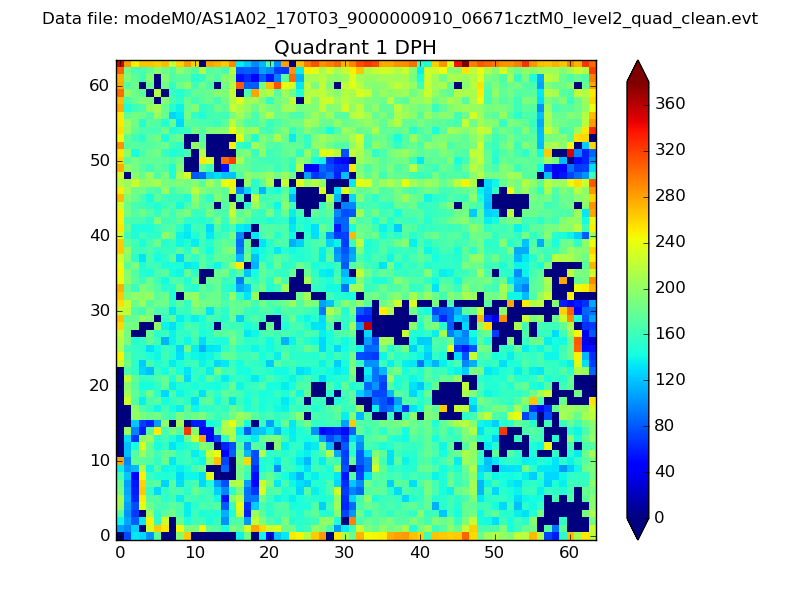 |
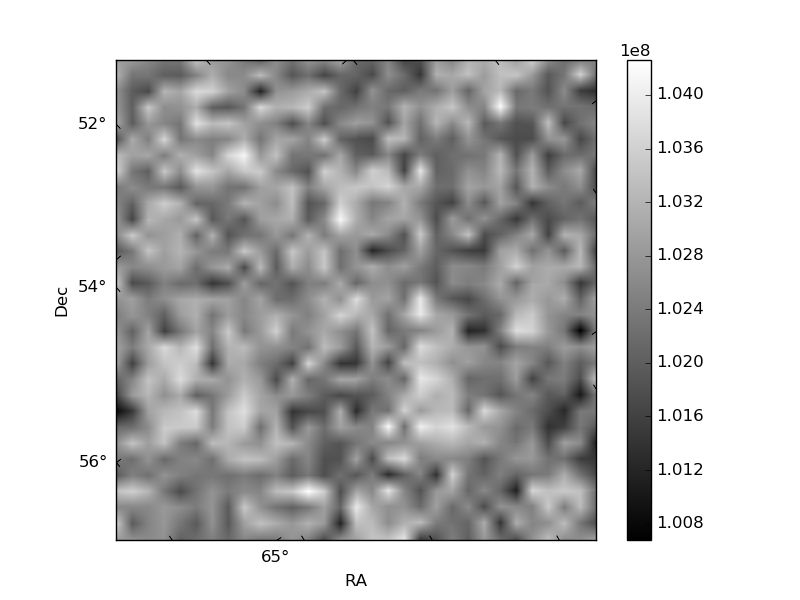
Quadrant B |
|---|---|---|---|
| Quadrant D | 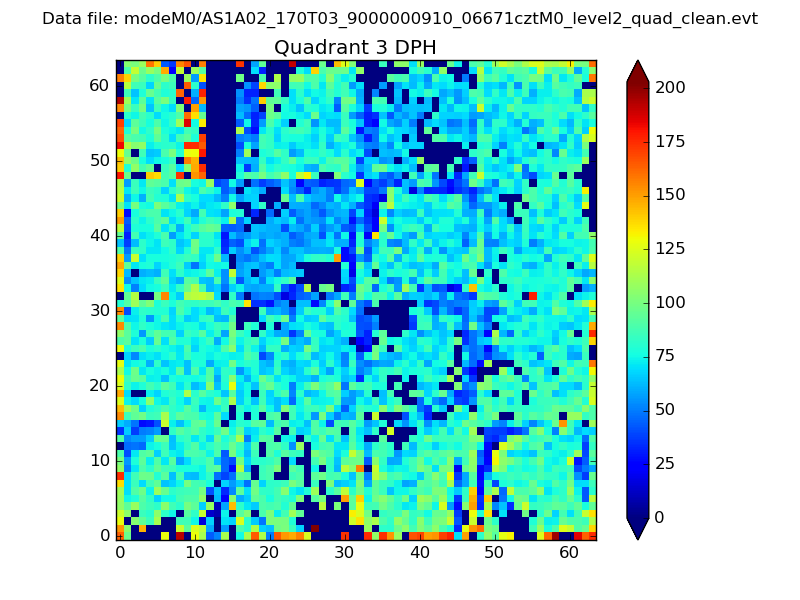 |
 |
Quadrant C |
| Plot type | Count rate plots | Images |
|---|---|---|
| Comparison with Poisson distribution Blue bars denote a histogram of data divided into 1 sec bins. Red curve is a Poisson curve with rate = median count rate of data. |
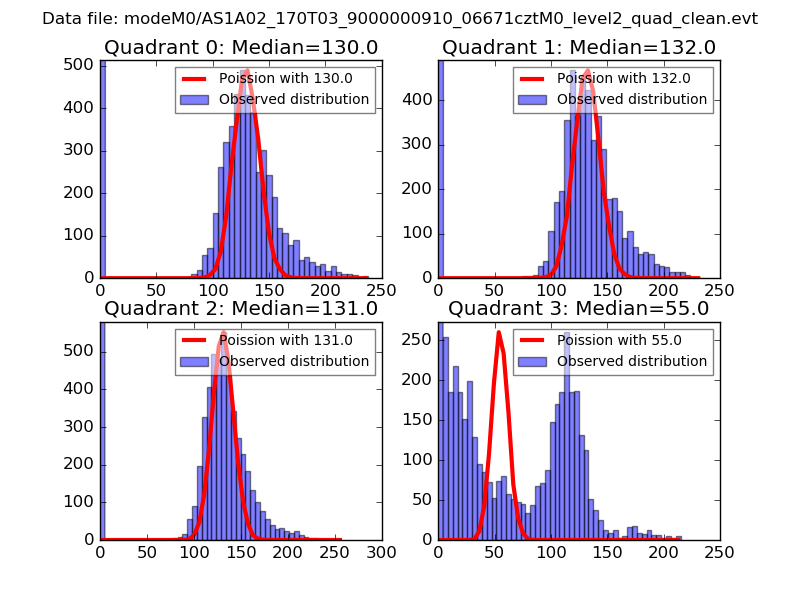 |
 |
| Quadrant-wise count rates Data is divided into 100 sec bins |
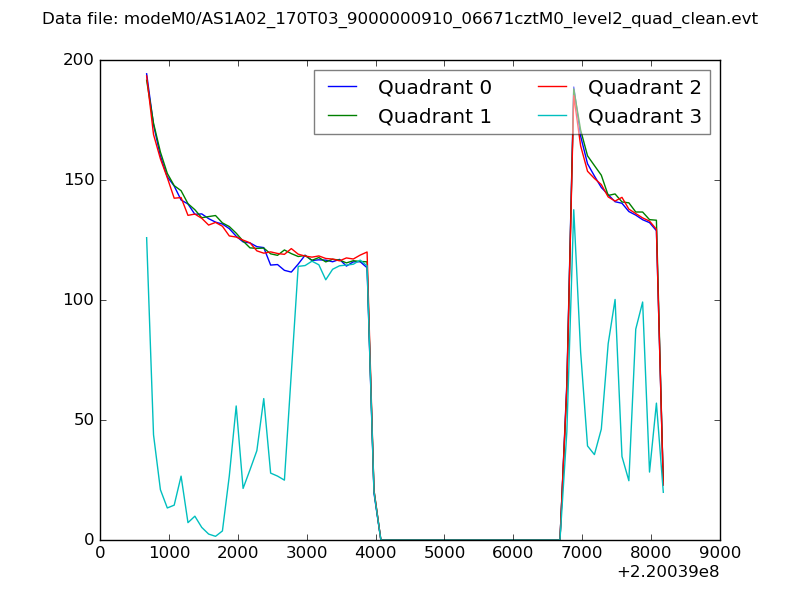 |
|
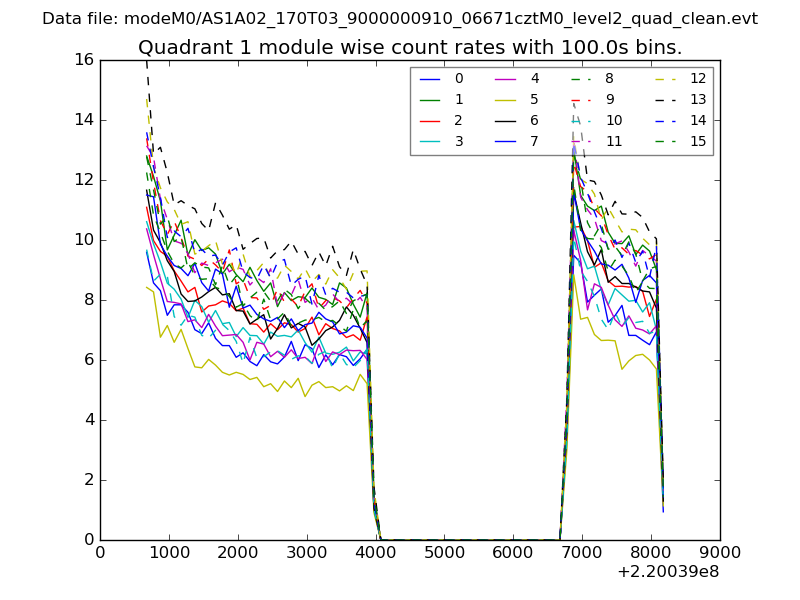
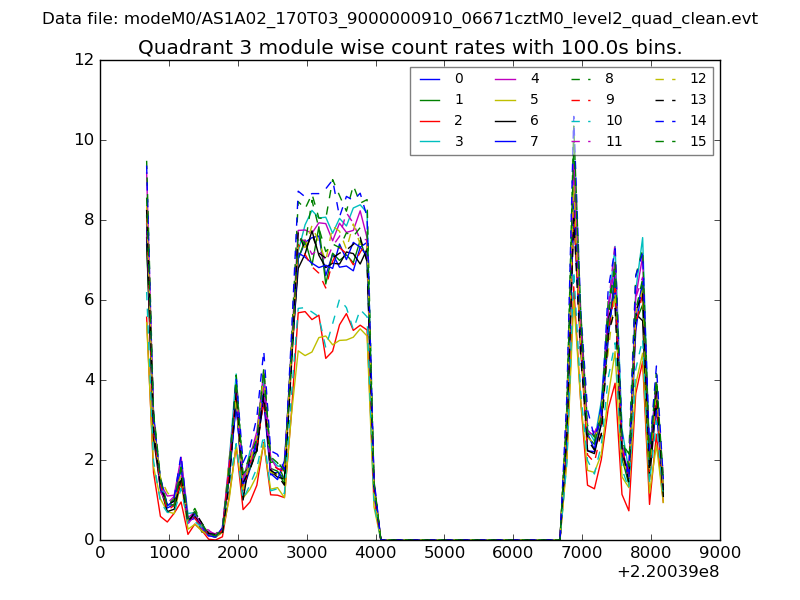
| Module-wise count rates for Quadrant A Data is divided into 100 sec bins |
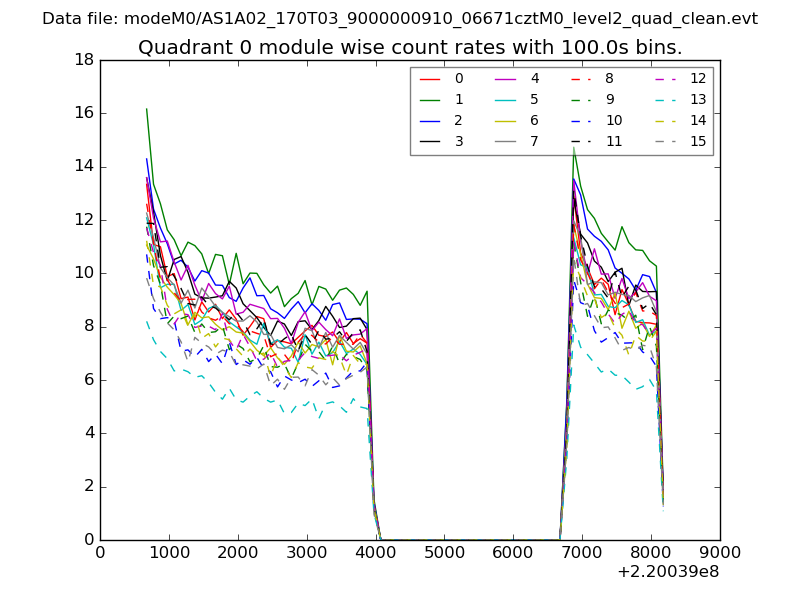 |
 |
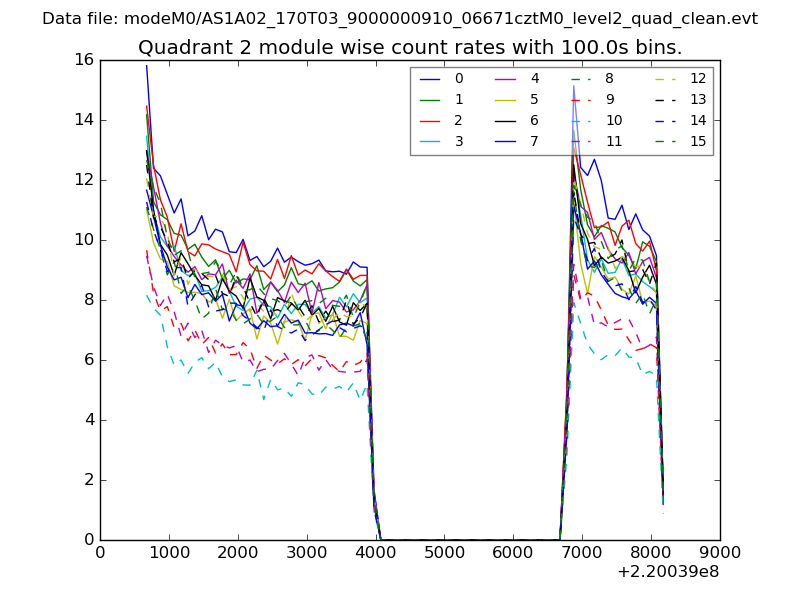
| Module-wise count rates for Quadrant B Data is divided into 100 sec bins |
 |
 |
| Module-wise count rates for Quadrant C Data is divided into 100 sec bins |
 |
 |
| Module-wise count rates for Quadrant D Data is divided into 100 sec bins |
 |
 |
| Parameter | Plot |
|---|---|
| CZT HV Monitor | 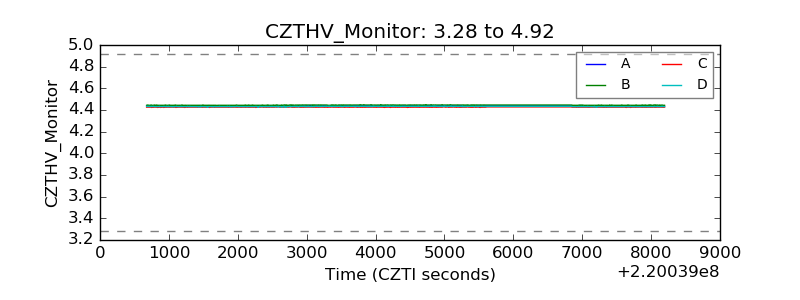 |
| D_VDD | 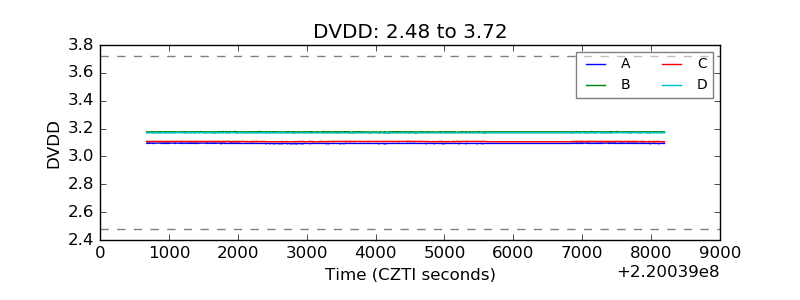 |
| Temperature 1 | 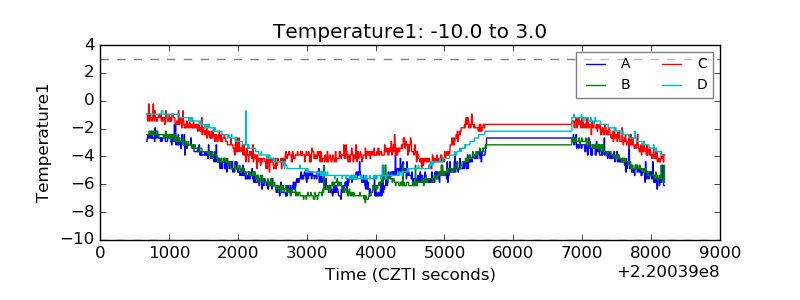 |
| Veto HV Monitor | 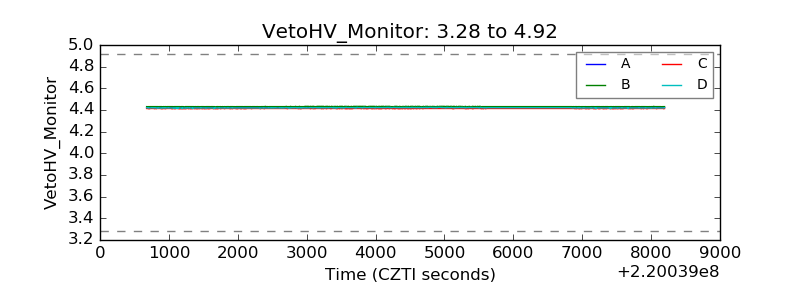 |
| Veto LLD | 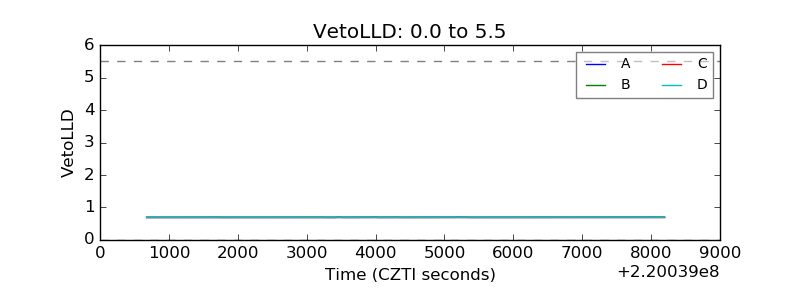 |
| Alpha Counter | 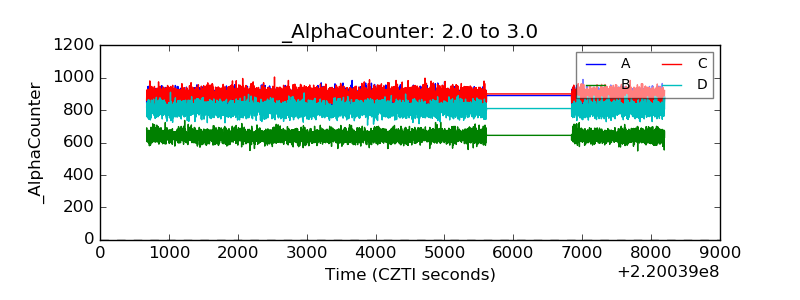 |
| _CPM_Rate | 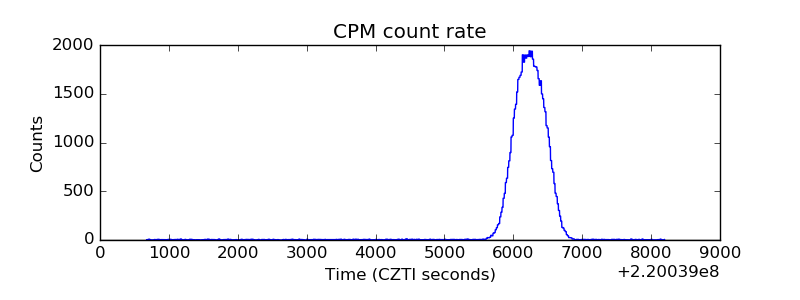 |
| CZT Counter | 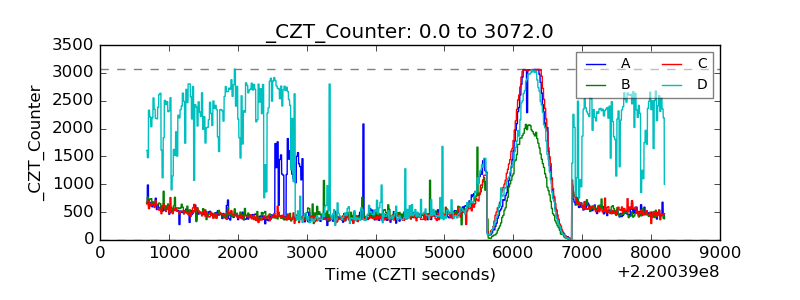 |
| +2.5 Volts monitor |  |
| +5 Volts monitor | 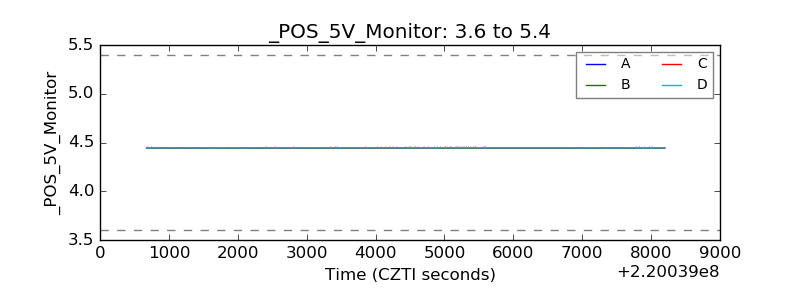 |
| _ROLL_ROT | 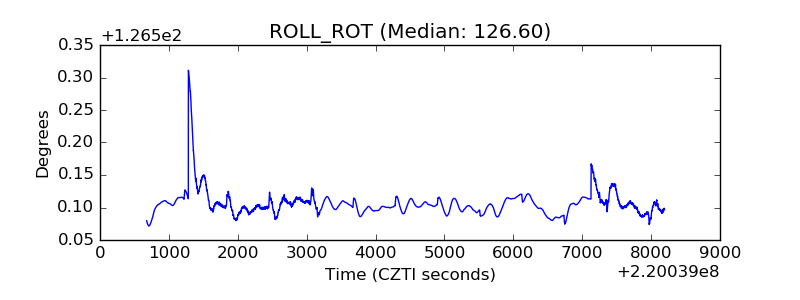 |
| _Roll_DEC | 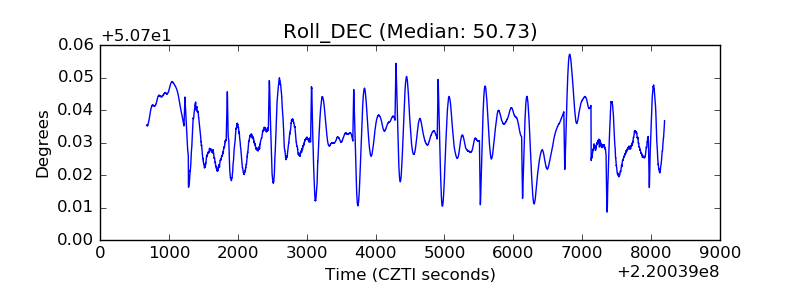 |
| _Roll_RA | 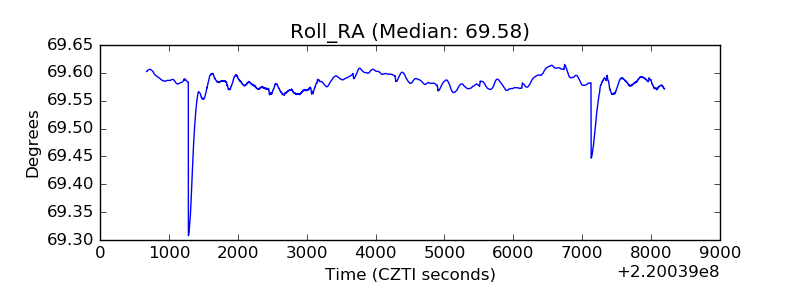 |
| Veto Counter | 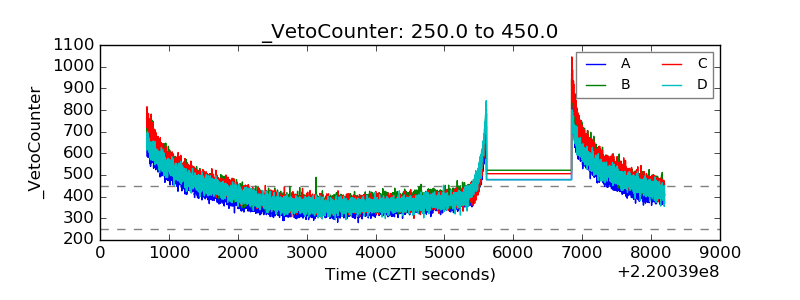 |