| Param | Original file | Final file |
|---|---|---|
| Filename | modeM0/AS1A02_170T03_9000000910_06674cztM0_level2.evt | modeM0/AS1A02_170T03_9000000910_06674cztM0_level2_quad_clean.evt |
| Size (bytes) | 490,792,320 | 82,673,280 |
| Size | 468.1 MB | 78.8 MB |
| Events in quadrant A | 2,766,309 | 540,760 |
| Events in quadrant B | 2,971,159 | 550,070 |
| Events in quadrant C | 2,899,950 | 541,202 |
| Events in quadrant D | 5,814,190 | 447,476 |
| Mode M0 | |||
|---|---|---|---|
| Quadrant | BADHDUFLAG | Total packets | Discarded packets |
| A | 0 | 12498 | 2 |
| B | 0 | 12984 | 2 |
| C | 0 | 12859 | 2 |
| D | 0 | 21515 | 2 |
| Mode M9 | |||
|---|---|---|---|
| Quadrant | BADHDUFLAG | Total packets | Discarded packets |
| A | 0 | 17 | 0 |
| B | 0 | 17 | 0 |
| C | 0 | 17 | 0 |
| D | 0 | 18 | 0 |
| Mode SS | |||
|---|---|---|---|
| Quadrant | BADHDUFLAG | Total packets | Discarded packets |
| A | 0 | 122 | 0 |
| B | 0 | 122 | 0 |
| C | 0 | 122 | 0 |
| D | 0 | 122 | 0 |
| Quadrant | Total seconds | Saturated seconds | Saturation percentage |
|---|---|---|---|
| A | 6069 | 17 | 0.280112% |
| B | 6069 | 31 | 0.510793% |
| C | 6069 | 36 | 0.593178% |
| D | 6069 | 1036 | 17.070358% |
Noise dominated data is calculated using 1-second bins in cleaned event files. If a bin has >2000 counts, and if more than 50% of those come from <1% of pixels, then it is considered to be noise-dominated and hence unusable.
| Quadrant | # 1 sec bins | Bins with >0 counts | Bins with >2000 counts | High rate bins dominated by noise | Noise dominated (total time) | Noise dominated (detector-on time) | Marked lightcurve |
|---|---|---|---|---|---|---|---|
| A | 7359 | 6070 | 0 | 0 | 0.00% | 0.00% | 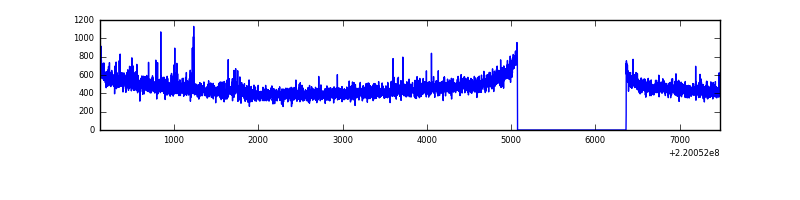 |
| B | 7359 | 6070 | 0 | 0 | 0.00% | 0.00% | 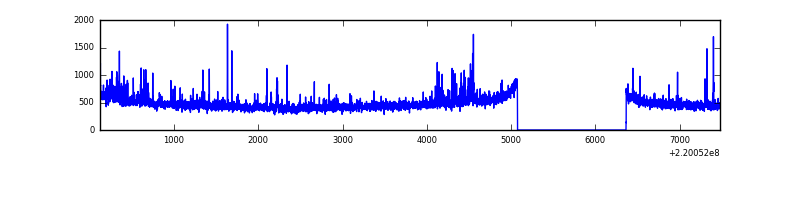 |
| C | 7359 | 6070 | 9 | 9 | 0.12% | 0.15% | 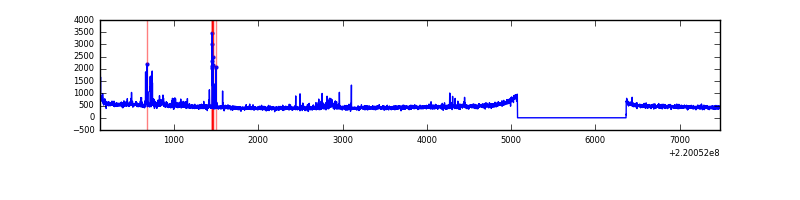 |
| D | 7359 | 6070 | 845 | 845 | 11.48% | 13.92% | 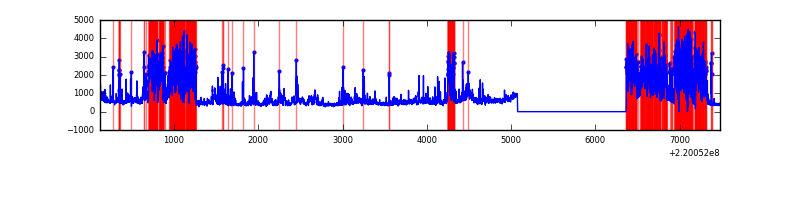 |
Top three noisy pixels from each quadrant. If the there are fewer than three noisy pixels in the level2.evt file, extra rows are filled as -1
| Pixel properties | Quadrant properties | ||||||
|---|---|---|---|---|---|---|---|
| Quadrant | DetID | PixID | Counts | Sigma | Mean | Median | Sigma |
| A | 8 | 15 | 41759 | 286.73 | 702 | 686 | 143.2 |
| A | 3 | 1 | 10972 | 71.81 | 702 | 686 | 143.2 |
| A | 0 | 226 | 6749 | 42.33 | 702 | 686 | 143.2 |
| B | 4 | 81 | 87305 | 651.46 | 714 | 698 | 132.9 |
| B | 0 | 219 | 62695 | 466.34 | 714 | 698 | 132.9 |
| B | 4 | 80 | 21109 | 153.53 | 714 | 698 | 132.9 |
| C | 9 | 247 | 182451 | 1124.65 | 695 | 697 | 161.6 |
| C | 13 | 61 | 5535 | 29.94 | 695 | 697 | 161.6 |
| C | 1 | 16 | 5240 | 28.11 | 695 | 697 | 161.6 |
| D | 2 | 33 | 2736989 | 17943.51 | 629 | 610 | 152.5 |
| D | 8 | 195 | 319984 | 2094.26 | 629 | 610 | 152.5 |
| D | 2 | 152 | 136814 | 893.14 | 629 | 610 | 152.5 |
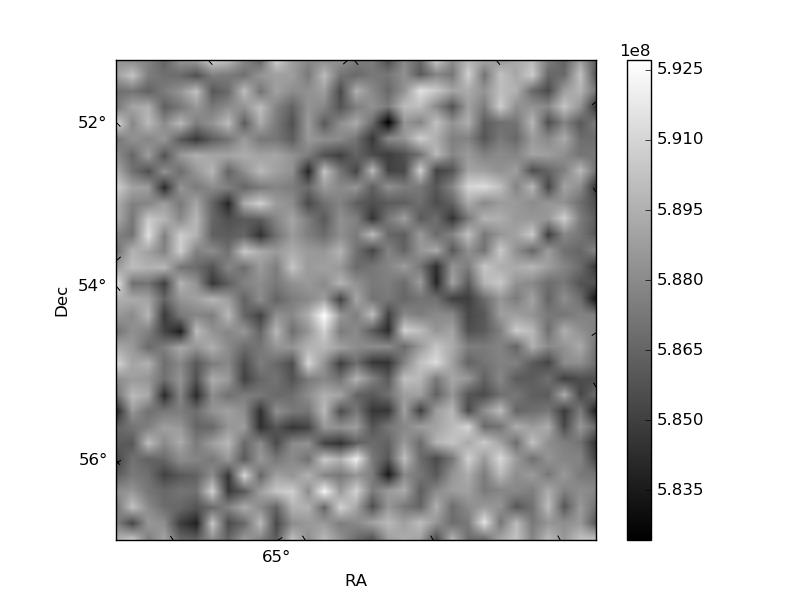
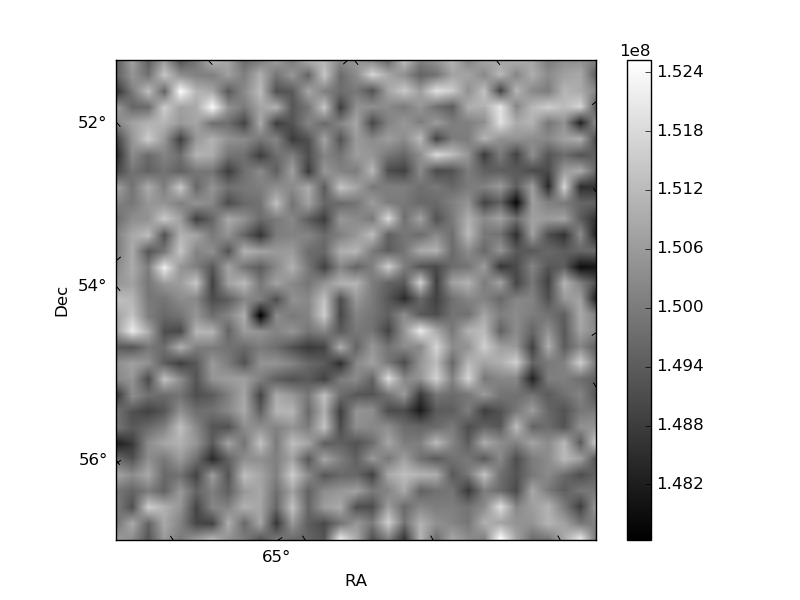
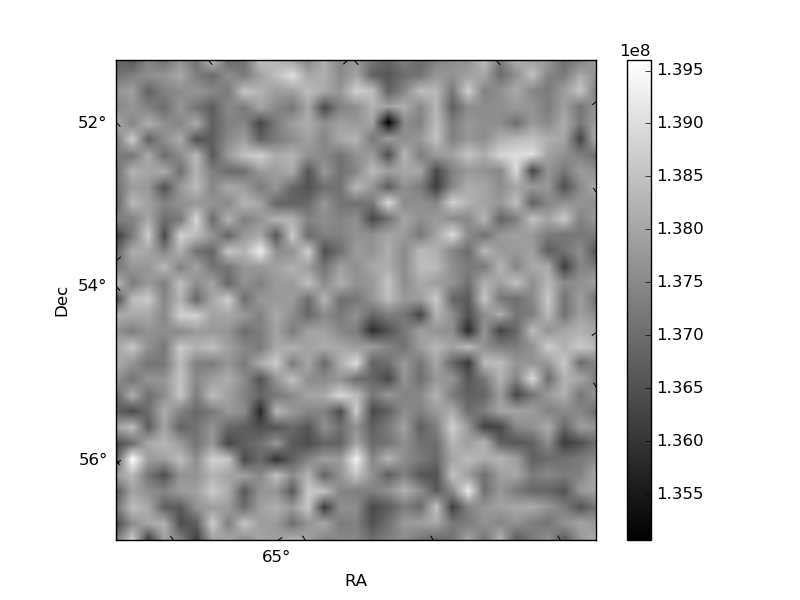
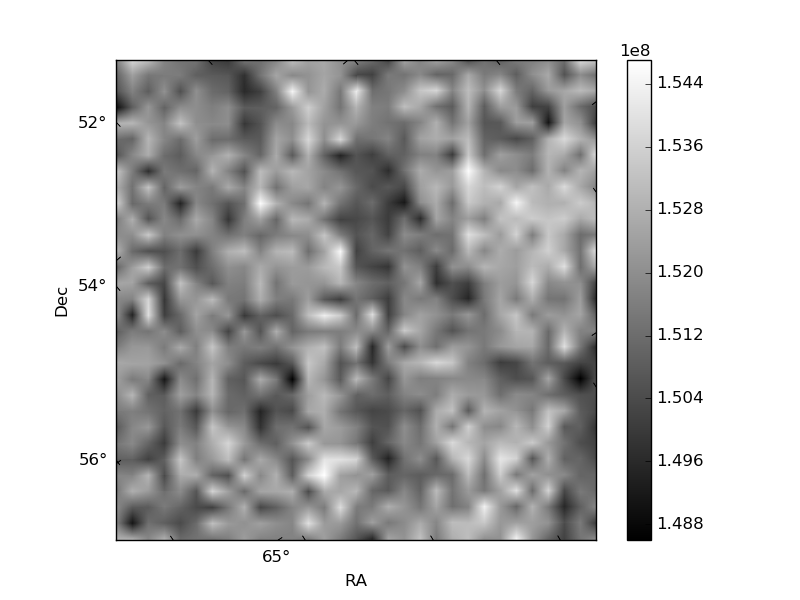
Histogram calculated using DETX and DETY for each event in the final _common_clean file
| Quadrant A | 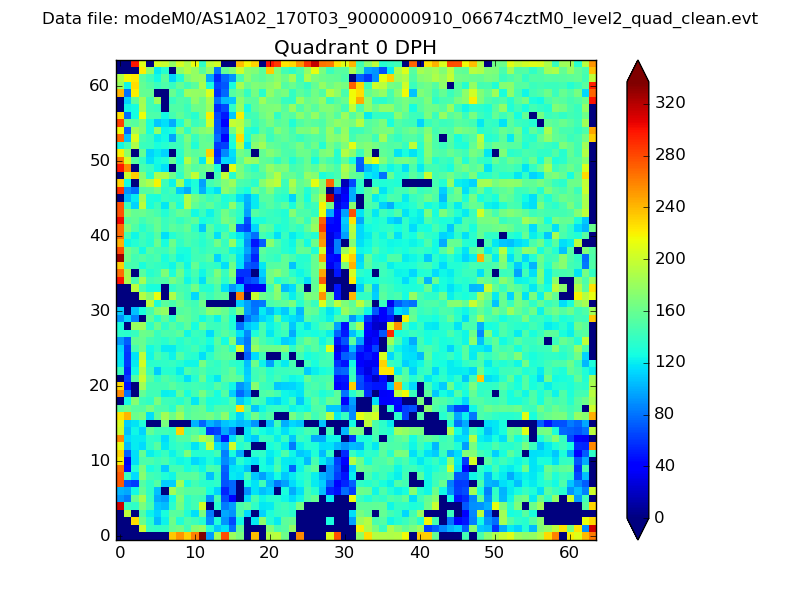 |
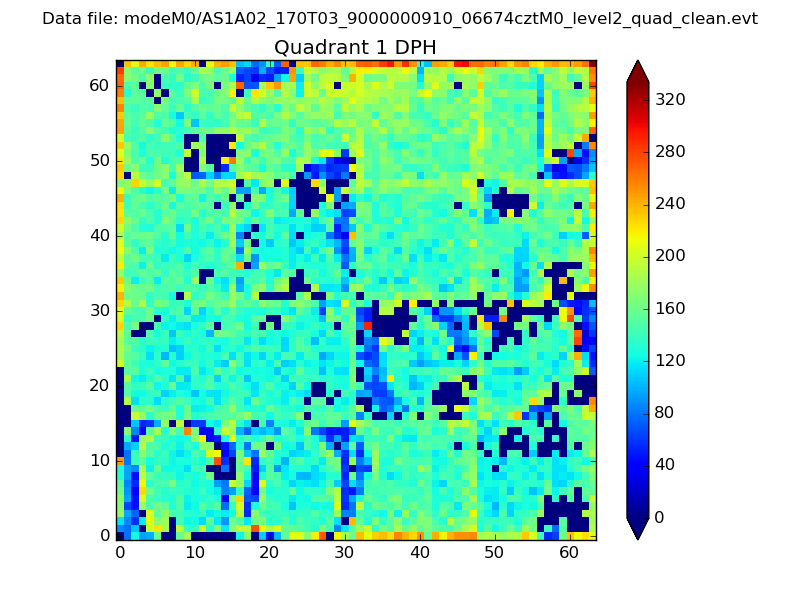 |
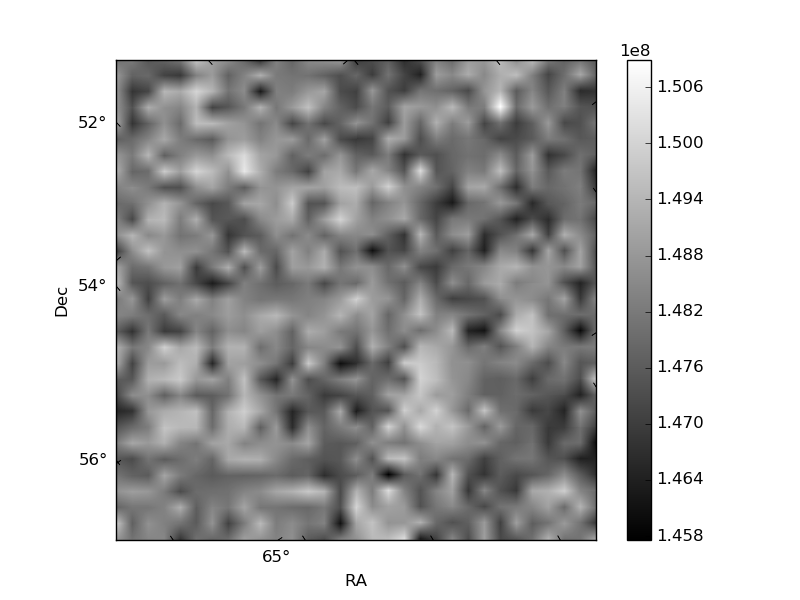
Quadrant B |
|---|---|---|---|
| Quadrant D | 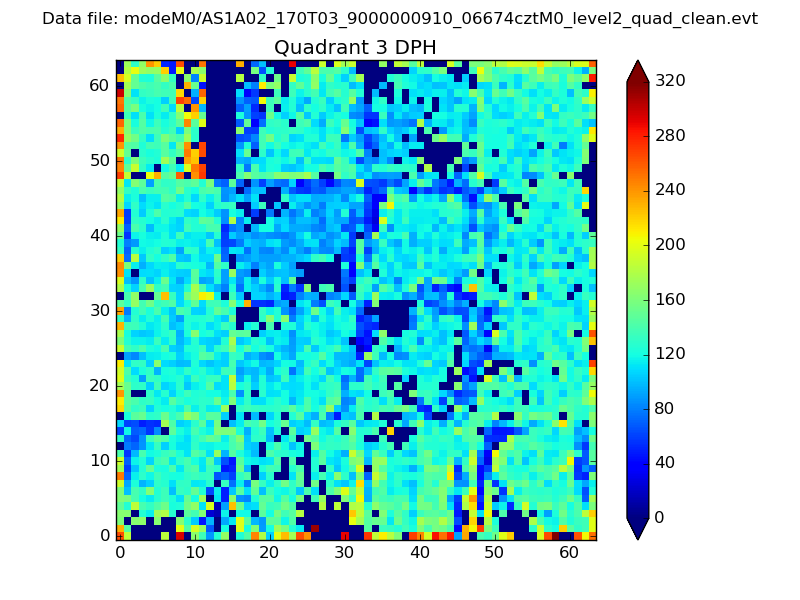 |
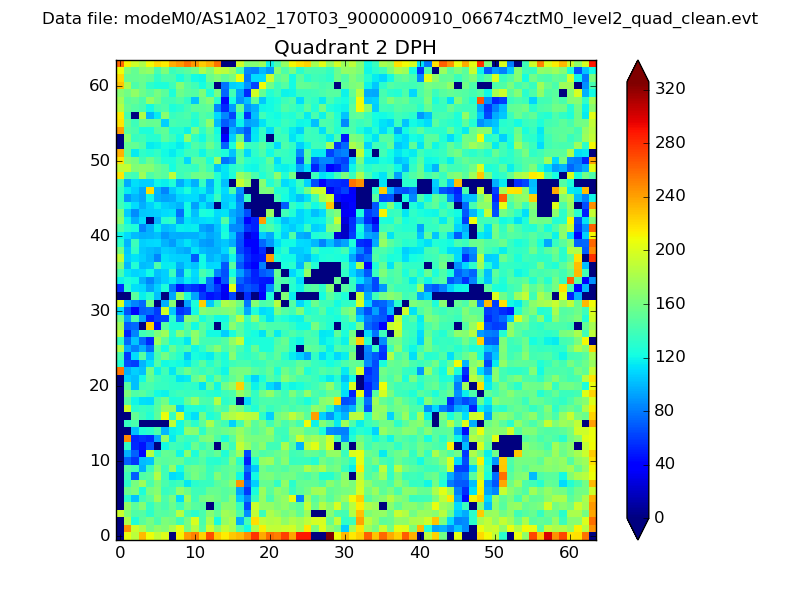 |
Quadrant C |
| Plot type | Count rate plots | Images |
|---|---|---|
| Comparison with Poisson distribution Blue bars denote a histogram of data divided into 1 sec bins. Red curve is a Poisson curve with rate = median count rate of data. |
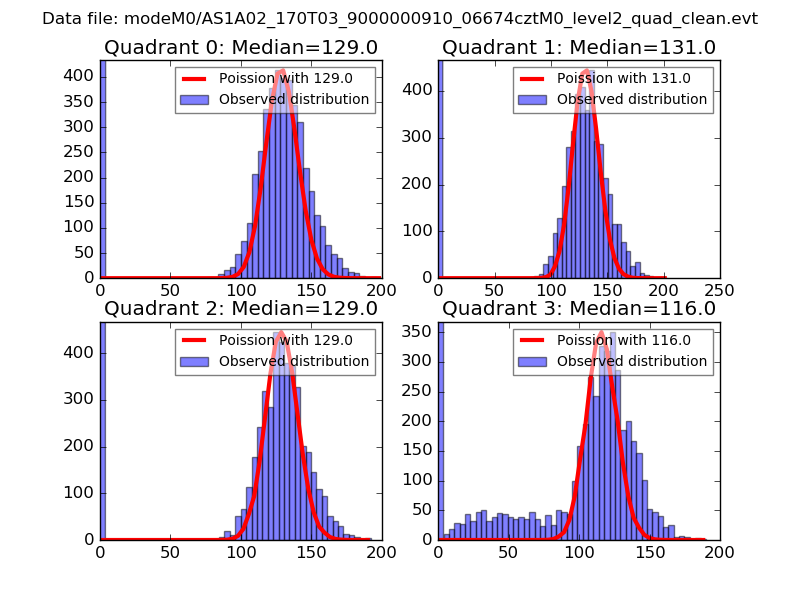 |
 |
| Quadrant-wise count rates Data is divided into 100 sec bins |
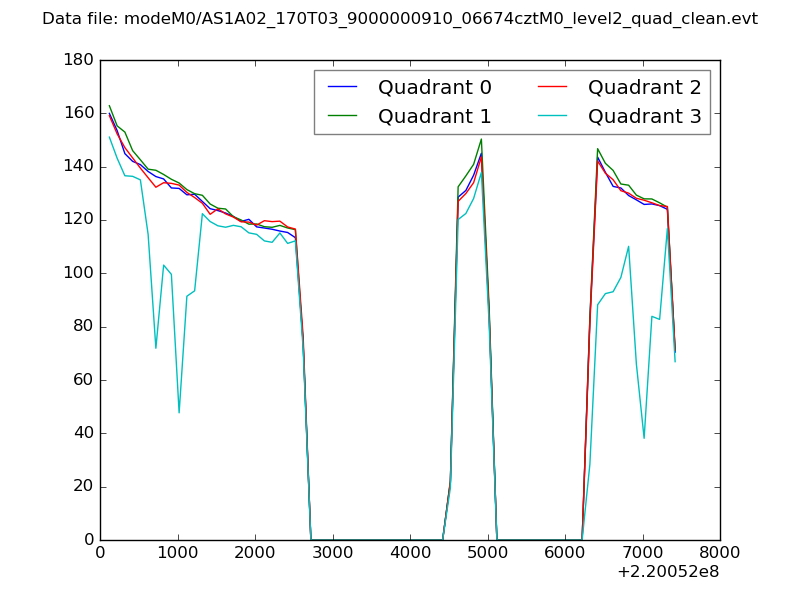 |
|
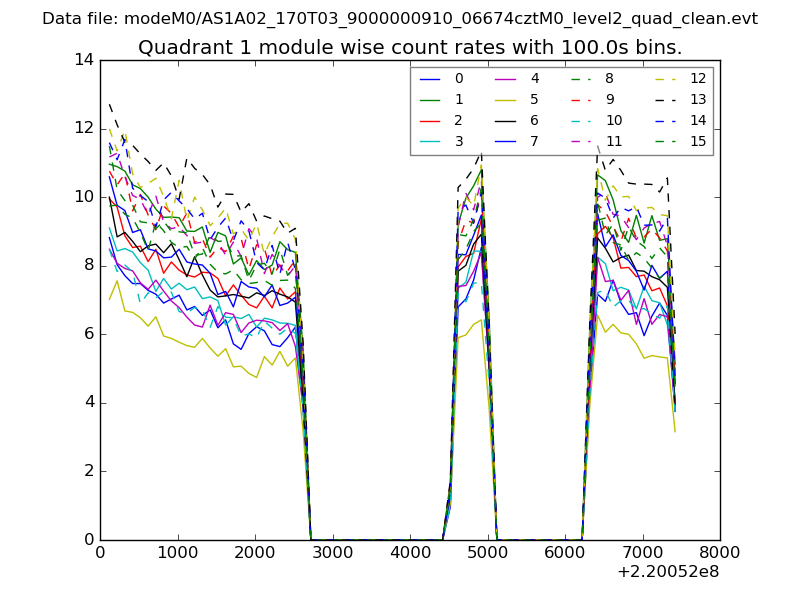
| Module-wise count rates for Quadrant A Data is divided into 100 sec bins |
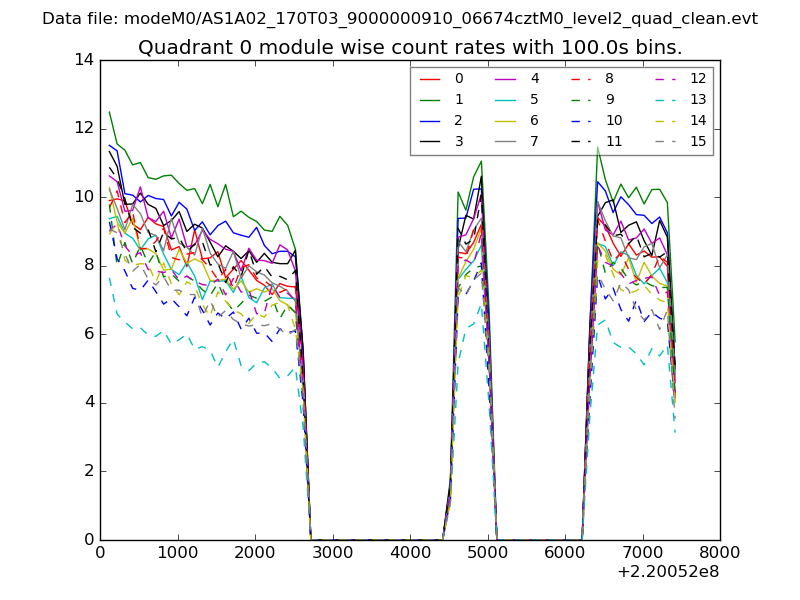 |
 |
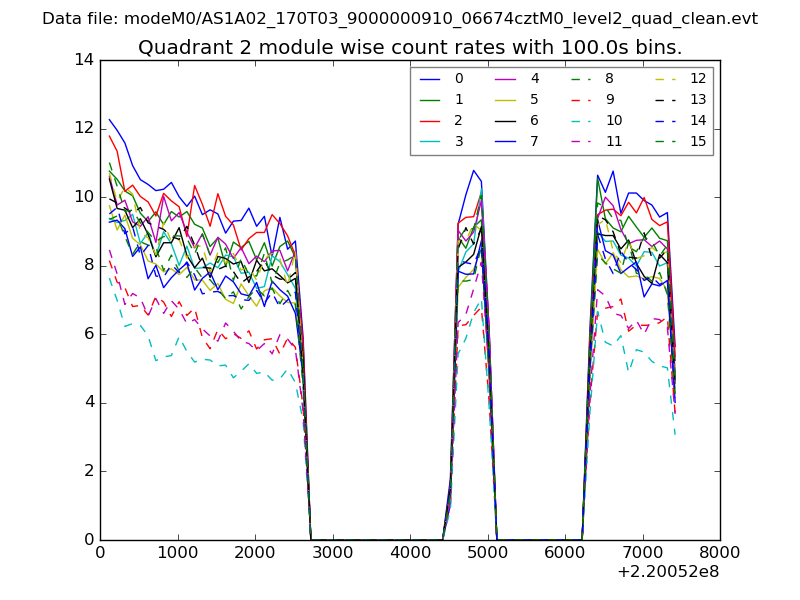
| Module-wise count rates for Quadrant B Data is divided into 100 sec bins |
 |
 |
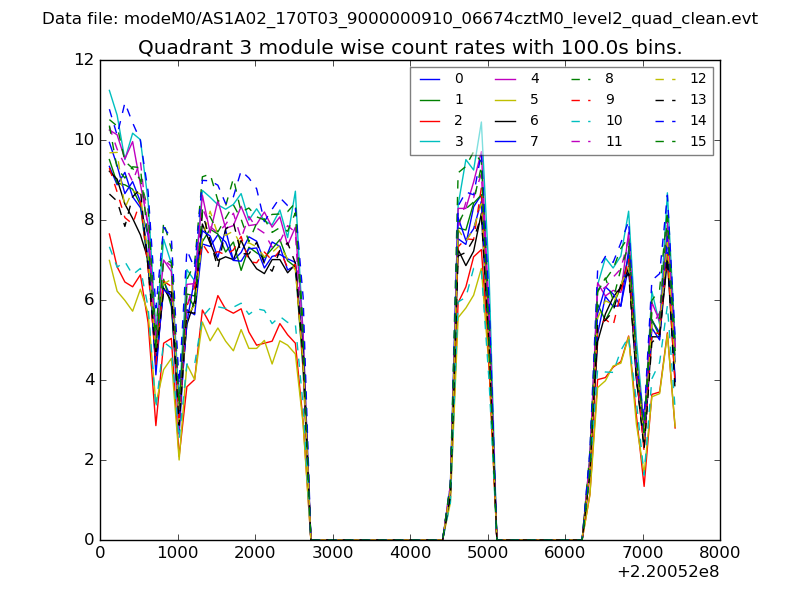
| Module-wise count rates for Quadrant C Data is divided into 100 sec bins |
 |
 |
| Module-wise count rates for Quadrant D Data is divided into 100 sec bins |
 |
 |
| Parameter | Plot |
|---|---|
| CZT HV Monitor | 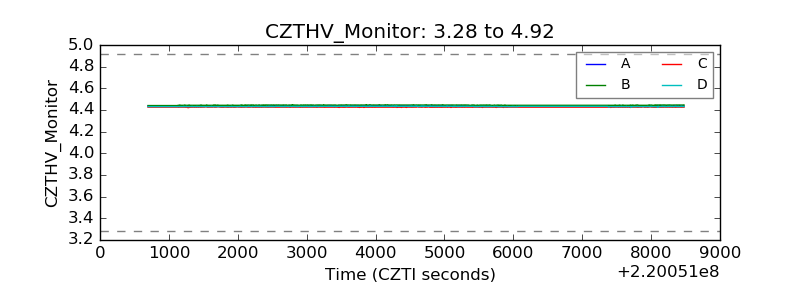 |
| D_VDD | 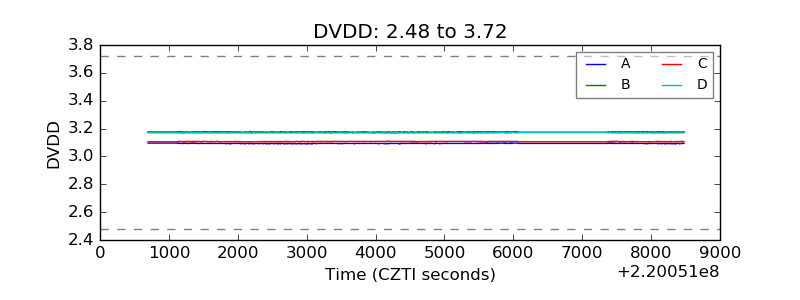 |
| Temperature 1 | 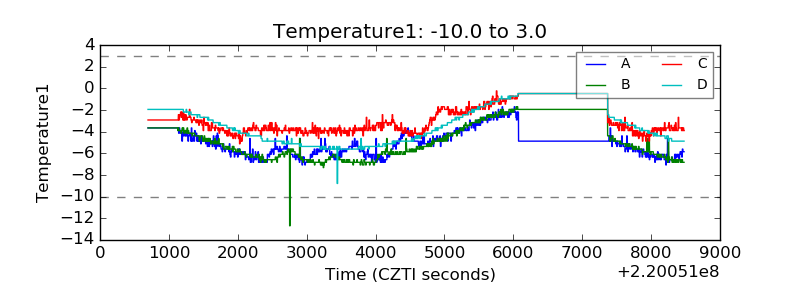 |
| Veto HV Monitor | 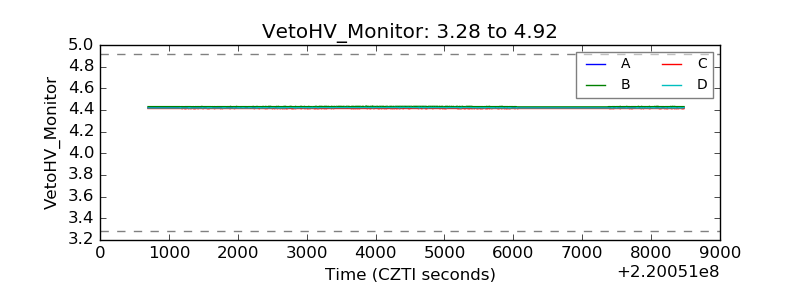 |
| Veto LLD | 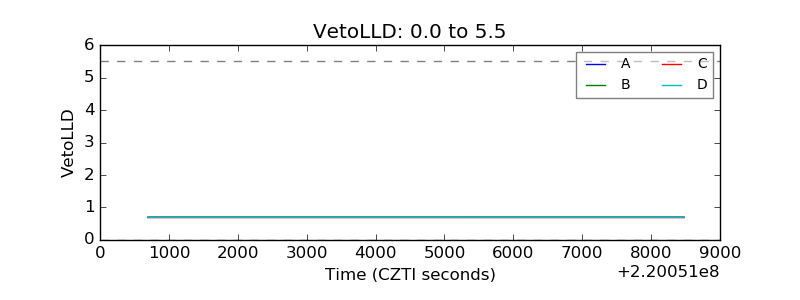 |
| Alpha Counter | 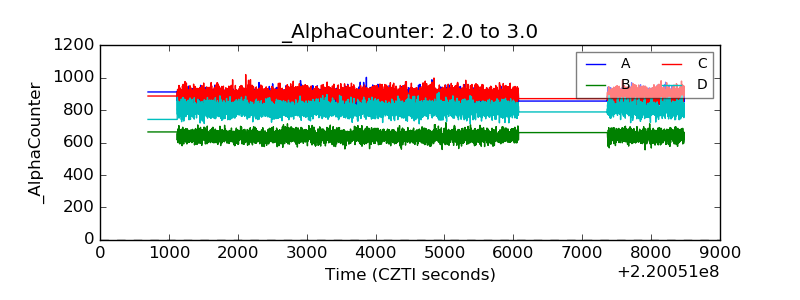 |
| _CPM_Rate | 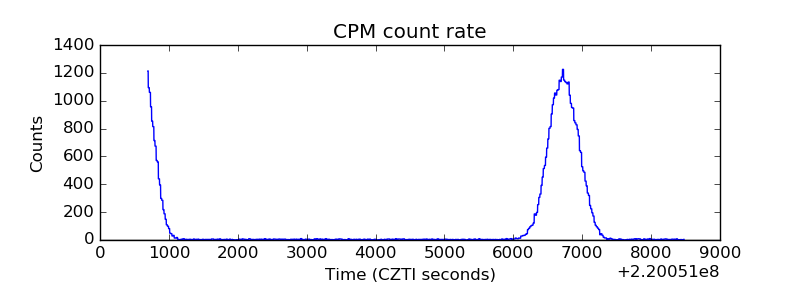 |
| CZT Counter | 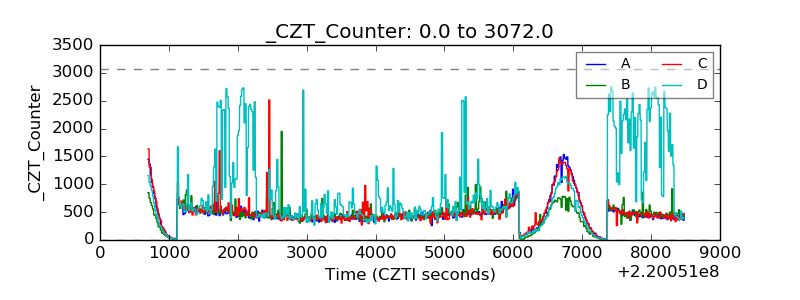 |
| +2.5 Volts monitor |  |
| +5 Volts monitor |  |
| _ROLL_ROT | 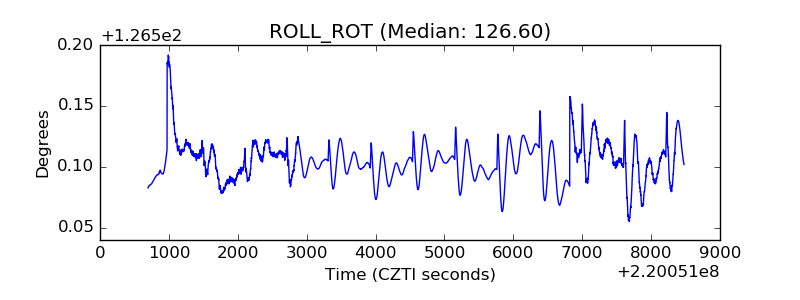 |
| _Roll_DEC | 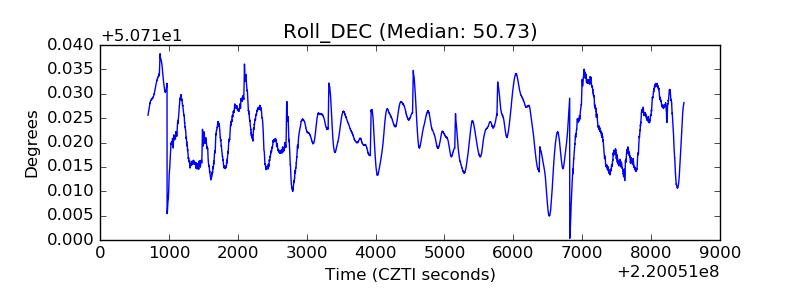 |
| _Roll_RA | 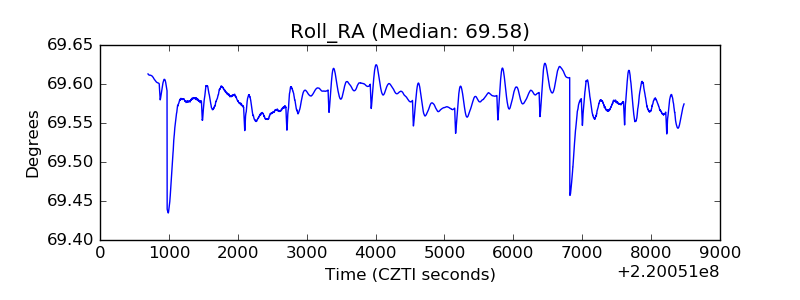 |
| Veto Counter | 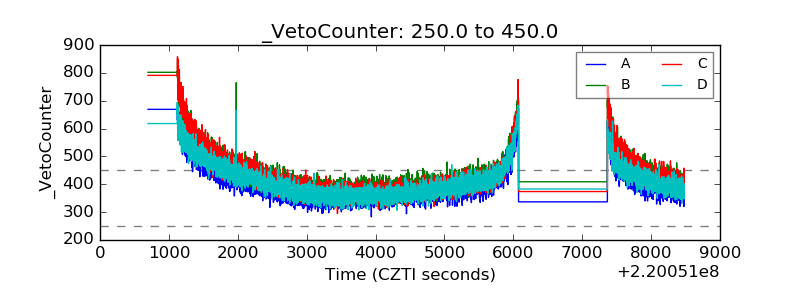 |