| Param | Original file | Final file |
|---|---|---|
| Filename | modeM0/AS1G06_102T01_9000000912cztM0_level2.fits | modeM0/AS1G06_102T01_9000000912cztM0_level2_quad_clean.evt |
| Size (bytes) | 516,669,120 | 532,915,200 |
| Size | 492.7 MB | 508.2 MB |
| Events in quadrant A | 3,099,340 | 3,198,420 |
| Events in quadrant B | 3,026,848 | 3,193,441 |
| Events in quadrant C | 3,115,538 | 3,081,162 |
| Events in quadrant D | 2,400,368 | 2,666,572 |
| Mode M9 | |||
|---|---|---|---|
| Quadrant | BADHDUFLAG | Total packets | Discarded packets |
| A | 0 | 66 | 0 |
| B | 0 | 66 | 0 |
| C | 0 | 66 | 0 |
| D | 0 | 66 | 0 |
| Mode SS | |||
|---|---|---|---|
| Quadrant | BADHDUFLAG | Total packets | Discarded packets |
| A | 0 | 1186 | 0 |
| B | 0 | 1186 | 0 |
| C | 0 | 1186 | 0 |
| D | 0 | 1186 | 0 |
| Mode M0 | |||
|---|---|---|---|
| Quadrant | BADHDUFLAG | Total packets | Discarded packets |
| A | 0 | 139935 | 0 |
| B | 0 | 127883 | 0 |
| C | 0 | 122189 | 0 |
| D | 0 | 211348 | 0 |
| Quadrant | Total seconds | Saturated seconds | Saturation percentage |
|---|---|---|---|
| A | 58316 | 1623 | 2.783113% |
| B | 58309 | 1187 | 2.035706% |
| C | 58322 | 733 | 1.256816% |
| D | 58320 | 9351 | 16.033951% |
Noise dominated data is calculated using 1-second bins in cleaned event files. If a bin has >2000 counts, and if more than 50% of those come from <1% of pixels, then it is considered to be noise-dominated and hence unusable.
| Quadrant | # 1 sec bins | Bins with >0 counts | Bins with >2000 counts | High rate bins dominated by noise | Noise dominated (total time) | Noise dominated (detector-on time) | Marked lightcurve |
|---|---|---|---|---|---|---|---|
| A | 64931 | 58333 | 0 | 0 | 0.00% | 0.00% |  |
| B | 64931 | 58322 | 0 | 0 | 0.00% | 0.00% |  |
| C | 64931 | 58337 | 0 | 0 | 0.00% | 0.00% |  |
| D | 64931 | 57917 | 0 | 0 | 0.00% | 0.00% |  |
Top three noisy pixels from each quadrant. If the there are fewer than three noisy pixels in the level2.evt file, extra rows are filled as -1
| Pixel properties | Quadrant properties | ||||||
|---|---|---|---|---|---|---|---|
| Quadrant | DetID | PixID | Counts | Sigma | Mean | Median | Sigma |
| A | 14 | 188 | 3203 | 11.73 | 804 | 746 | 209.4 |
| A | 0 | 29 | 3063 | 11.06 | 804 | 746 | 209.4 |
| A | 14 | 204 | 2748 | 9.56 | 804 | 746 | 209.4 |
| B | 2 | 9 | 2621 | 11.42 | 798 | 756 | 163.3 |
| B | 12 | 226 | 2162 | 8.61 | 798 | 756 | 163.3 |
| B | 14 | 254 | 2153 | 8.56 | 798 | 756 | 163.3 |
| C | 1 | 80 | 2306 | 7.07 | 822 | 757 | 219.1 |
| C | 1 | 81 | 2280 | 6.95 | 822 | 757 | 219.1 |
| C | 12 | 241 | 2242 | 6.78 | 822 | 757 | 219.1 |
| D | 7 | 5 | 1769 | 6.1 | 686 | 618 | 188.8 |
| D | 4 | 160 | 1753 | 6.01 | 686 | 618 | 188.8 |
| D | 3 | 14 | 1739 | 5.94 | 686 | 618 | 188.8 |
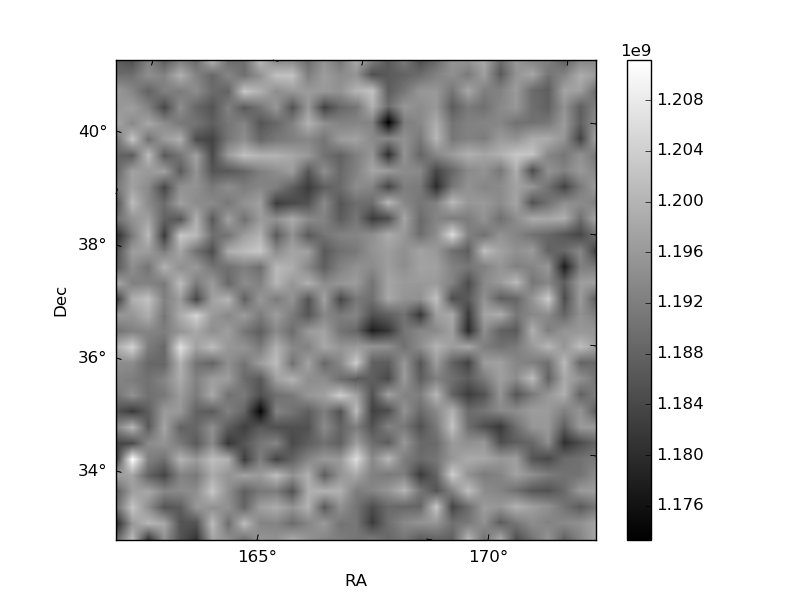
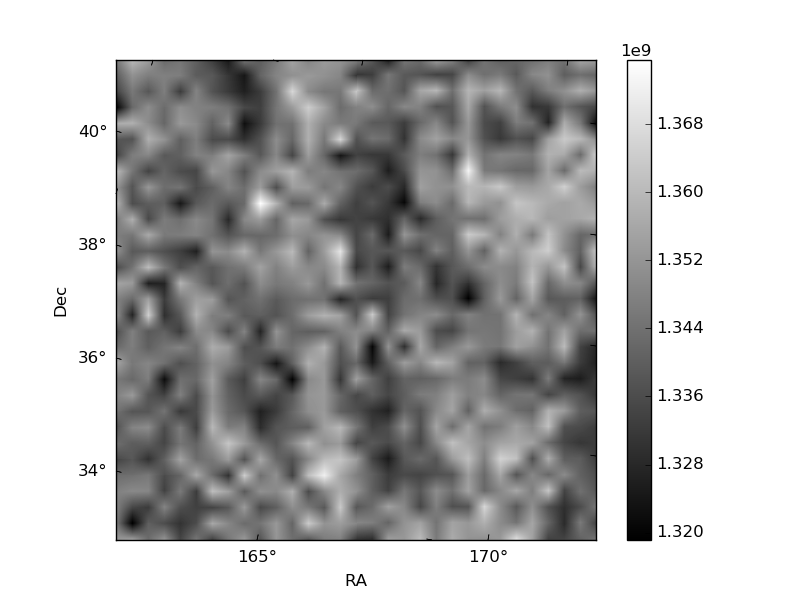
Histogram calculated using DETX and DETY for each event in the final _common_clean file
| Quadrant A | 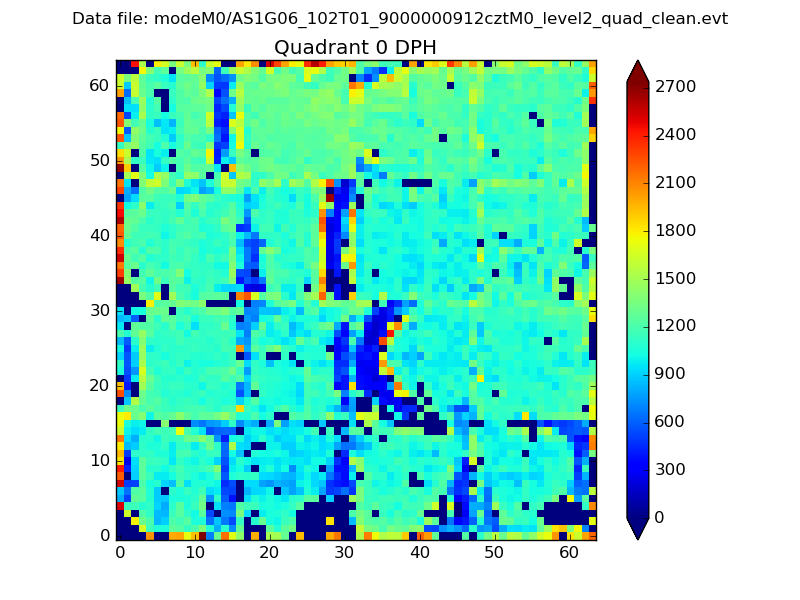 |
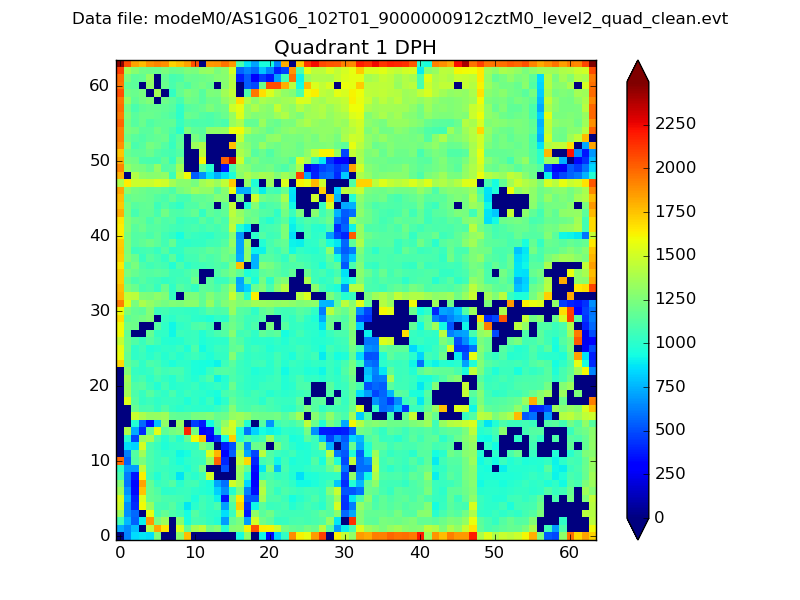 |
Quadrant B |
|---|---|---|---|
| Quadrant D |  |
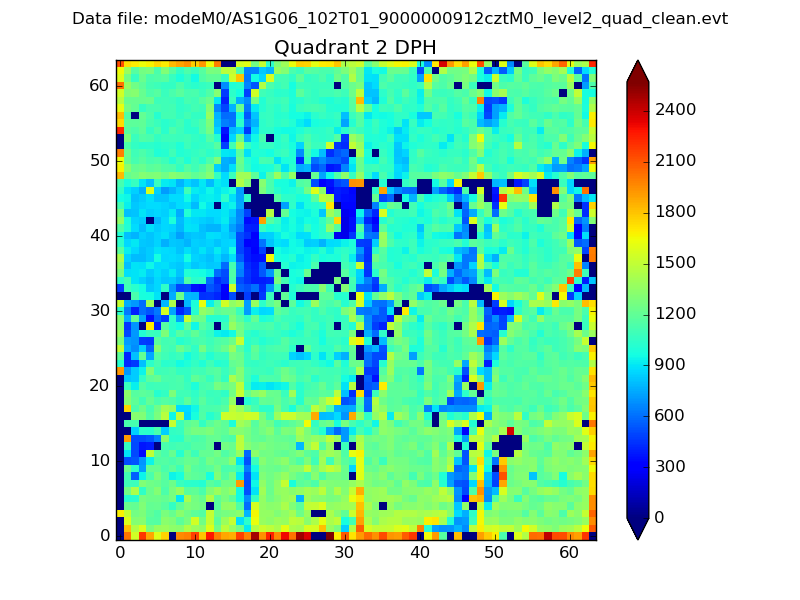 |
Quadrant C |
| Plot type | Count rate plots | Images |
|---|---|---|
| Comparison with Poisson distribution Blue bars denote a histogram of data divided into 1 sec bins. Red curve is a Poisson curve with rate = median count rate of data. |
 |
 |
| Quadrant-wise count rates Data is divided into 100 sec bins |
 |
|
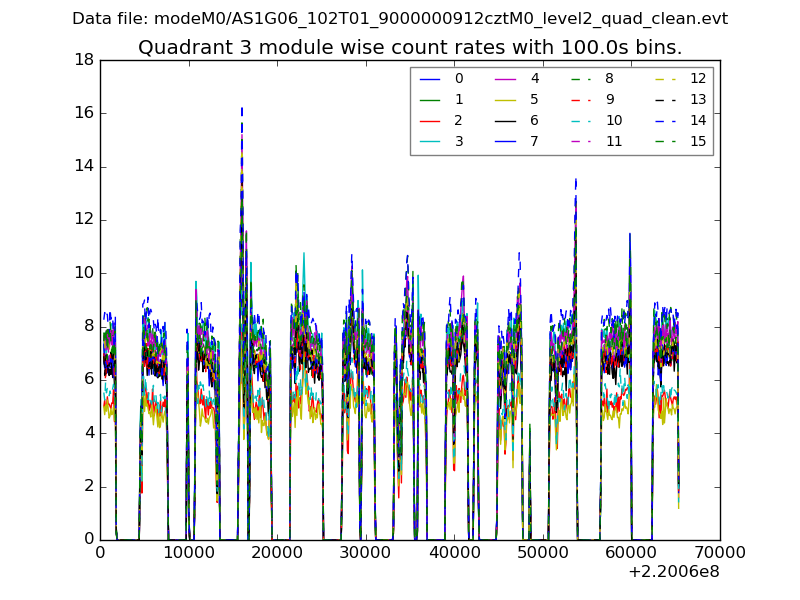
| Module-wise count rates for Quadrant A Data is divided into 100 sec bins |
 |
 |
| Module-wise count rates for Quadrant B Data is divided into 100 sec bins |
 |
 |
| Module-wise count rates for Quadrant C Data is divided into 100 sec bins |
 |
 |
| Module-wise count rates for Quadrant D Data is divided into 100 sec bins |
 |
 |
| Parameter | Plot |
|---|---|
| CZT HV Monitor | 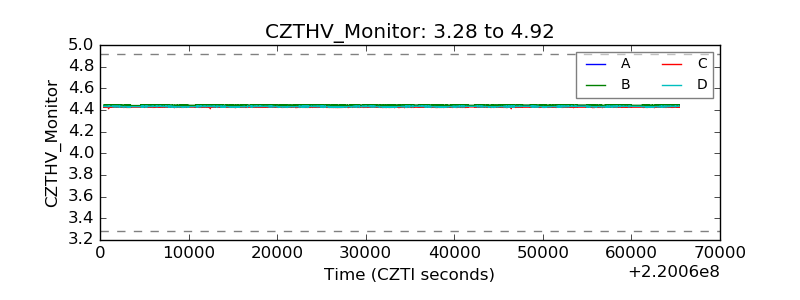 |
| D_VDD |  |
| Temperature 1 |  |
| Veto HV Monitor | 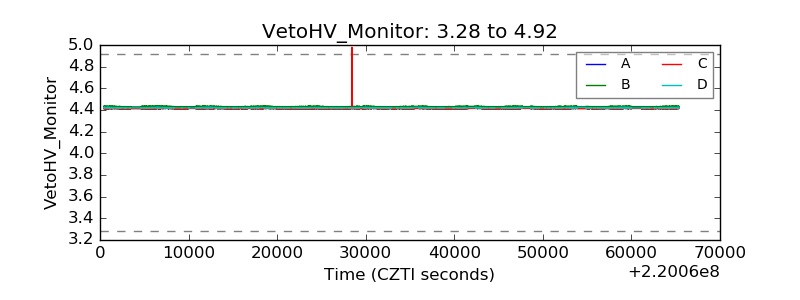 |
| Veto LLD |  |
| Alpha Counter |  |
| _CPM_Rate |  |
| CZT Counter |  |
| +2.5 Volts monitor |  |
| +5 Volts monitor |  |
| _ROLL_ROT |  |
| _Roll_DEC |  |
| _Roll_RA |  |
| Veto Counter |  |