| Param | Original file | Final file |
|---|---|---|
| Filename | modeM0/AS1G06_102T01_9000000912_06674cztM0_level2.evt | modeM0/AS1G06_102T01_9000000912_06674cztM0_level2_quad_clean.evt |
| Size (bytes) | 366,897,600 | 59,431,680 |
| Size | 349.9 MB | 56.7 MB |
| Events in quadrant A | 2,223,596 | 369,888 |
| Events in quadrant B | 2,289,926 | 379,323 |
| Events in quadrant C | 2,198,719 | 373,942 |
| Events in quadrant D | 4,071,640 | 338,734 |
| Mode M9 | |||
|---|---|---|---|
| Quadrant | BADHDUFLAG | Total packets | Discarded packets |
| A | 0 | 11 | 0 |
| B | 0 | 11 | 0 |
| C | 0 | 11 | 0 |
| D | 0 | 11 | 0 |
| Mode SS | |||
|---|---|---|---|
| Quadrant | BADHDUFLAG | Total packets | Discarded packets |
| A | 0 | 98 | 0 |
| B | 0 | 98 | 0 |
| C | 0 | 98 | 0 |
| D | 0 | 98 | 0 |
| Mode M0 | |||
|---|---|---|---|
| Quadrant | BADHDUFLAG | Total packets | Discarded packets |
| A | 0 | 10065 | 2 |
| B | 0 | 10293 | 1 |
| C | 0 | 10058 | 1 |
| D | 0 | 15485 | 1 |
| Quadrant | Total seconds | Saturated seconds | Saturation percentage |
|---|---|---|---|
| A | 4807 | 33 | 0.686499% |
| B | 4807 | 54 | 1.123362% |
| C | 4807 | 31 | 0.644893% |
| D | 4807 | 743 | 15.456626% |
Noise dominated data is calculated using 1-second bins in cleaned event files. If a bin has >2000 counts, and if more than 50% of those come from <1% of pixels, then it is considered to be noise-dominated and hence unusable.
| Quadrant | # 1 sec bins | Bins with >0 counts | Bins with >2000 counts | High rate bins dominated by noise | Noise dominated (total time) | Noise dominated (detector-on time) | Marked lightcurve |
|---|---|---|---|---|---|---|---|
| A | 5912 | 4808 | 0 | 0 | 0.00% | 0.00% |  |
| B | 5912 | 4808 | 3 | 3 | 0.05% | 0.06% |  |
| C | 5912 | 4808 | 3 | 3 | 0.05% | 0.06% |  |
| D | 5912 | 4808 | 453 | 453 | 7.66% | 9.42% |  |
Top three noisy pixels from each quadrant. If the there are fewer than three noisy pixels in the level2.evt file, extra rows are filled as -1
| Pixel properties | Quadrant properties | ||||||
|---|---|---|---|---|---|---|---|
| Quadrant | DetID | PixID | Counts | Sigma | Mean | Median | Sigma |
| A | 14 | 111 | 34367 | 293.37 | 562 | 548 | 115.3 |
| A | 8 | 15 | 11528 | 95.25 | 562 | 548 | 115.3 |
| A | 3 | 1 | 9431 | 77.06 | 562 | 548 | 115.3 |
| B | 0 | 214 | 34400 | 314.04 | 565 | 551 | 107.8 |
| B | 4 | 81 | 28606 | 260.28 | 565 | 551 | 107.8 |
| B | 4 | 48 | 15938 | 142.76 | 565 | 551 | 107.8 |
| C | 9 | 247 | 72055 | 557.52 | 545 | 547 | 128.3 |
| C | 13 | 61 | 4427 | 30.25 | 545 | 547 | 128.3 |
| C | 3 | 202 | 1388 | 6.56 | 545 | 547 | 128.3 |
| D | 2 | 33 | 1641006 | 13233.53 | 500 | 485 | 124.0 |
| D | 8 | 195 | 278233 | 2240.5 | 500 | 485 | 124.0 |
| D | 2 | 152 | 143889 | 1156.79 | 500 | 485 | 124.0 |
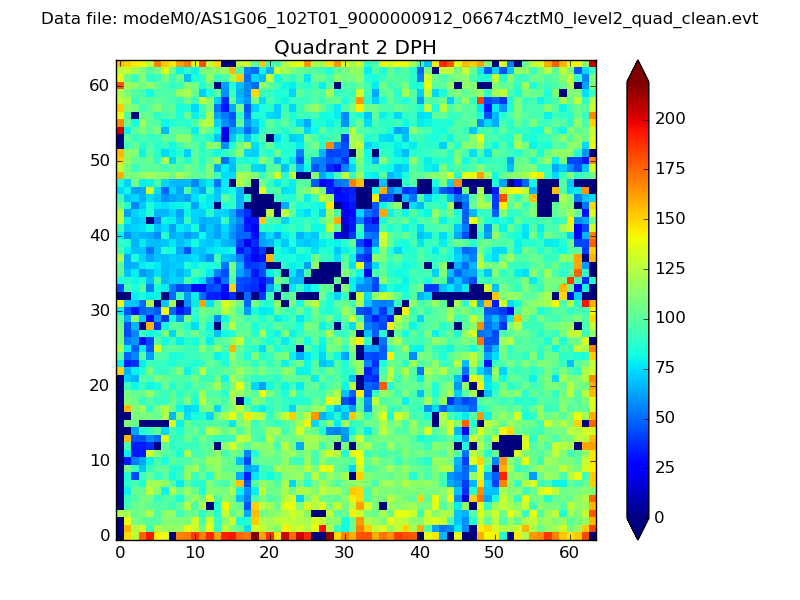
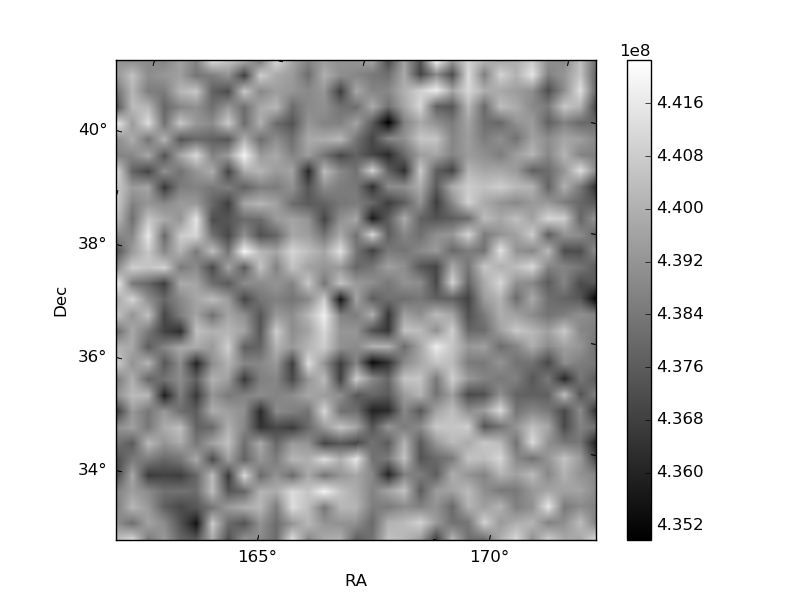
Histogram calculated using DETX and DETY for each event in the final _common_clean file
| Quadrant A | 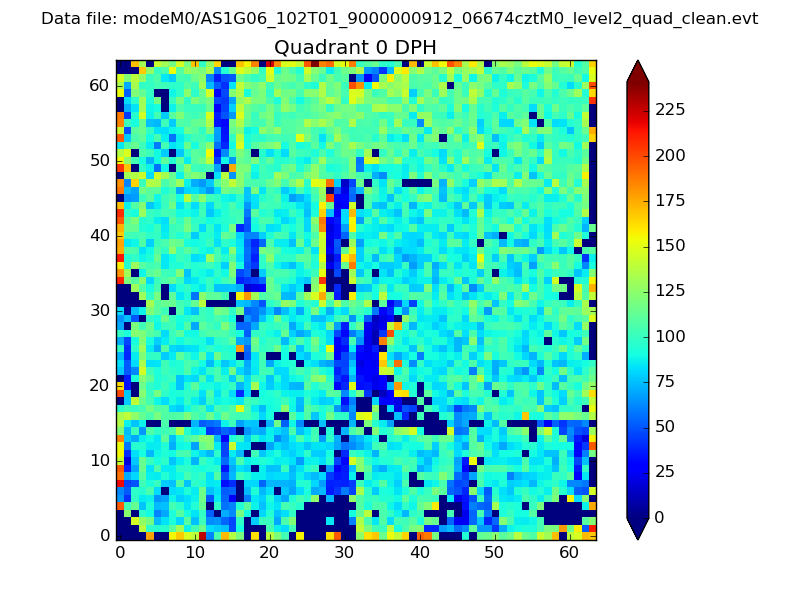 |
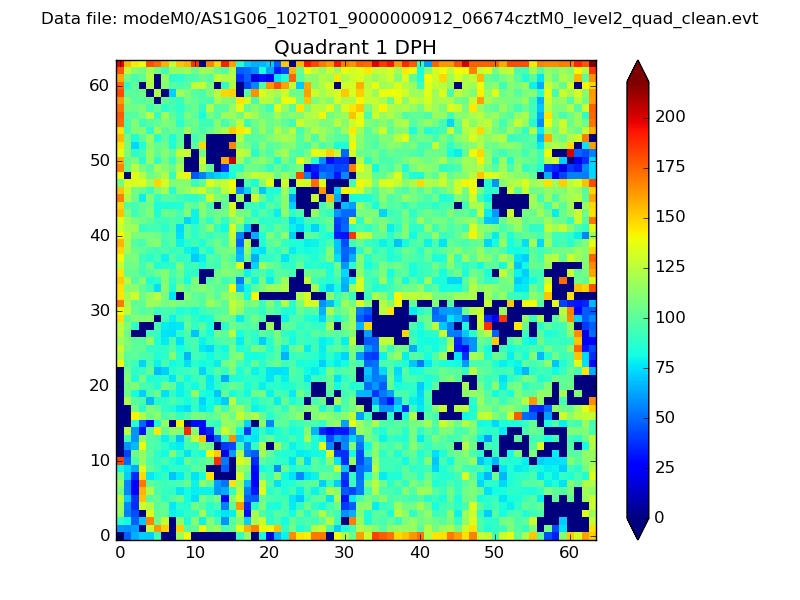 |
Quadrant B |
|---|---|---|---|
| Quadrant D | 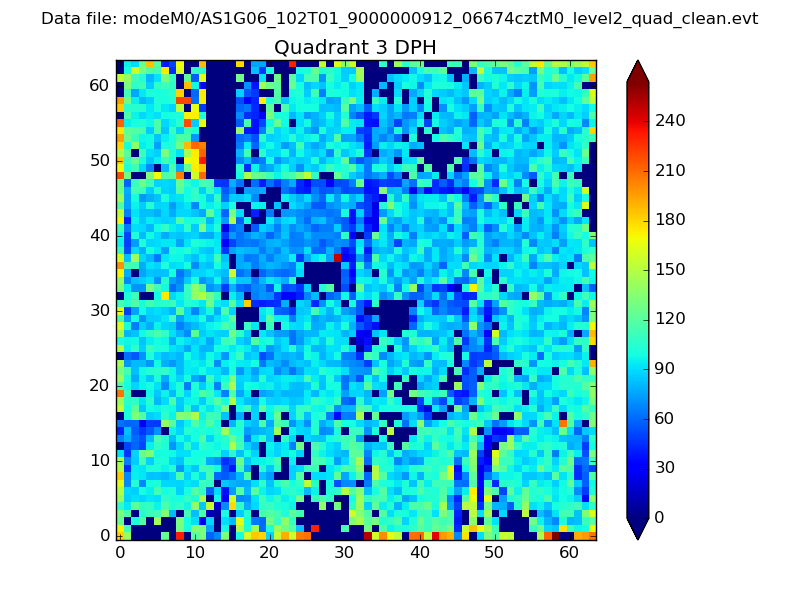 |
 |
Quadrant C |
| Plot type | Count rate plots | Images |
|---|---|---|
| Comparison with Poisson distribution Blue bars denote a histogram of data divided into 1 sec bins. Red curve is a Poisson curve with rate = median count rate of data. |
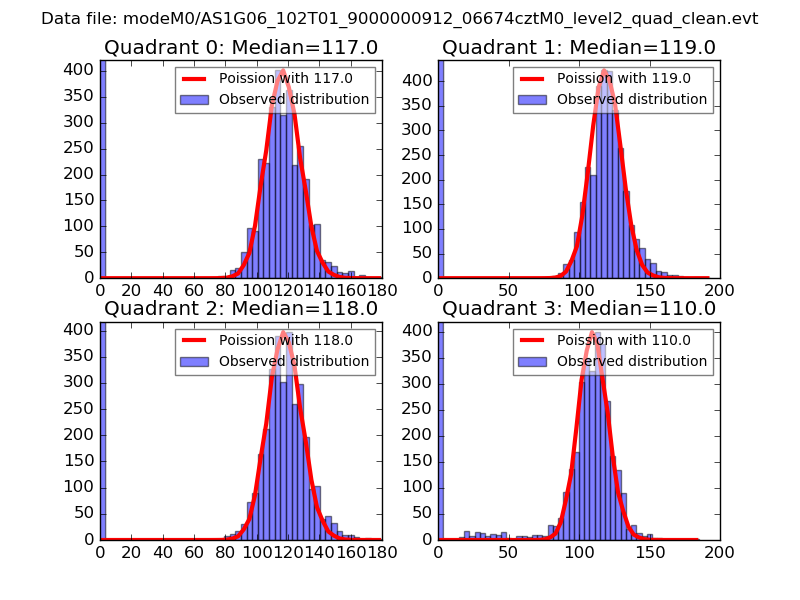 |
 |
| Quadrant-wise count rates Data is divided into 100 sec bins |
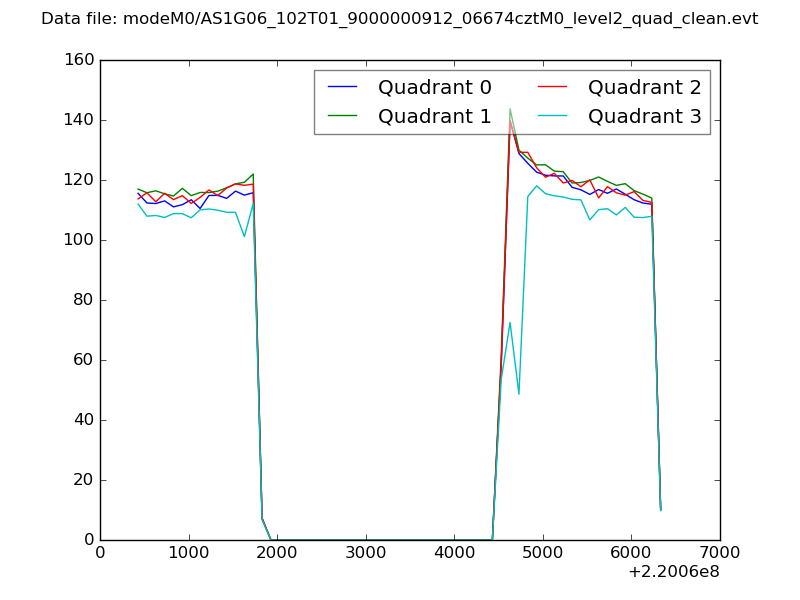 |
|
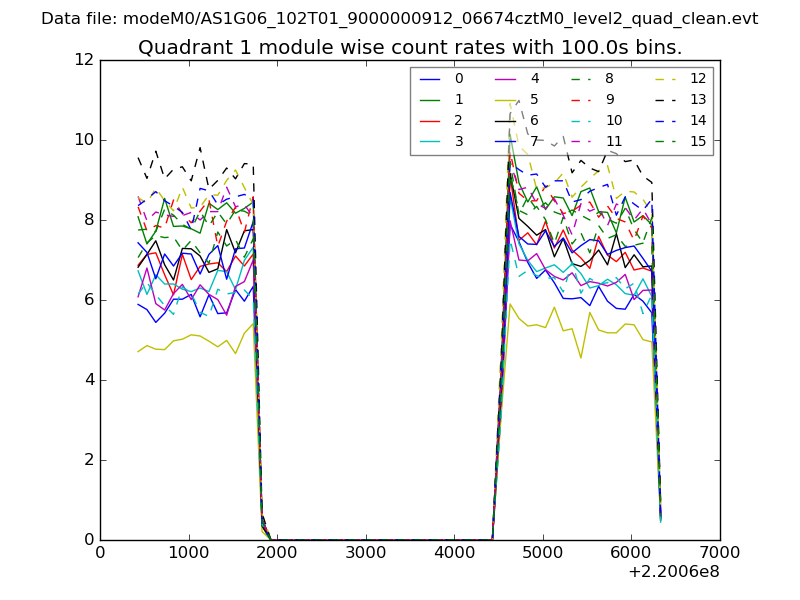
| Module-wise count rates for Quadrant A Data is divided into 100 sec bins |
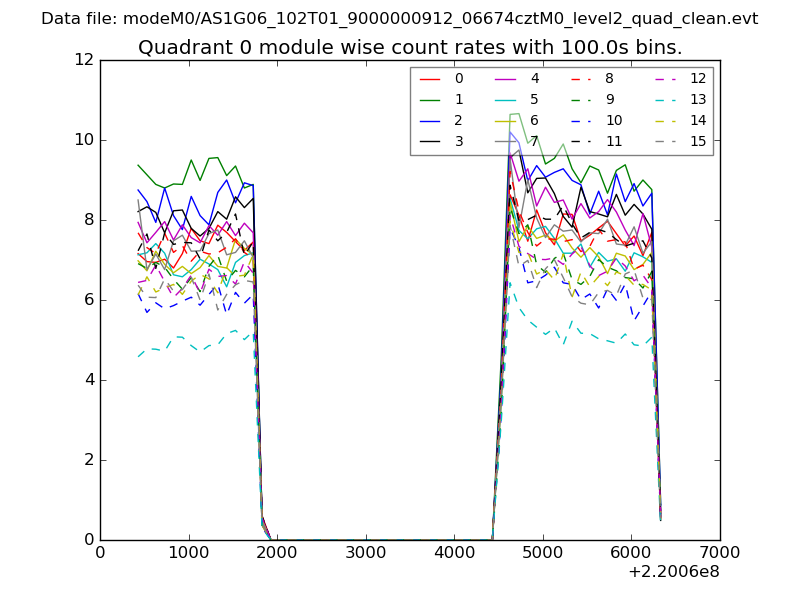 |
 |
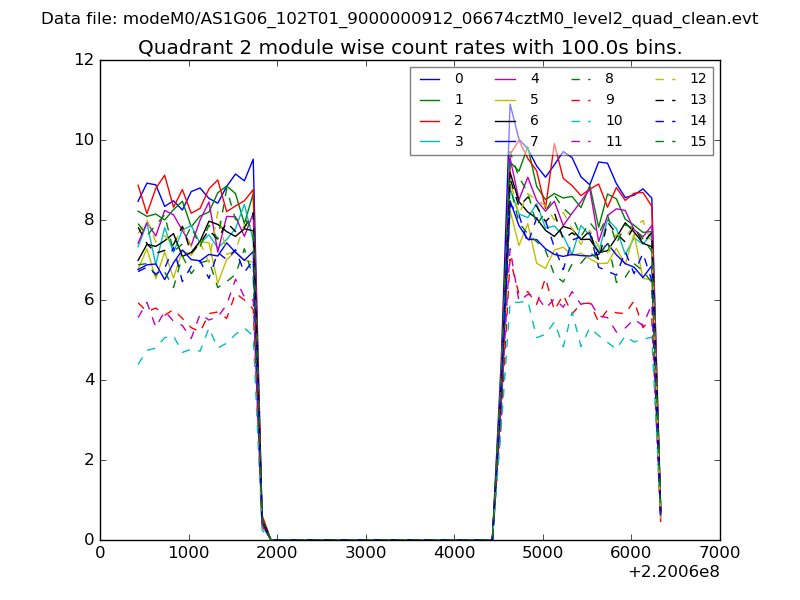
| Module-wise count rates for Quadrant B Data is divided into 100 sec bins |
 |
 |
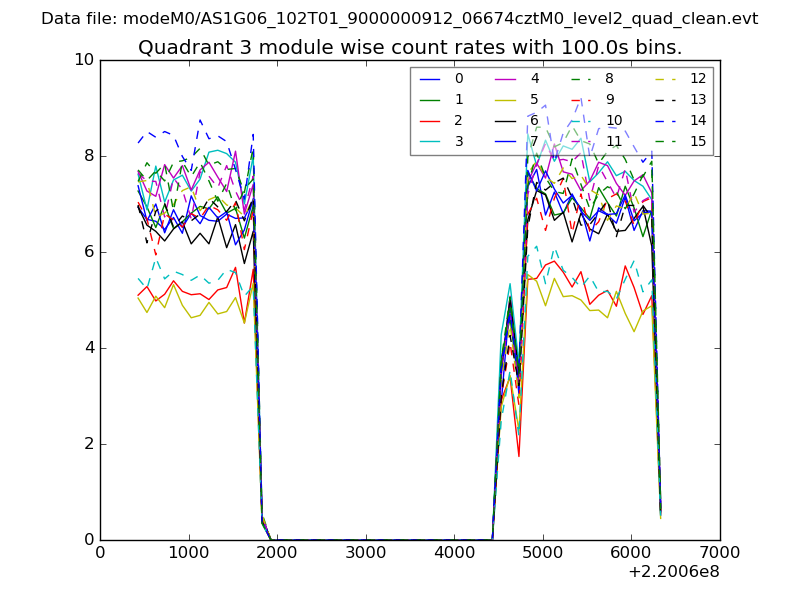
| Module-wise count rates for Quadrant C Data is divided into 100 sec bins |
 |
 |
| Module-wise count rates for Quadrant D Data is divided into 100 sec bins |
 |
 |
| Parameter | Plot |
|---|---|
| CZT HV Monitor | 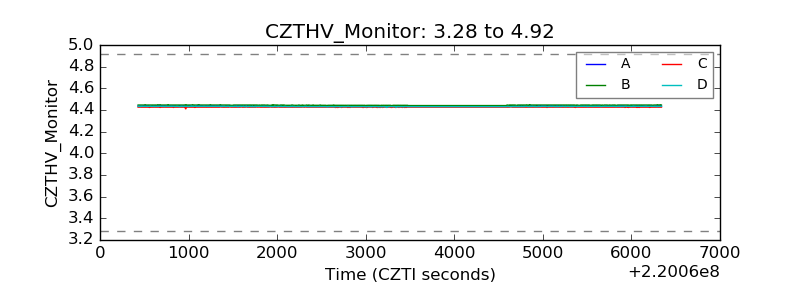 |
| D_VDD | 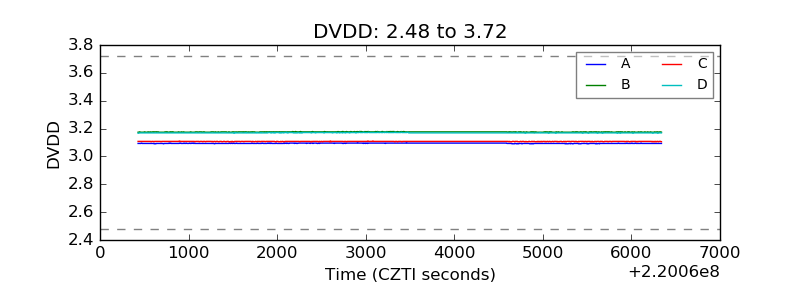 |
| Temperature 1 | 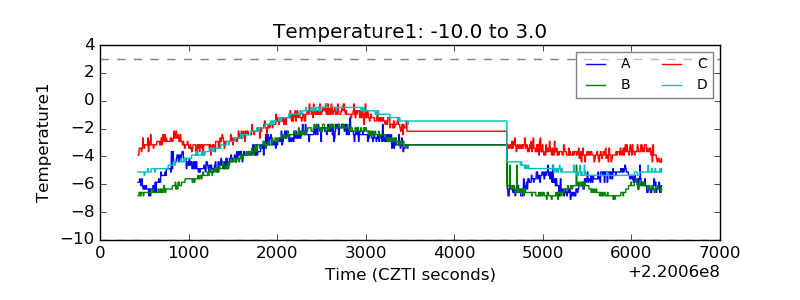 |
| Veto HV Monitor | 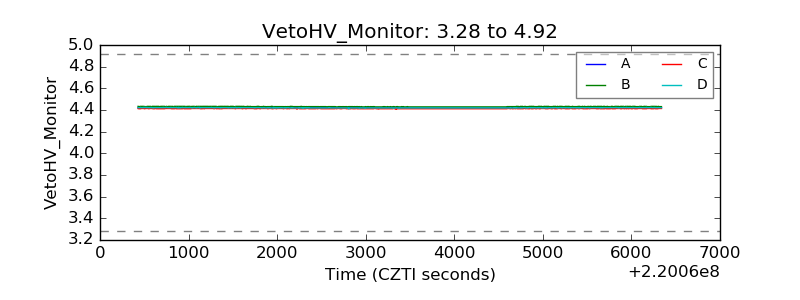 |
| Veto LLD | 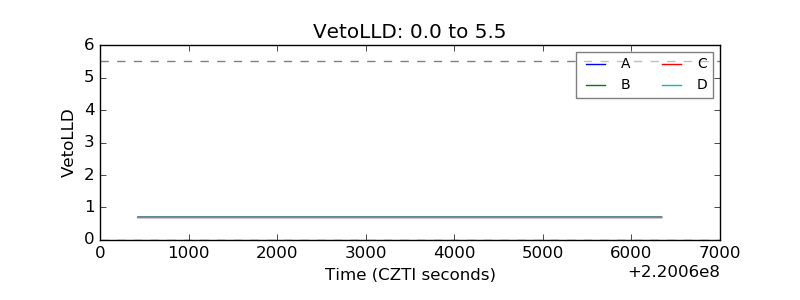 |
| Alpha Counter | 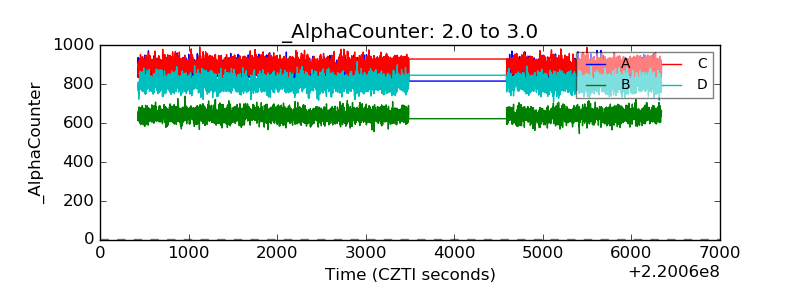 |
| _CPM_Rate | 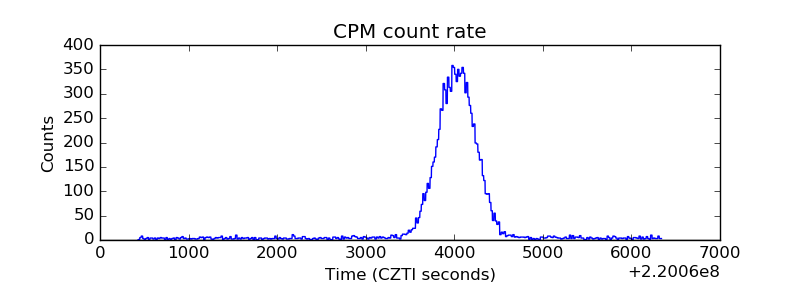 |
| CZT Counter | 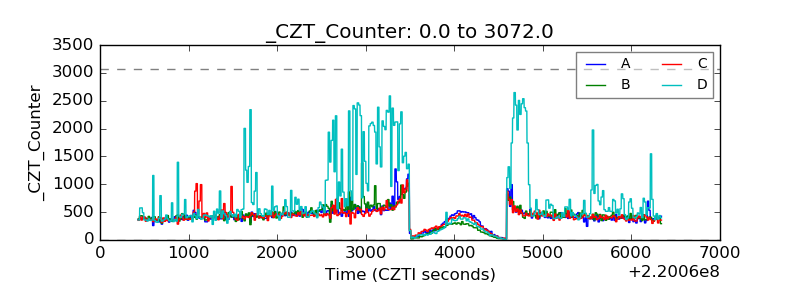 |
| +2.5 Volts monitor |  |
| +5 Volts monitor | 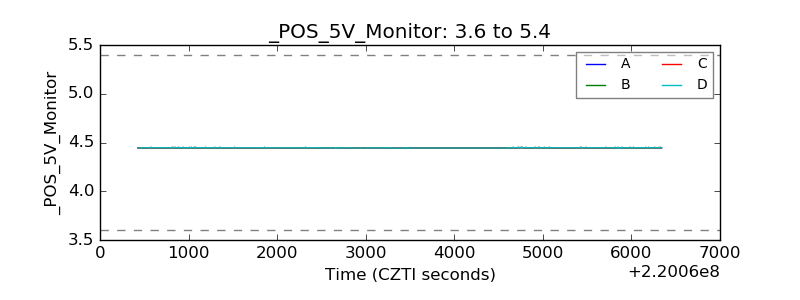 |
| _ROLL_ROT | 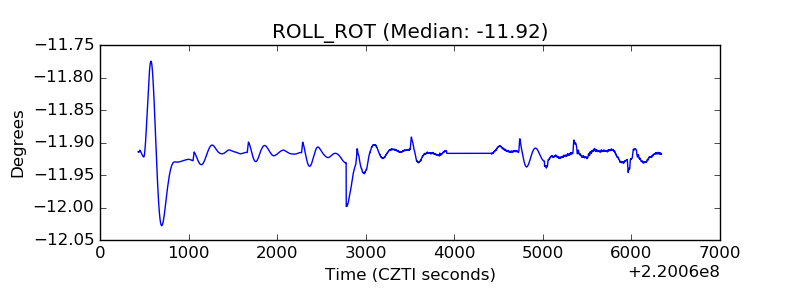 |
| _Roll_DEC | 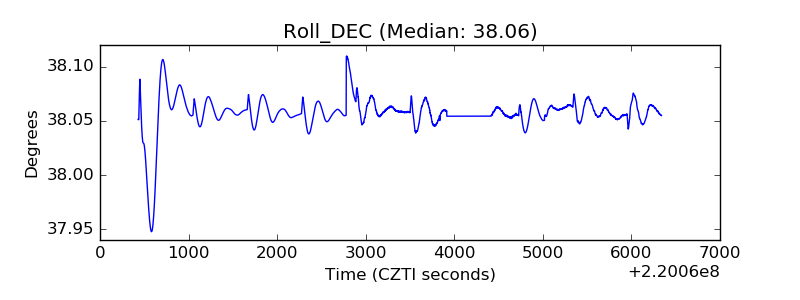 |
| _Roll_RA | 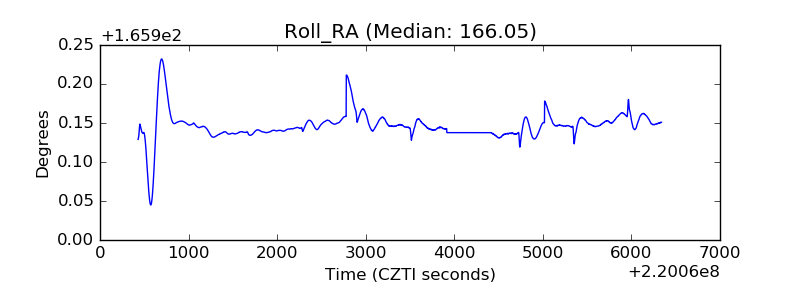 |
| Veto Counter | 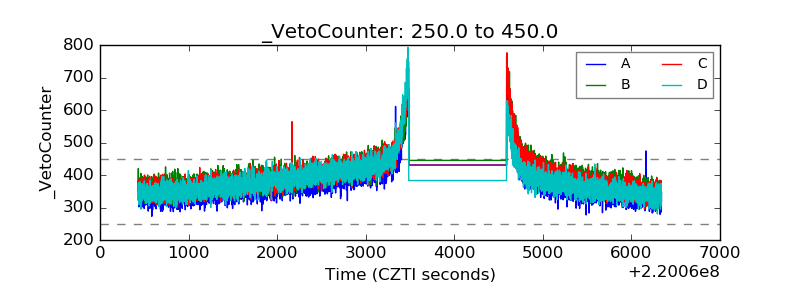 |