| Param | Original file | Final file |
|---|---|---|
| Filename | modeM0/AS1G06_102T01_9000000912_06675cztM0_level2.evt | modeM0/AS1G06_102T01_9000000912_06675cztM0_level2_quad_clean.evt |
| Size (bytes) | 528,854,400 | 92,707,200 |
| Size | 504.4 MB | 88.4 MB |
| Events in quadrant A | 3,235,855 | 585,240 |
| Events in quadrant B | 3,407,069 | 596,998 |
| Events in quadrant C | 3,220,453 | 591,113 |
| Events in quadrant D | 5,667,222 | 535,990 |
| Mode M9 | |||
|---|---|---|---|
| Quadrant | BADHDUFLAG | Total packets | Discarded packets |
| A | 0 | 9 | 0 |
| B | 0 | 9 | 0 |
| C | 0 | 9 | 0 |
| D | 0 | 9 | 0 |
| Mode SS | |||
|---|---|---|---|
| Quadrant | BADHDUFLAG | Total packets | Discarded packets |
| A | 0 | 146 | 0 |
| B | 0 | 146 | 0 |
| C | 0 | 146 | 0 |
| D | 0 | 146 | 0 |
| Mode M0 | |||
|---|---|---|---|
| Quadrant | BADHDUFLAG | Total packets | Discarded packets |
| A | 0 | 14822 | 2 |
| B | 0 | 15265 | 1 |
| C | 0 | 14940 | 1 |
| D | 0 | 21922 | 1 |
| Quadrant | Total seconds | Saturated seconds | Saturation percentage |
|---|---|---|---|
| A | 7162 | 52 | 0.726054% |
| B | 7162 | 79 | 1.103044% |
| C | 7162 | 50 | 0.698129% |
| D | 7162 | 892 | 12.454622% |
Noise dominated data is calculated using 1-second bins in cleaned event files. If a bin has >2000 counts, and if more than 50% of those come from <1% of pixels, then it is considered to be noise-dominated and hence unusable.
| Quadrant | # 1 sec bins | Bins with >0 counts | Bins with >2000 counts | High rate bins dominated by noise | Noise dominated (total time) | Noise dominated (detector-on time) | Marked lightcurve |
|---|---|---|---|---|---|---|---|
| A | 7932 | 7165 | 2 | 2 | 0.03% | 0.03% | 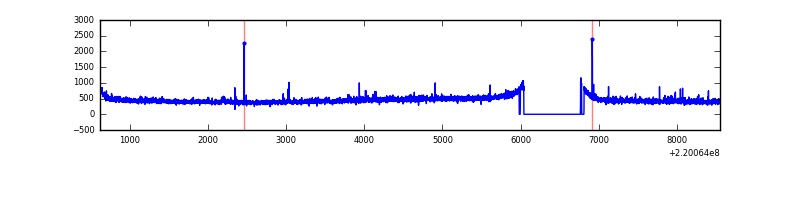 |
| B | 7932 | 7165 | 5 | 5 | 0.06% | 0.07% | 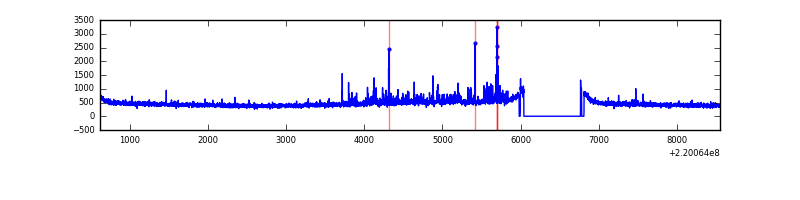 |
| C | 7932 | 7165 | 15 | 15 | 0.19% | 0.21% | 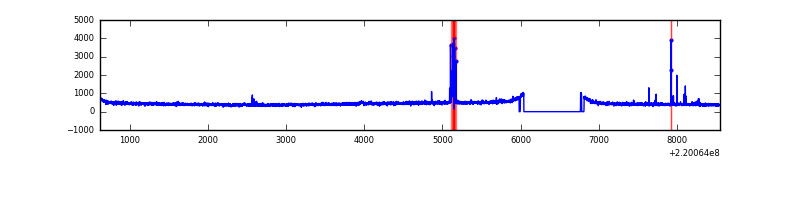 |
| D | 7932 | 7165 | 621 | 621 | 7.83% | 8.67% | 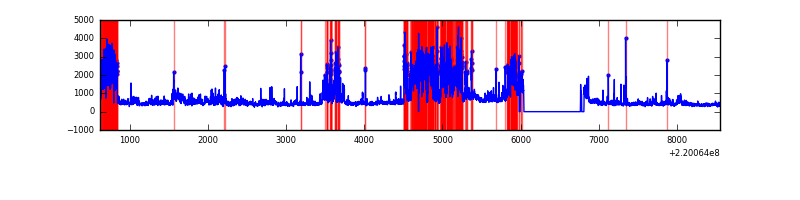 |
Top three noisy pixels from each quadrant. If the there are fewer than three noisy pixels in the level2.evt file, extra rows are filled as -1
| Pixel properties | Quadrant properties | ||||||
|---|---|---|---|---|---|---|---|
| Quadrant | DetID | PixID | Counts | Sigma | Mean | Median | Sigma |
| A | 8 | 15 | 42179 | 245.49 | 820 | 802 | 168.5 |
| A | 14 | 111 | 16643 | 93.98 | 820 | 802 | 168.5 |
| A | 8 | 160 | 12273 | 68.06 | 820 | 802 | 168.5 |
| B | 4 | 81 | 134502 | 848.17 | 829 | 808 | 157.6 |
| B | 12 | 111 | 16201 | 97.66 | 829 | 808 | 157.6 |
| B | 0 | 214 | 15813 | 95.19 | 829 | 808 | 157.6 |
| C | 9 | 247 | 106426 | 568.33 | 797 | 800 | 185.9 |
| C | 13 | 61 | 6359 | 29.91 | 797 | 800 | 185.9 |
| C | 1 | 3 | 3978 | 17.1 | 797 | 800 | 185.9 |
| D | 2 | 33 | 2059098 | 11294.34 | 739 | 715 | 182.2 |
| D | 8 | 195 | 485483 | 2659.92 | 739 | 715 | 182.2 |
| D | 2 | 152 | 206769 | 1130.62 | 739 | 715 | 182.2 |
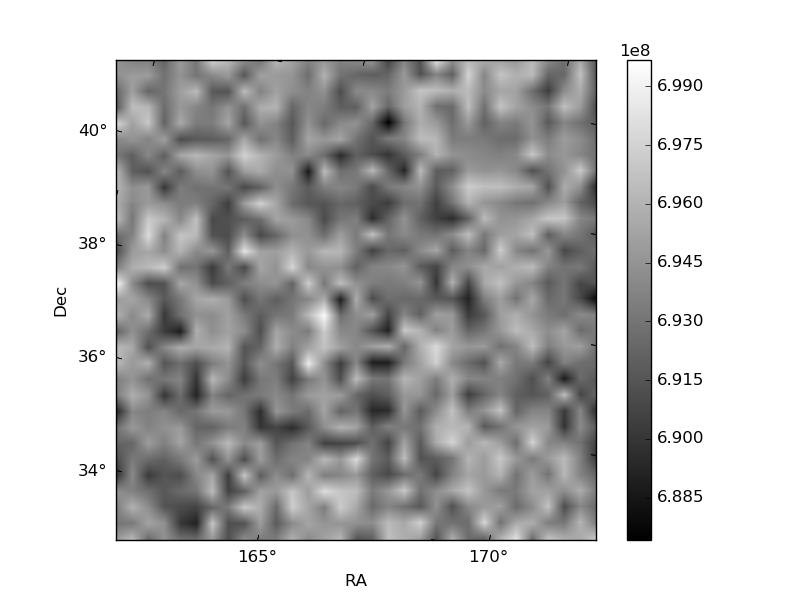
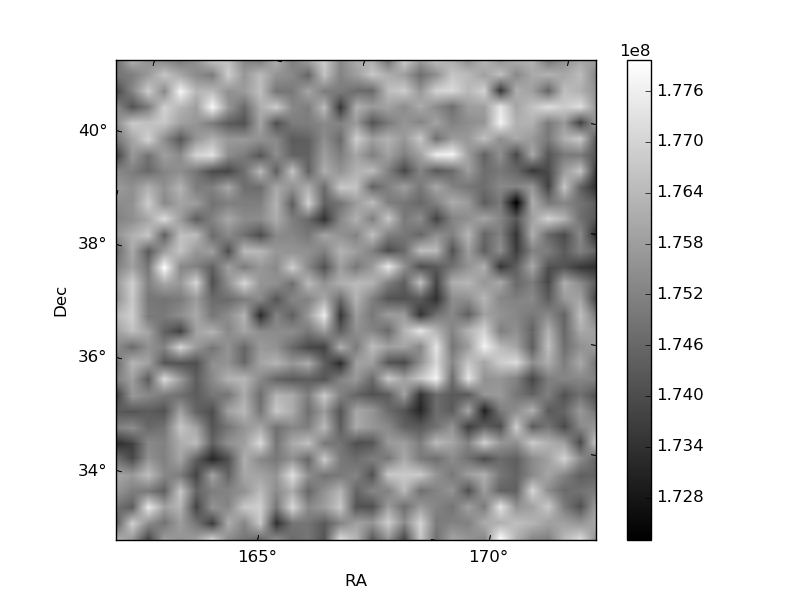
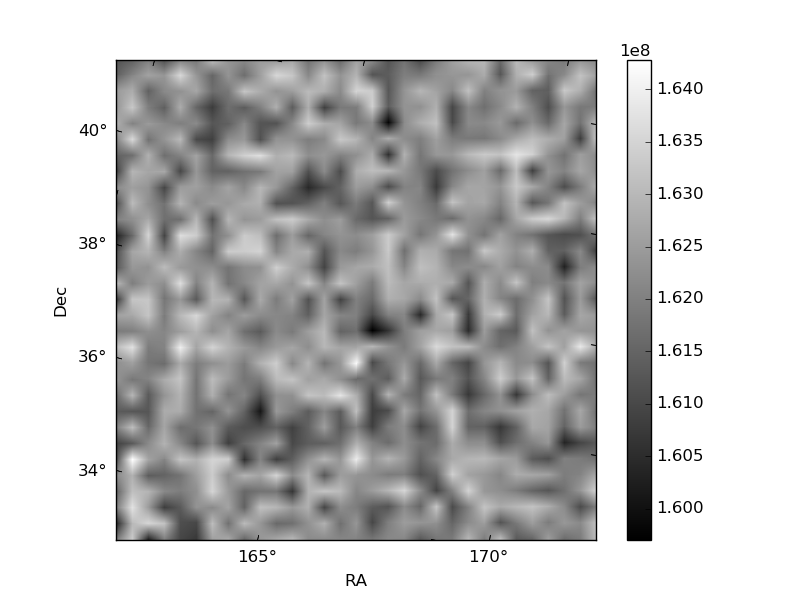
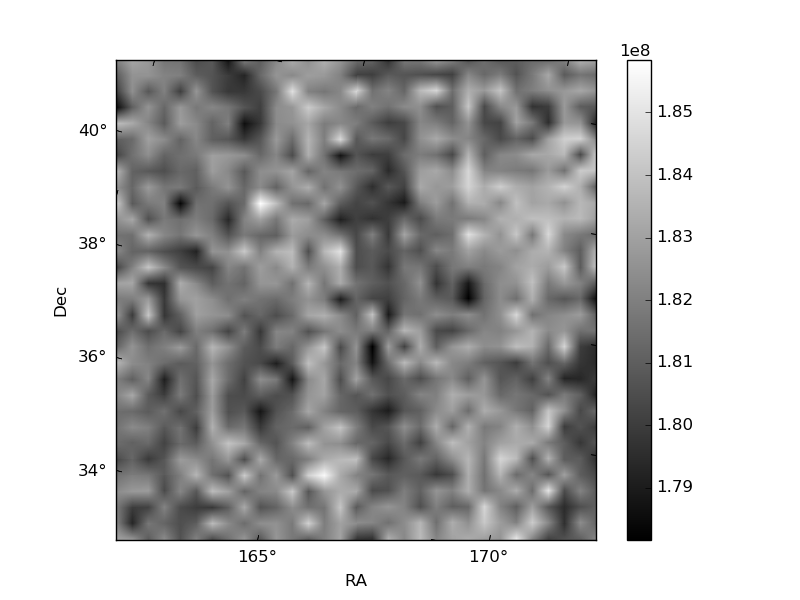
Histogram calculated using DETX and DETY for each event in the final _common_clean file
| Quadrant A | 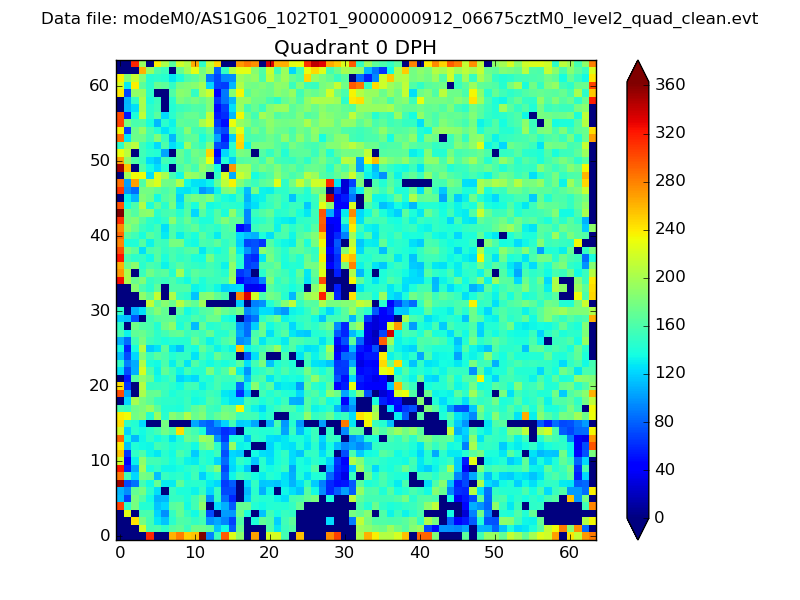 |
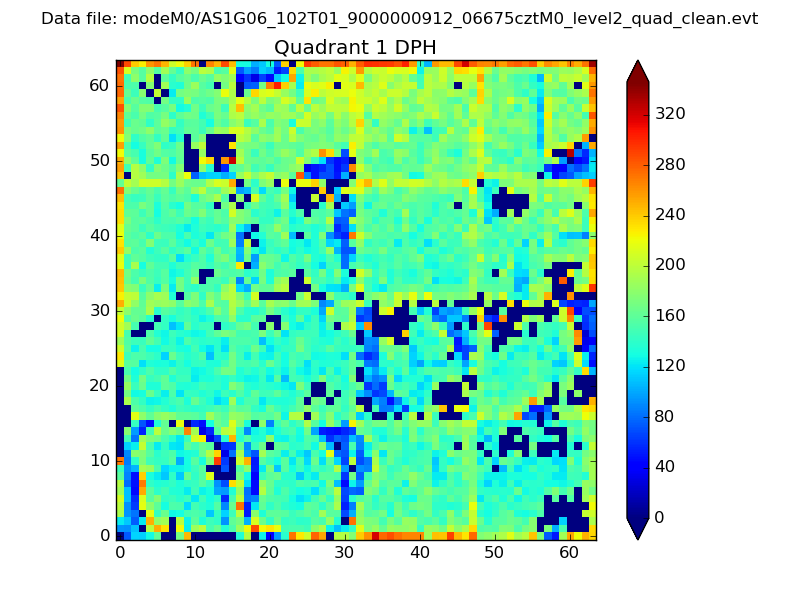 |
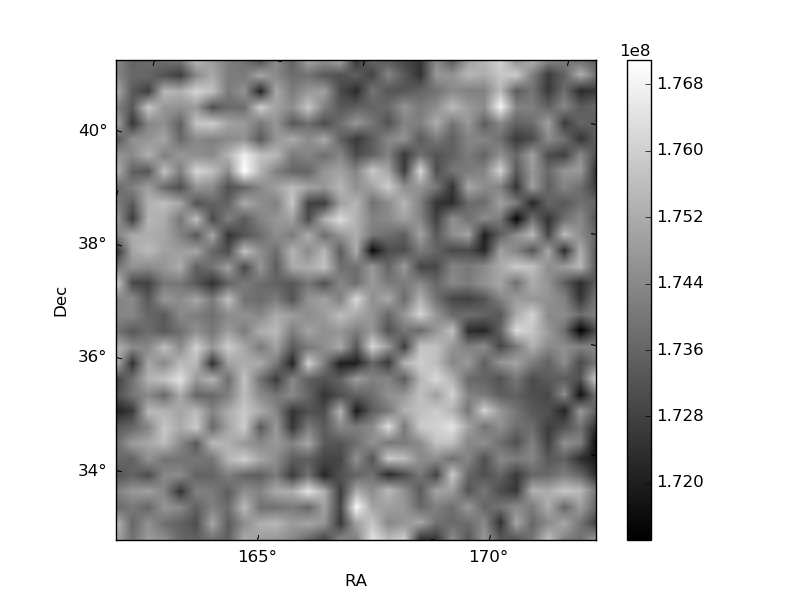
Quadrant B |
|---|---|---|---|
| Quadrant D | 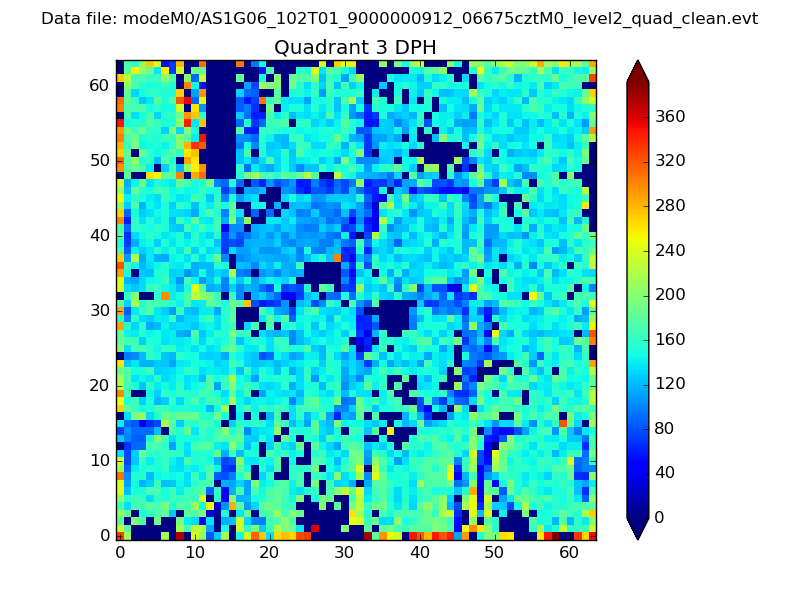 |
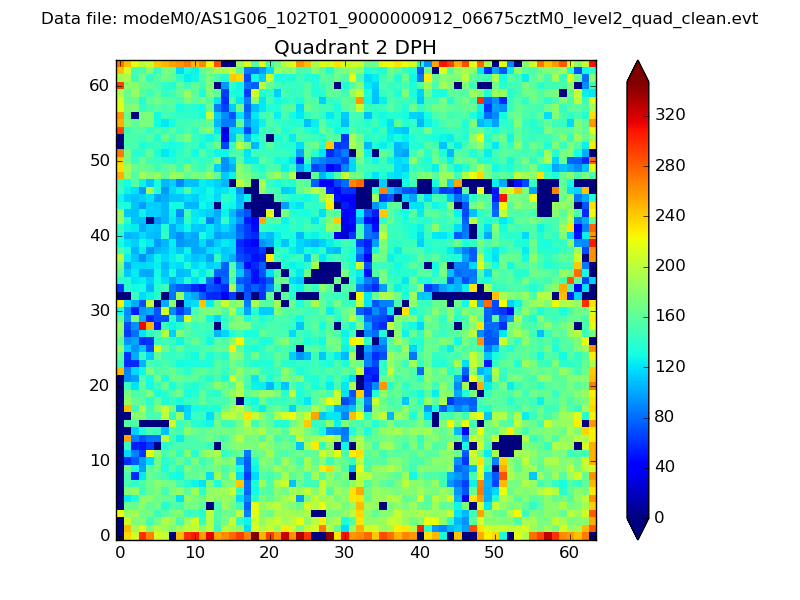 |
Quadrant C |
| Plot type | Count rate plots | Images |
|---|---|---|
| Comparison with Poisson distribution Blue bars denote a histogram of data divided into 1 sec bins. Red curve is a Poisson curve with rate = median count rate of data. |
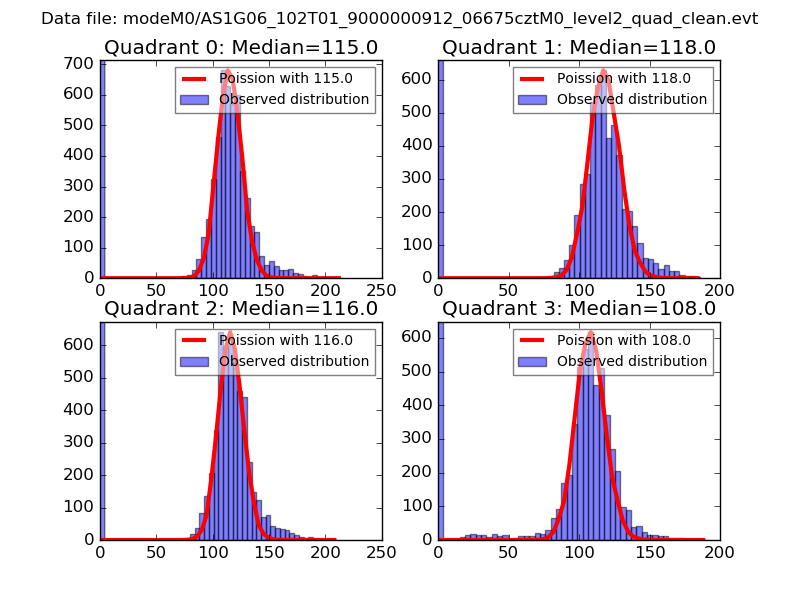 |
 |
| Quadrant-wise count rates Data is divided into 100 sec bins |
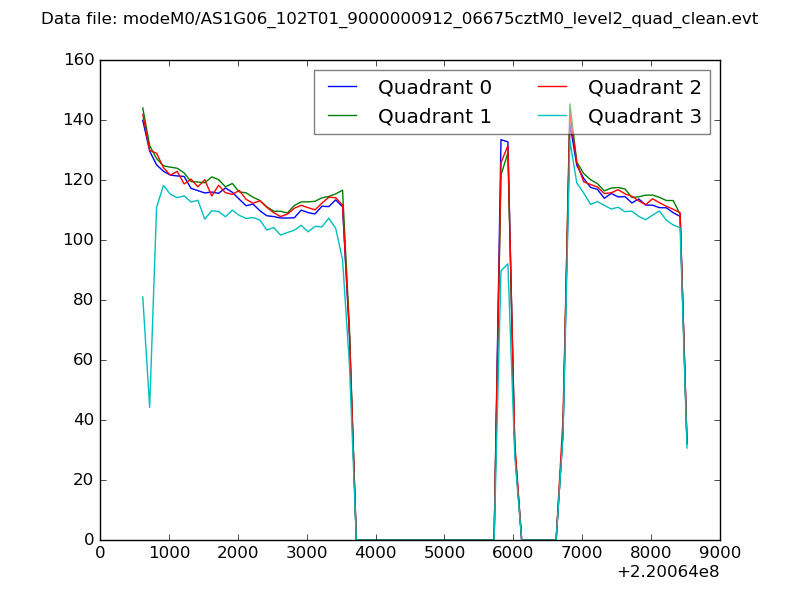 |
|
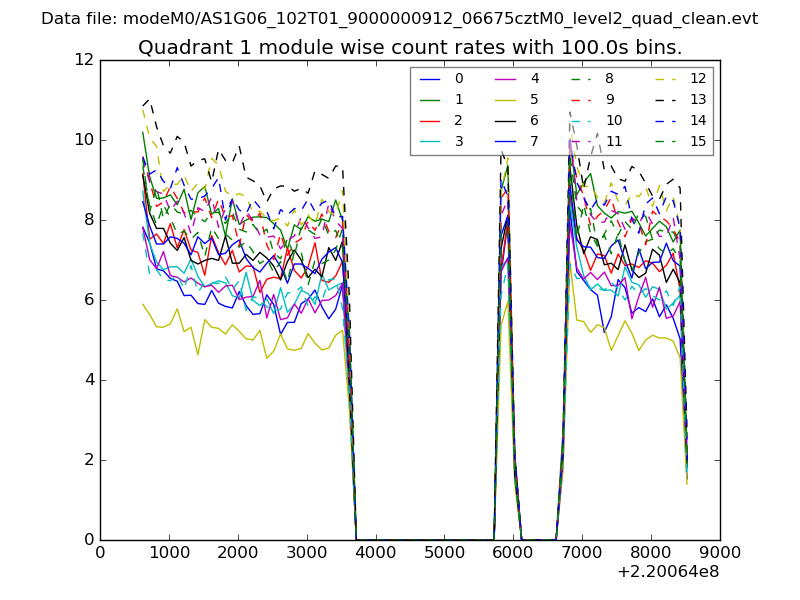
| Module-wise count rates for Quadrant A Data is divided into 100 sec bins |
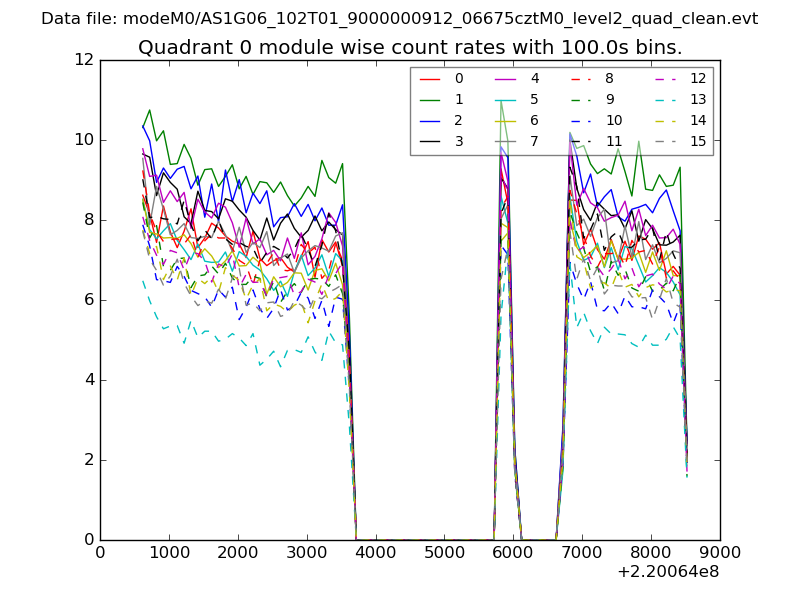 |
 |
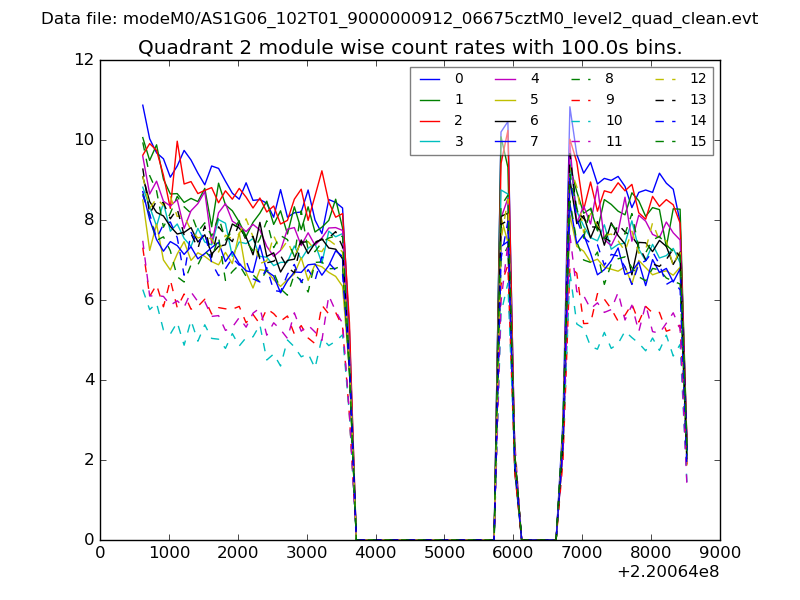
| Module-wise count rates for Quadrant B Data is divided into 100 sec bins |
 |
 |
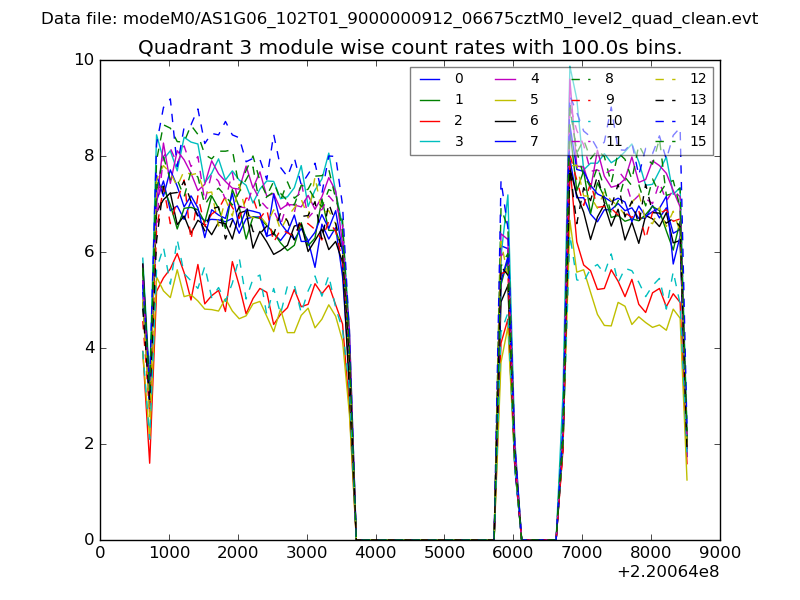
| Module-wise count rates for Quadrant C Data is divided into 100 sec bins |
 |
 |
| Module-wise count rates for Quadrant D Data is divided into 100 sec bins |
 |
 |
| Parameter | Plot |
|---|---|
| CZT HV Monitor | 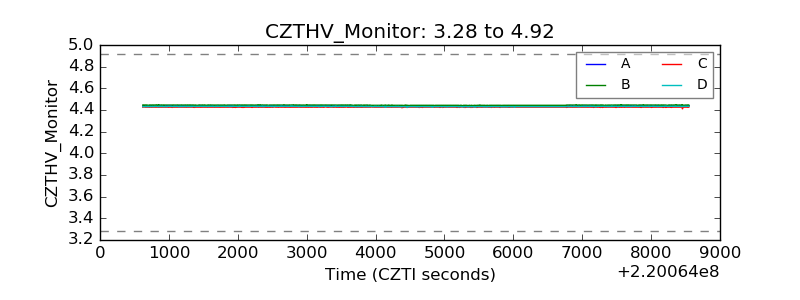 |
| D_VDD |  |
| Temperature 1 | 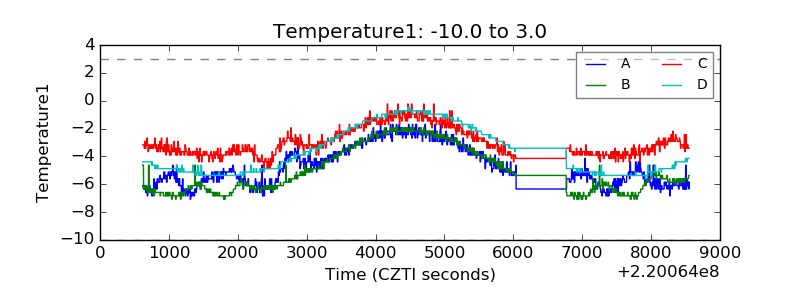 |
| Veto HV Monitor |  |
| Veto LLD | 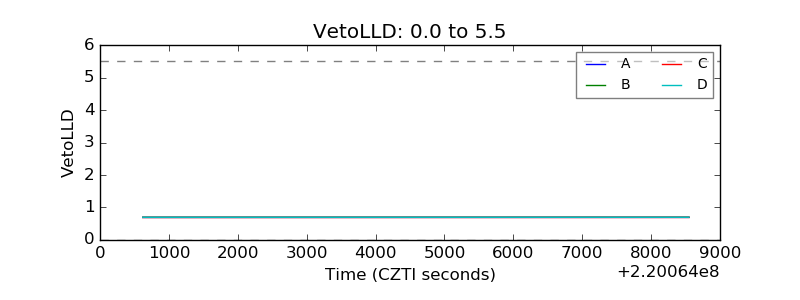 |
| Alpha Counter | 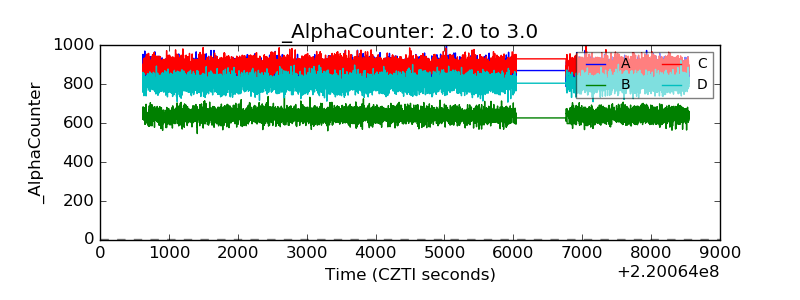 |
| _CPM_Rate | 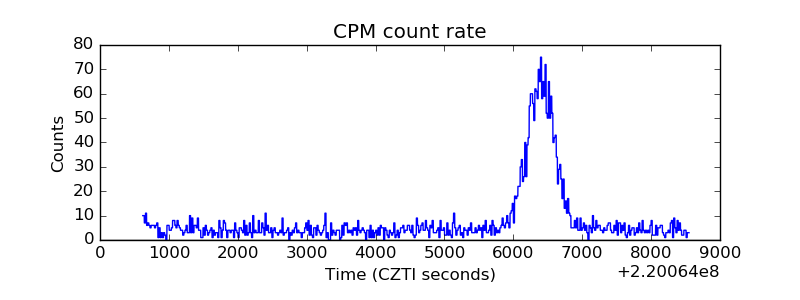 |
| CZT Counter | 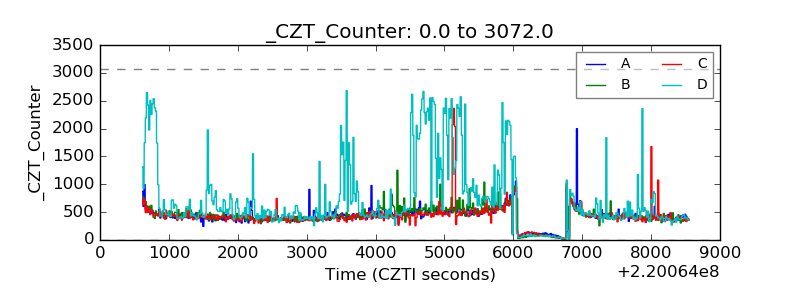 |
| +2.5 Volts monitor |  |
| +5 Volts monitor |  |
| _ROLL_ROT | 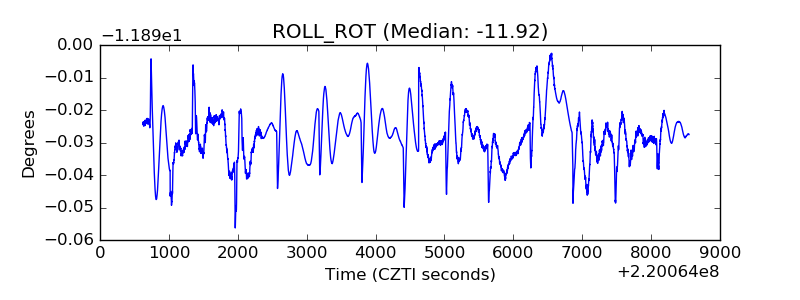 |
| _Roll_DEC | 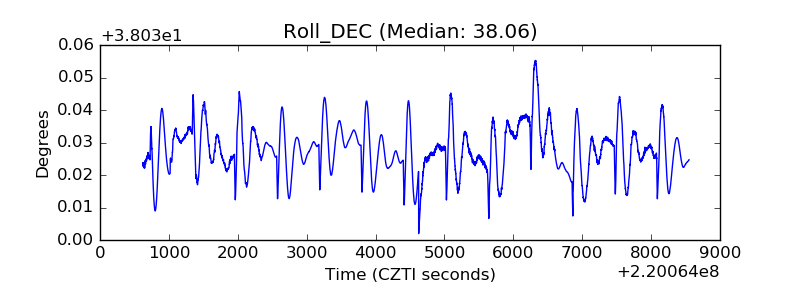 |
| _Roll_RA |  |
| Veto Counter | 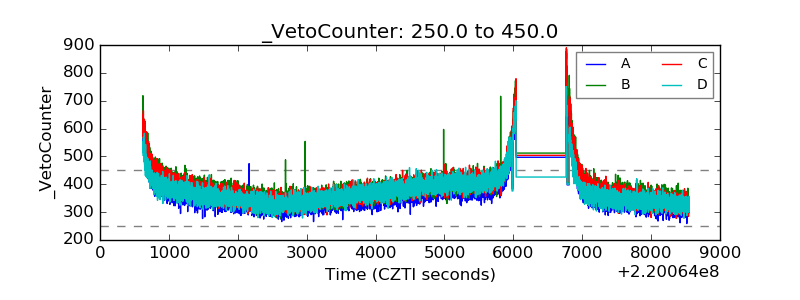 |