| Param | Original file | Final file |
|---|---|---|
| Filename | modeM0/AS1G06_102T01_9000000912_06676cztM0_level2.evt | modeM0/AS1G06_102T01_9000000912_06676cztM0_level2_quad_clean.evt |
| Size (bytes) | 615,326,400 | 103,538,880 |
| Size | 586.8 MB | 98.7 MB |
| Events in quadrant A | 4,500,845 | 657,243 |
| Events in quadrant B | 3,604,039 | 666,572 |
| Events in quadrant C | 3,551,908 | 663,286 |
| Events in quadrant D | 6,458,587 | 615,284 |
| Mode M9 | |||
|---|---|---|---|
| Quadrant | BADHDUFLAG | Total packets | Discarded packets |
| A | 0 | 3 | 0 |
| B | 0 | 3 | 0 |
| C | 0 | 3 | 0 |
| D | 0 | 4 | 0 |
| Mode SS | |||
|---|---|---|---|
| Quadrant | BADHDUFLAG | Total packets | Discarded packets |
| A | 0 | 158 | 0 |
| B | 0 | 158 | 0 |
| C | 0 | 158 | 0 |
| D | 0 | 158 | 0 |
| Mode M0 | |||
|---|---|---|---|
| Quadrant | BADHDUFLAG | Total packets | Discarded packets |
| A | 0 | 18893 | 3 |
| B | 0 | 16038 | 2 |
| C | 0 | 16254 | 2 |
| D | 0 | 24751 | 2 |
| Quadrant | Total seconds | Saturated seconds | Saturation percentage |
|---|---|---|---|
| A | 7659 | 223 | 2.911607% |
| B | 7659 | 135 | 1.762632% |
| C | 7659 | 85 | 1.109805% |
| D | 7659 | 1228 | 16.033425% |
Noise dominated data is calculated using 1-second bins in cleaned event files. If a bin has >2000 counts, and if more than 50% of those come from <1% of pixels, then it is considered to be noise-dominated and hence unusable.
| Quadrant | # 1 sec bins | Bins with >0 counts | Bins with >2000 counts | High rate bins dominated by noise | Noise dominated (total time) | Noise dominated (detector-on time) | Marked lightcurve |
|---|---|---|---|---|---|---|---|
| A | 7969 | 7661 | 8 | 8 | 0.10% | 0.10% | 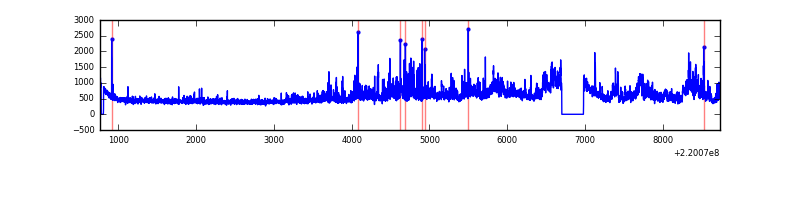 |
| B | 7969 | 7661 | 1 | 1 | 0.01% | 0.01% | 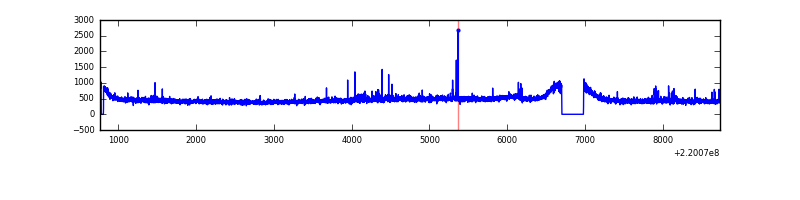 |
| C | 7969 | 7661 | 16 | 16 | 0.20% | 0.21% | 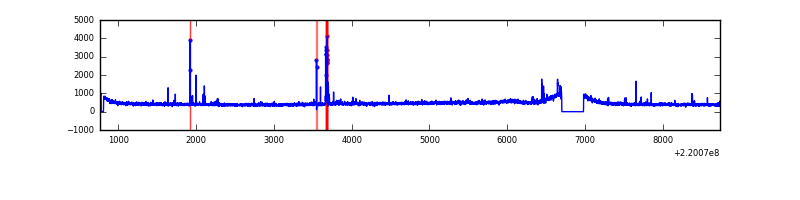 |
| D | 7969 | 7661 | 925 | 925 | 11.61% | 12.07% | 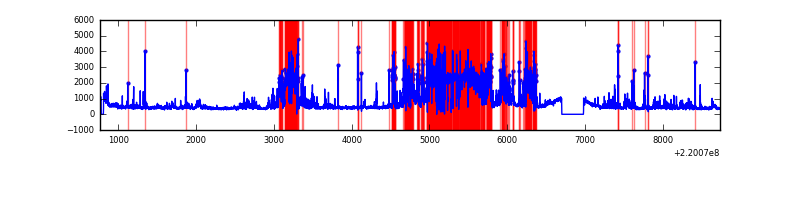 |
Top three noisy pixels from each quadrant. If the there are fewer than three noisy pixels in the level2.evt file, extra rows are filled as -1
| Pixel properties | Quadrant properties | ||||||
|---|---|---|---|---|---|---|---|
| Quadrant | DetID | PixID | Counts | Sigma | Mean | Median | Sigma |
| A | 13 | 251 | 650370 | 3535.84 | 889 | 866 | 183.7 |
| A | 8 | 15 | 290495 | 1576.71 | 889 | 866 | 183.7 |
| A | 0 | 23 | 79036 | 425.55 | 889 | 866 | 183.7 |
| B | 4 | 81 | 45593 | 258.68 | 901 | 878 | 172.9 |
| B | 0 | 214 | 34325 | 193.5 | 901 | 878 | 172.9 |
| B | 12 | 111 | 17772 | 97.73 | 901 | 878 | 172.9 |
| C | 9 | 247 | 171745 | 848.57 | 865 | 865 | 201.4 |
| C | 13 | 61 | 6835 | 29.65 | 865 | 865 | 201.4 |
| C | 1 | 3 | 5683 | 23.93 | 865 | 865 | 201.4 |
| D | 2 | 33 | 2902345 | 14968.8 | 781 | 756 | 193.8 |
| D | 2 | 152 | 229095 | 1177.96 | 781 | 756 | 193.8 |
| D | 6 | 112 | 219572 | 1128.83 | 781 | 756 | 193.8 |
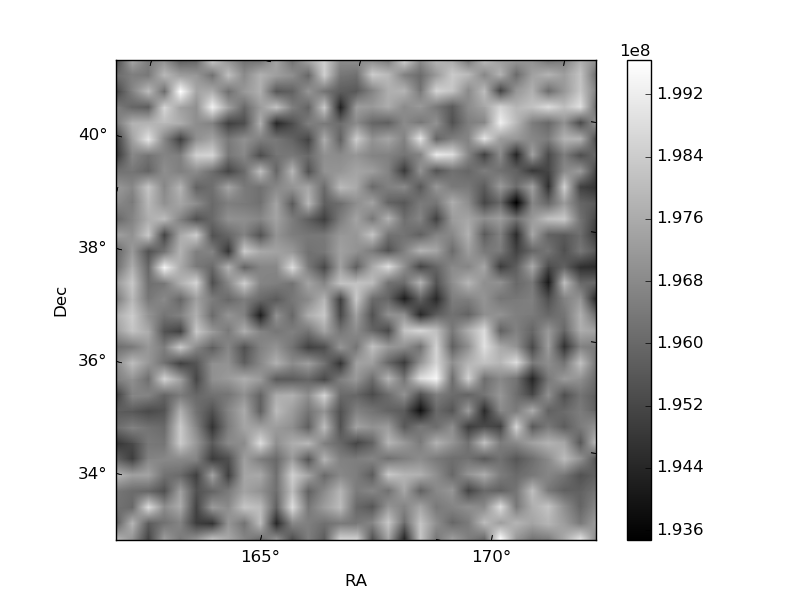
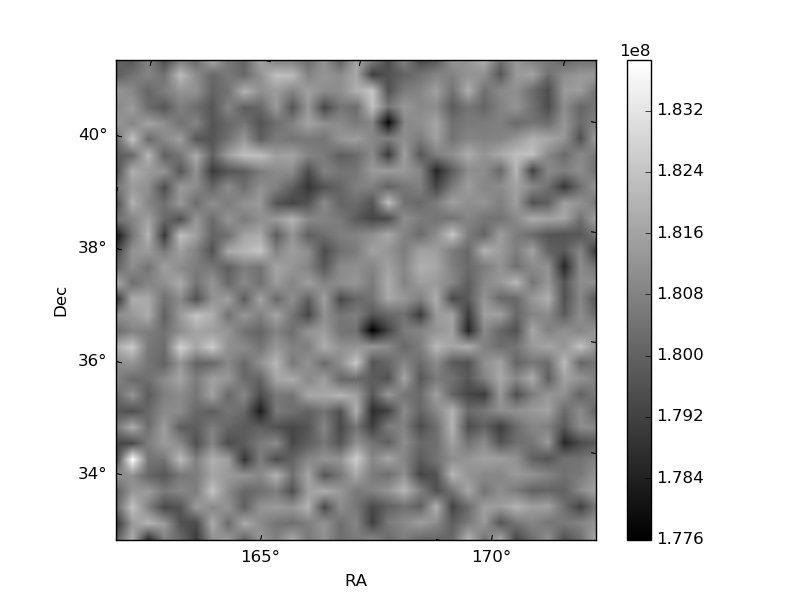
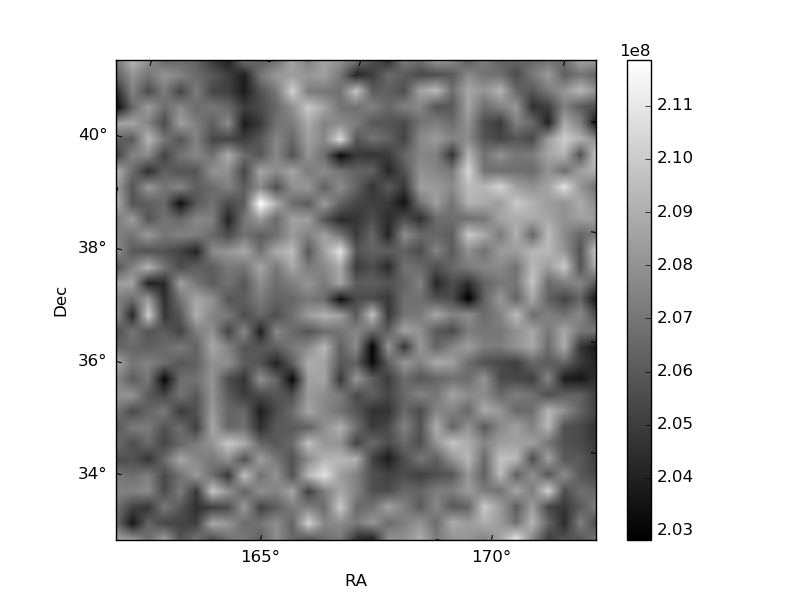
Histogram calculated using DETX and DETY for each event in the final _common_clean file
| Quadrant A |  |
 |
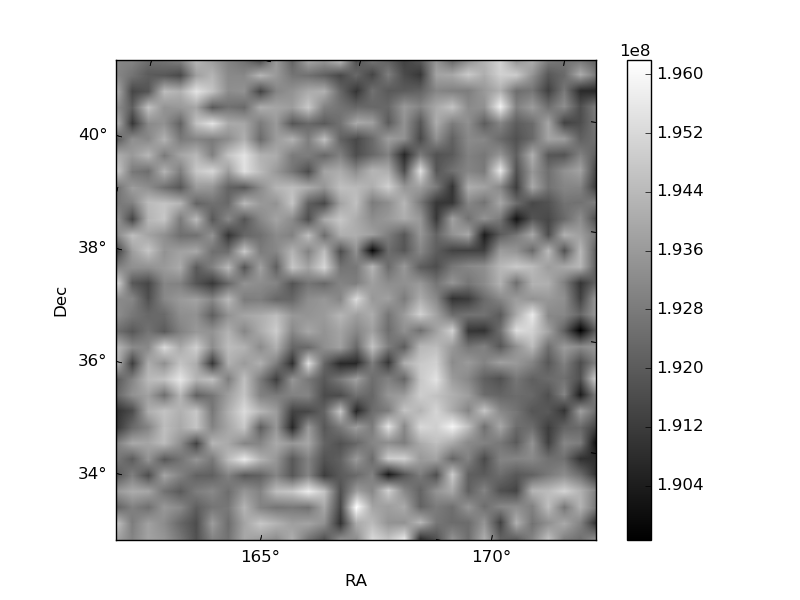
Quadrant B |
|---|---|---|---|
| Quadrant D | 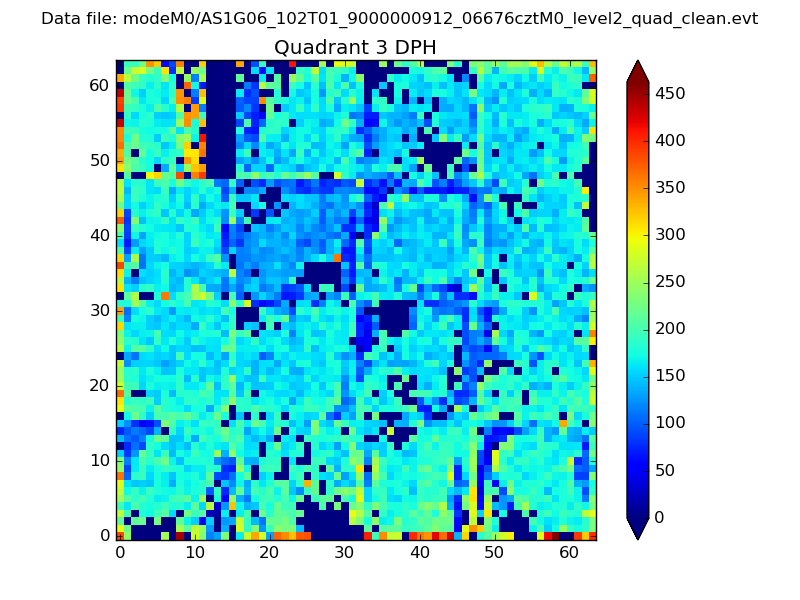 |
 |
Quadrant C |
| Plot type | Count rate plots | Images |
|---|---|---|
| Comparison with Poisson distribution Blue bars denote a histogram of data divided into 1 sec bins. Red curve is a Poisson curve with rate = median count rate of data. |
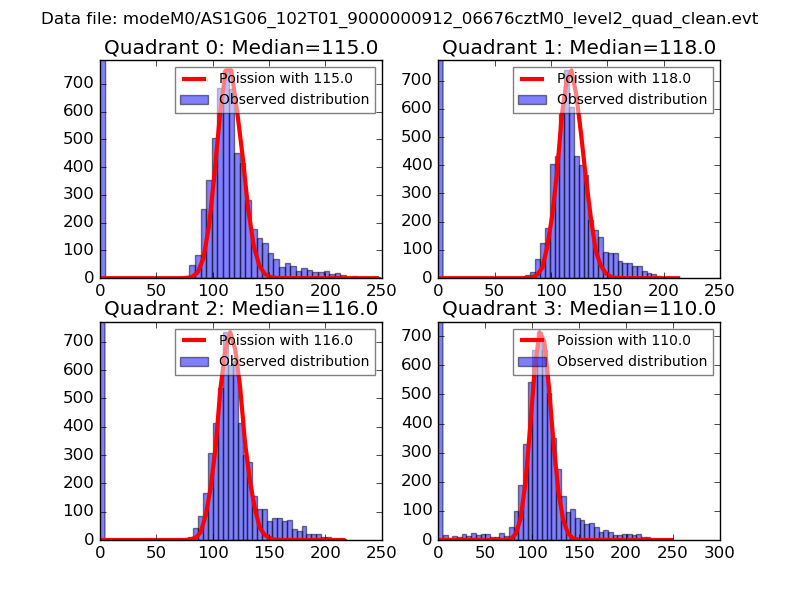 |
 |
| Quadrant-wise count rates Data is divided into 100 sec bins |
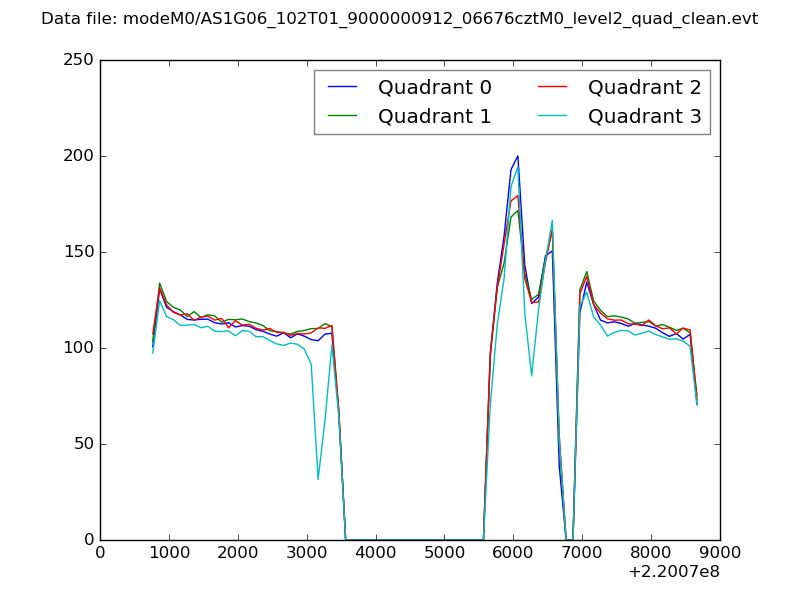 |
|
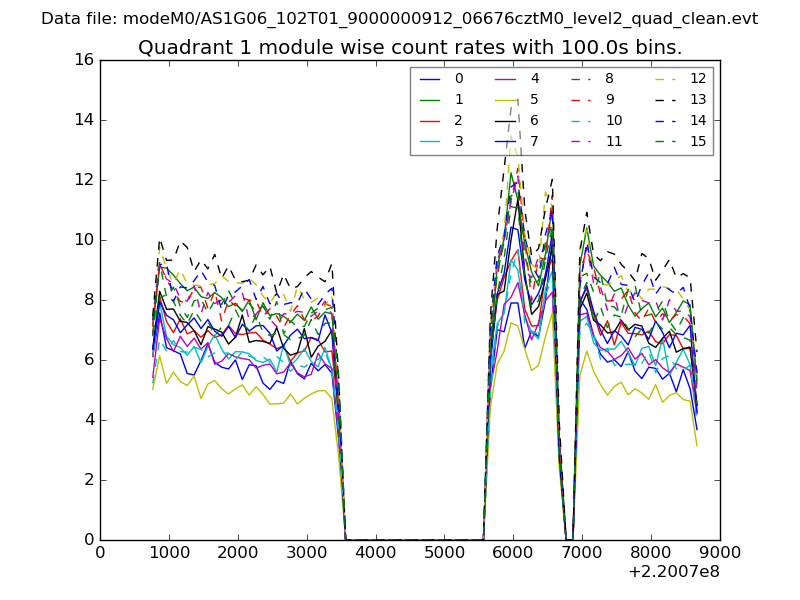
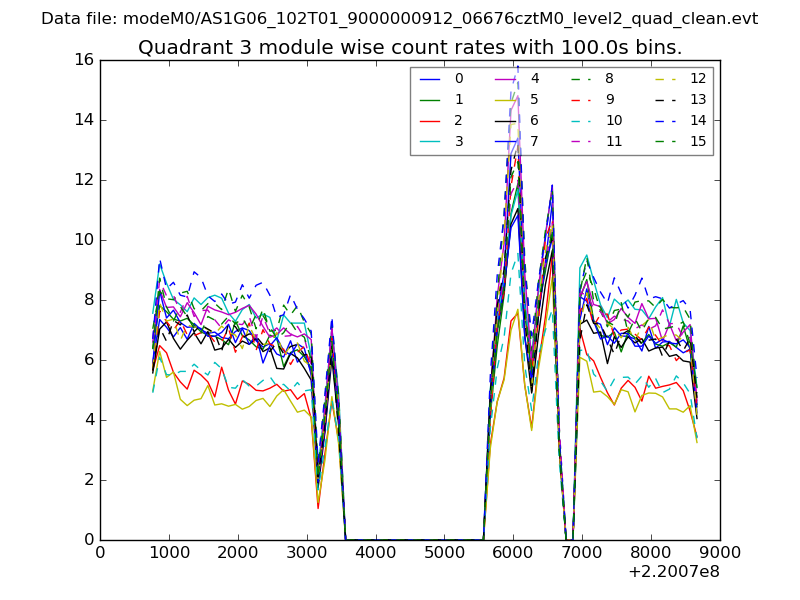
| Module-wise count rates for Quadrant A Data is divided into 100 sec bins |
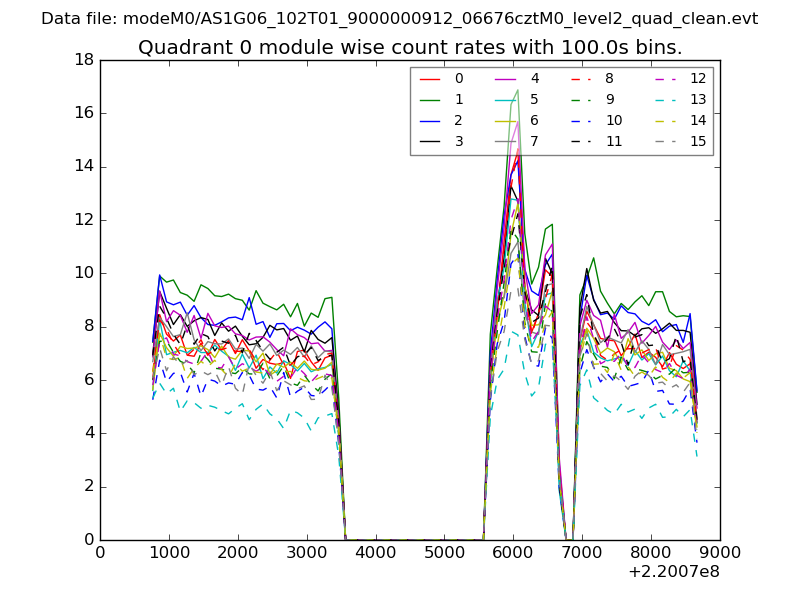 |
 |
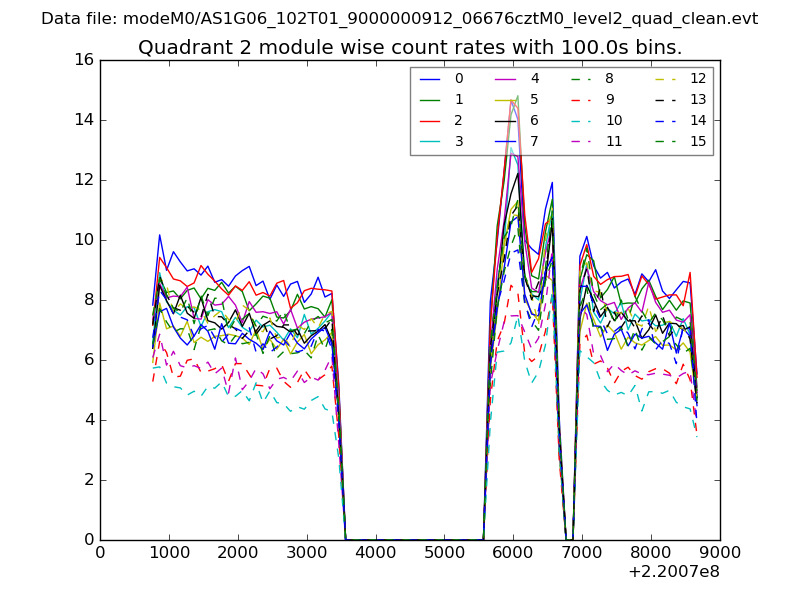
| Module-wise count rates for Quadrant B Data is divided into 100 sec bins |
 |
 |
| Module-wise count rates for Quadrant C Data is divided into 100 sec bins |
 |
 |
| Module-wise count rates for Quadrant D Data is divided into 100 sec bins |
 |
 |
| Parameter | Plot |
|---|---|
| CZT HV Monitor | 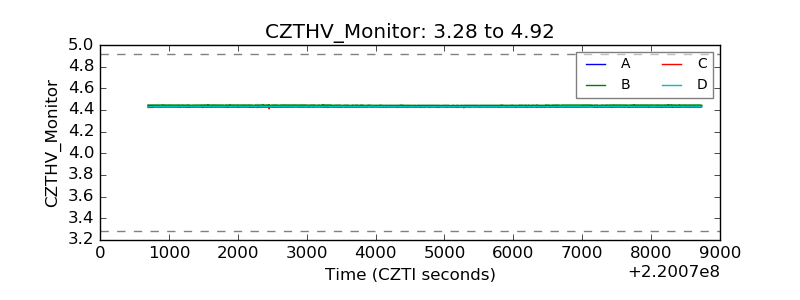 |
| D_VDD | 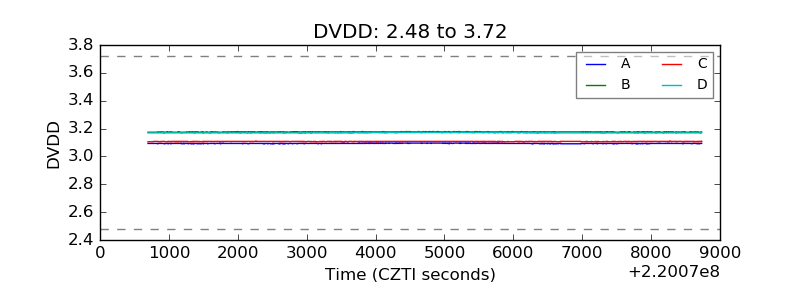 |
| Temperature 1 | 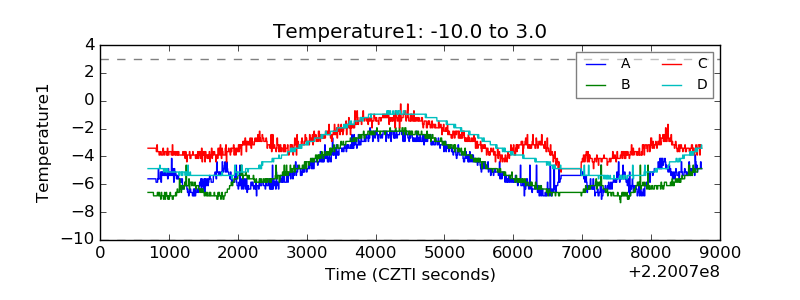 |
| Veto HV Monitor | 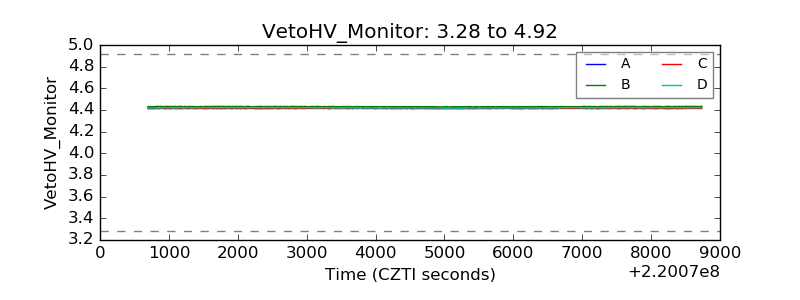 |
| Veto LLD | 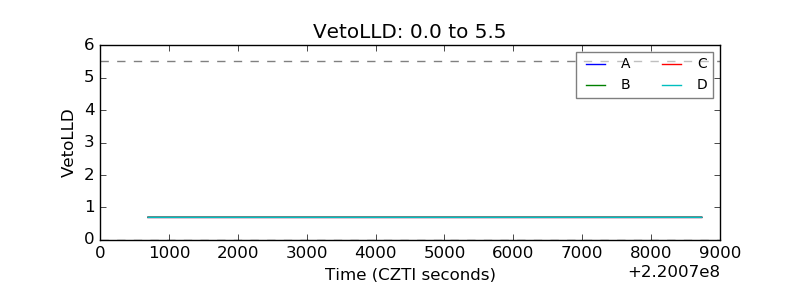 |
| Alpha Counter | 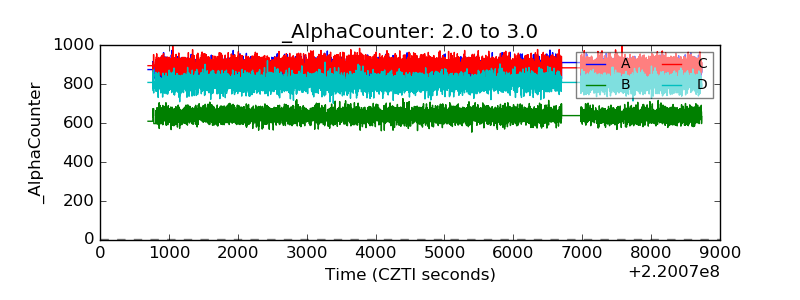 |
| _CPM_Rate | 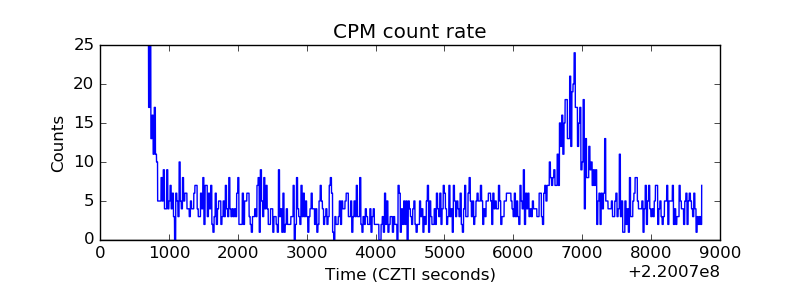 |
| CZT Counter | 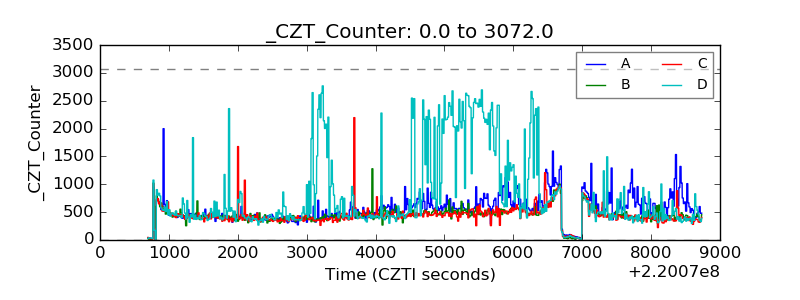 |
| +2.5 Volts monitor |  |
| +5 Volts monitor | 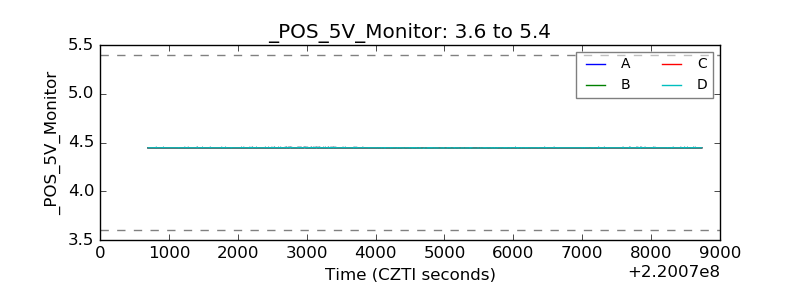 |
| _ROLL_ROT | 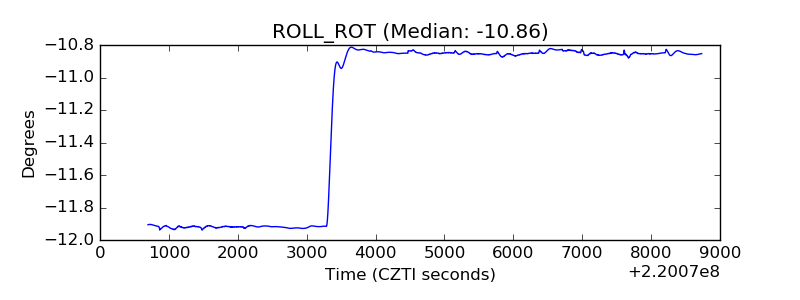 |
| _Roll_DEC | 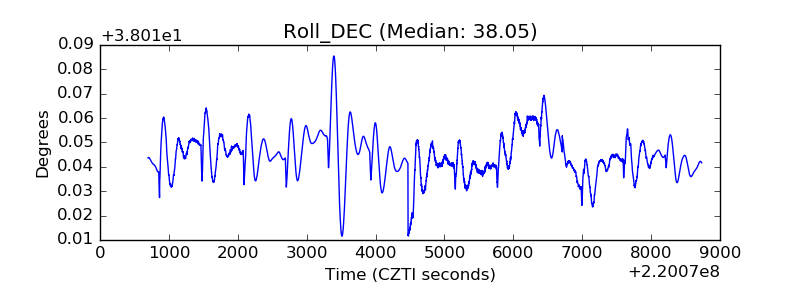 |
| _Roll_RA |  |
| Veto Counter | 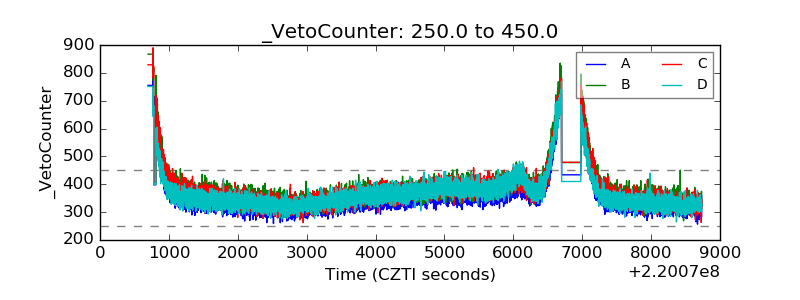 |