| Param | Original file | Final file |
|---|---|---|
| Filename | modeM0/AS1G06_102T01_9000000912_06678cztM0_level2.evt | modeM0/AS1G06_102T01_9000000912_06678cztM0_level2_quad_clean.evt |
| Size (bytes) | 590,901,120 | 90,855,360 |
| Size | 563.5 MB | 86.6 MB |
| Events in quadrant A | 5,348,997 | 562,771 |
| Events in quadrant B | 3,779,231 | 580,856 |
| Events in quadrant C | 3,099,180 | 573,921 |
| Events in quadrant D | 5,182,967 | 535,261 |
| Mode M9 | |||
|---|---|---|---|
| Quadrant | BADHDUFLAG | Total packets | Discarded packets |
| A | 0 | 3 | 0 |
| B | 0 | 3 | 0 |
| C | 0 | 3 | 0 |
| D | 0 | 3 | 0 |
| Mode SS | |||
|---|---|---|---|
| Quadrant | BADHDUFLAG | Total packets | Discarded packets |
| A | 0 | 144 | 0 |
| B | 0 | 144 | 0 |
| C | 0 | 144 | 0 |
| D | 0 | 144 | 0 |
| Mode M0 | |||
|---|---|---|---|
| Quadrant | BADHDUFLAG | Total packets | Discarded packets |
| A | 0 | 20882 | 1 |
| B | 0 | 16136 | 0 |
| C | 0 | 14550 | 0 |
| D | 0 | 20699 | 0 |
| Quadrant | Total seconds | Saturated seconds | Saturation percentage |
|---|---|---|---|
| A | 7158 | 352 | 4.917575% |
| B | 7158 | 256 | 3.576418% |
| C | 7158 | 90 | 1.257334% |
| D | 7158 | 809 | 11.302040% |
Noise dominated data is calculated using 1-second bins in cleaned event files. If a bin has >2000 counts, and if more than 50% of those come from <1% of pixels, then it is considered to be noise-dominated and hence unusable.
| Quadrant | # 1 sec bins | Bins with >0 counts | Bins with >2000 counts | High rate bins dominated by noise | Noise dominated (total time) | Noise dominated (detector-on time) | Marked lightcurve |
|---|---|---|---|---|---|---|---|
| A | 7413 | 7159 | 39 | 39 | 0.53% | 0.54% | 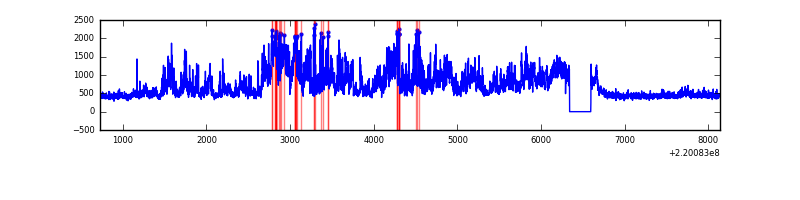 |
| B | 7413 | 7159 | 75 | 75 | 1.01% | 1.05% | 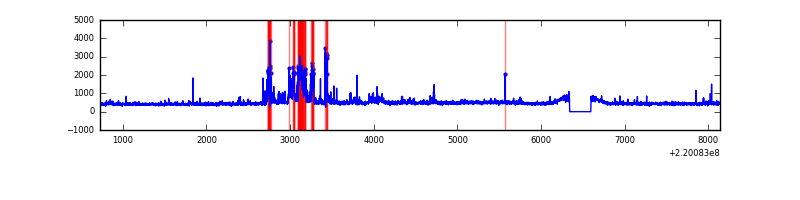 |
| C | 7413 | 7159 | 0 | 0 | 0.00% | 0.00% | 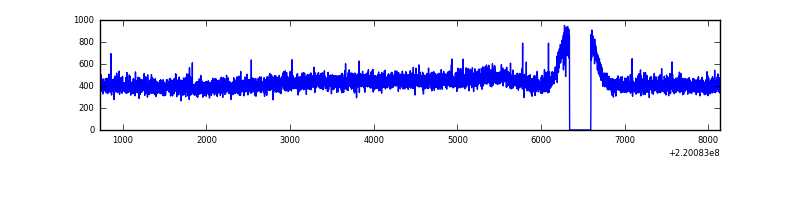 |
| D | 7413 | 7159 | 542 | 542 | 7.31% | 7.57% | 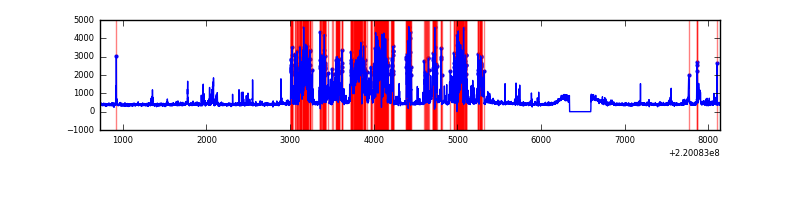 |
Top three noisy pixels from each quadrant. If the there are fewer than three noisy pixels in the level2.evt file, extra rows are filled as -1
| Pixel properties | Quadrant properties | ||||||
|---|---|---|---|---|---|---|---|
| Quadrant | DetID | PixID | Counts | Sigma | Mean | Median | Sigma |
| A | 13 | 251 | 2074050 | 12517.9 | 807 | 787 | 165.6 |
| A | 8 | 15 | 107414 | 643.79 | 807 | 787 | 165.6 |
| A | 4 | 2 | 48064 | 285.44 | 807 | 787 | 165.6 |
| B | 0 | 228 | 372145 | 2359.9 | 816 | 796 | 157.4 |
| B | 4 | 48 | 79614 | 500.88 | 816 | 796 | 157.4 |
| B | 0 | 219 | 57536 | 360.58 | 816 | 796 | 157.4 |
| C | 8 | 128 | 11174 | 56.57 | 788 | 791 | 183.6 |
| C | 8 | 112 | 6556 | 31.41 | 788 | 791 | 183.6 |
| C | 13 | 61 | 6396 | 30.54 | 788 | 791 | 183.6 |
| D | 2 | 33 | 2158403 | 11611.05 | 753 | 729 | 185.8 |
| D | 8 | 195 | 46474 | 246.16 | 753 | 729 | 185.8 |
| D | 14 | 34 | 28894 | 151.56 | 753 | 729 | 185.8 |
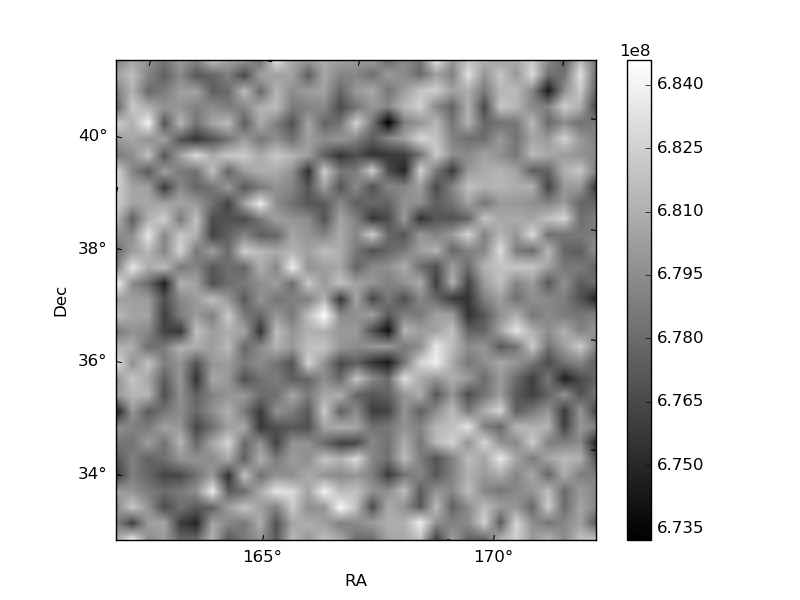
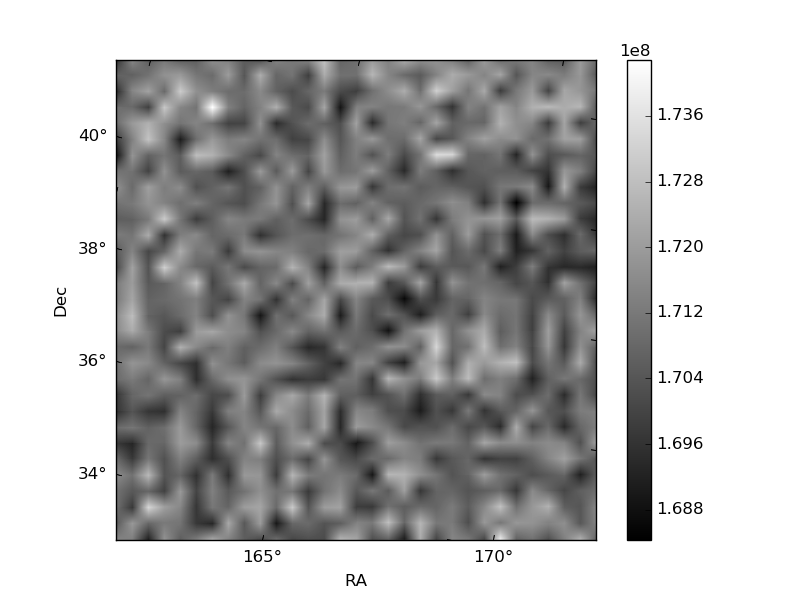
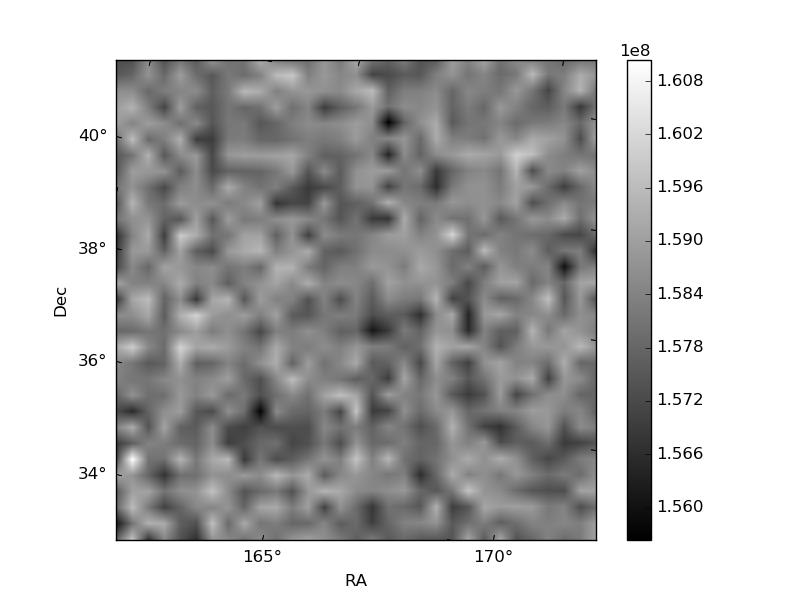
Histogram calculated using DETX and DETY for each event in the final _common_clean file
| Quadrant A | 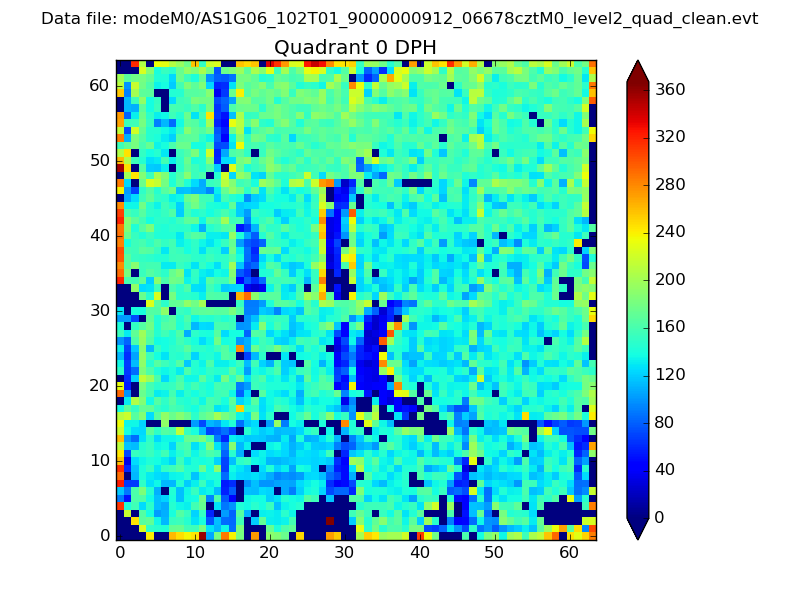 |
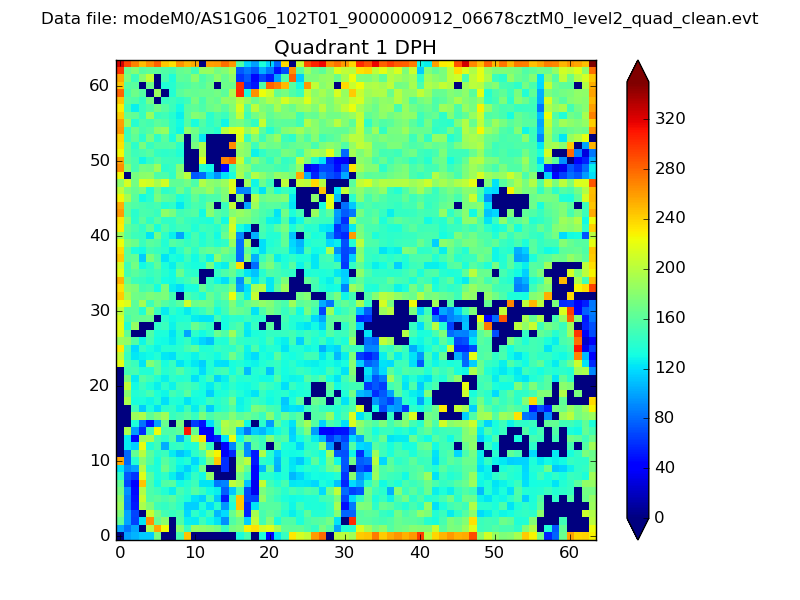 |
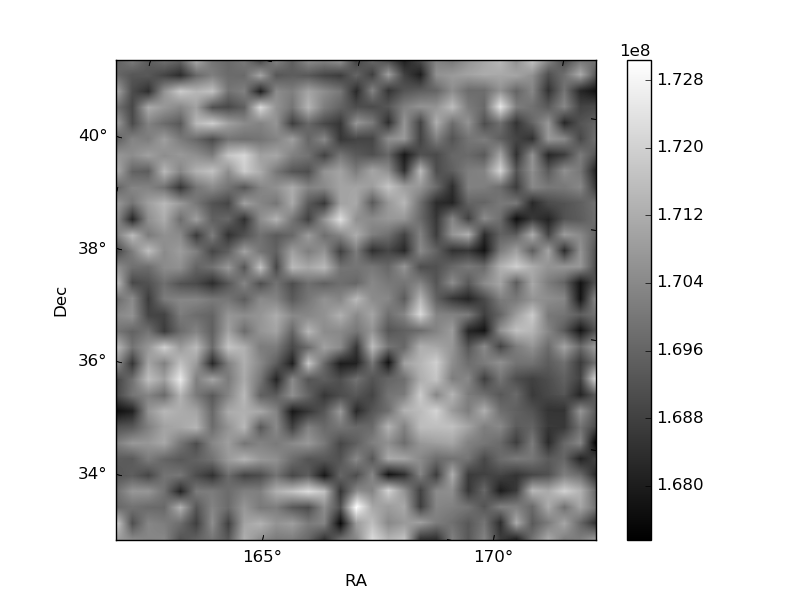
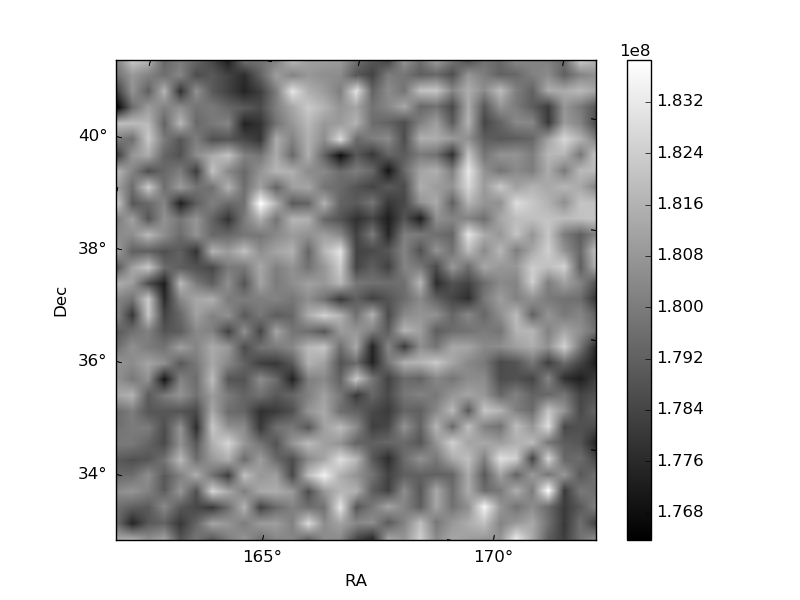
Quadrant B |
|---|---|---|---|
| Quadrant D | 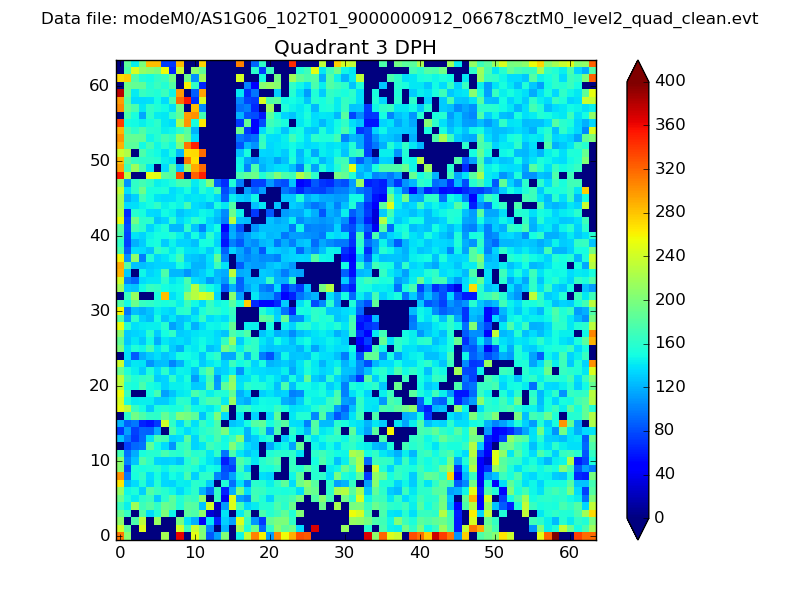 |
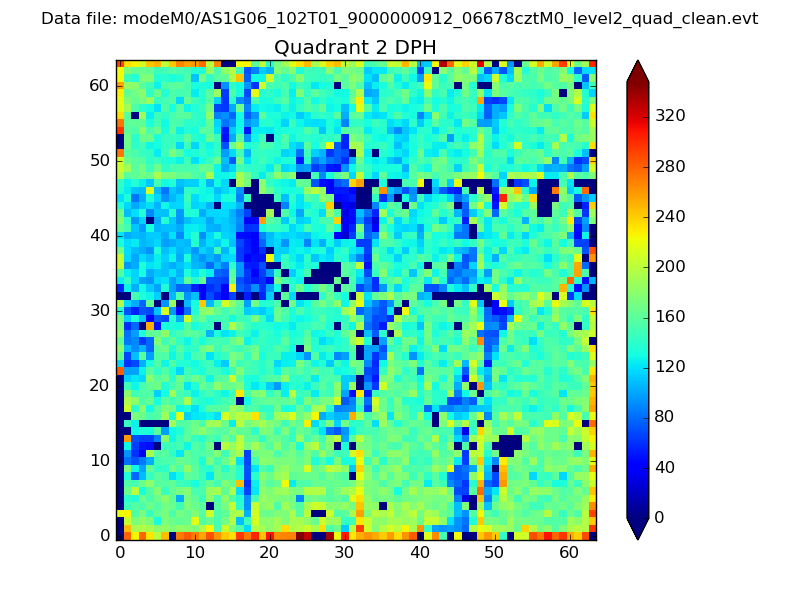 |
Quadrant C |
| Plot type | Count rate plots | Images |
|---|---|---|
| Comparison with Poisson distribution Blue bars denote a histogram of data divided into 1 sec bins. Red curve is a Poisson curve with rate = median count rate of data. |
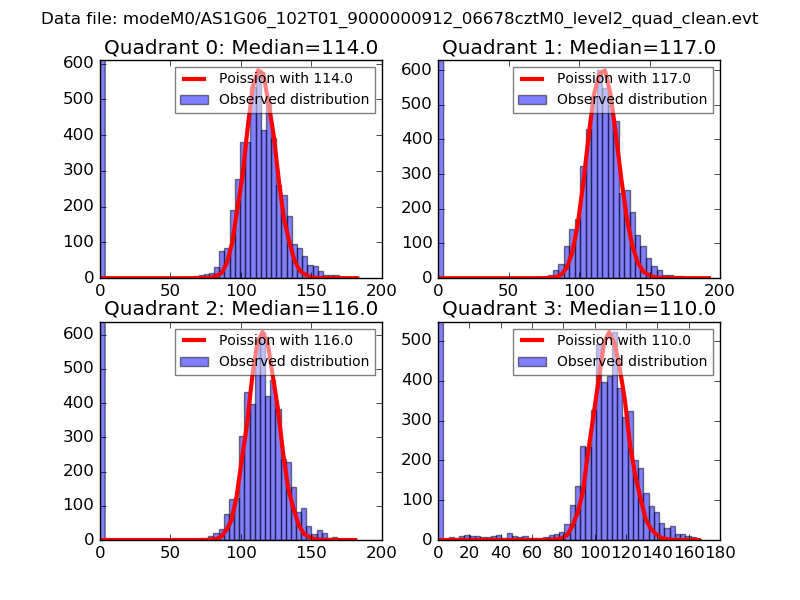 |
 |
| Quadrant-wise count rates Data is divided into 100 sec bins |
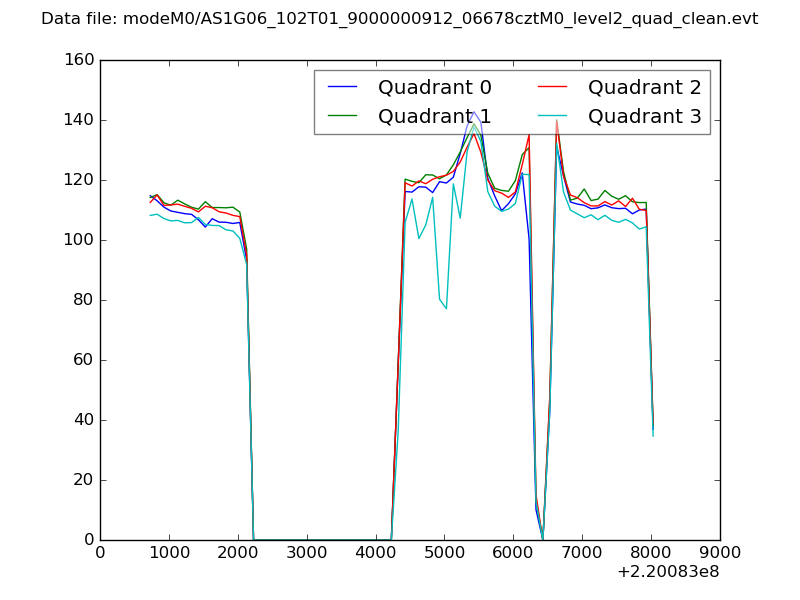 |
|
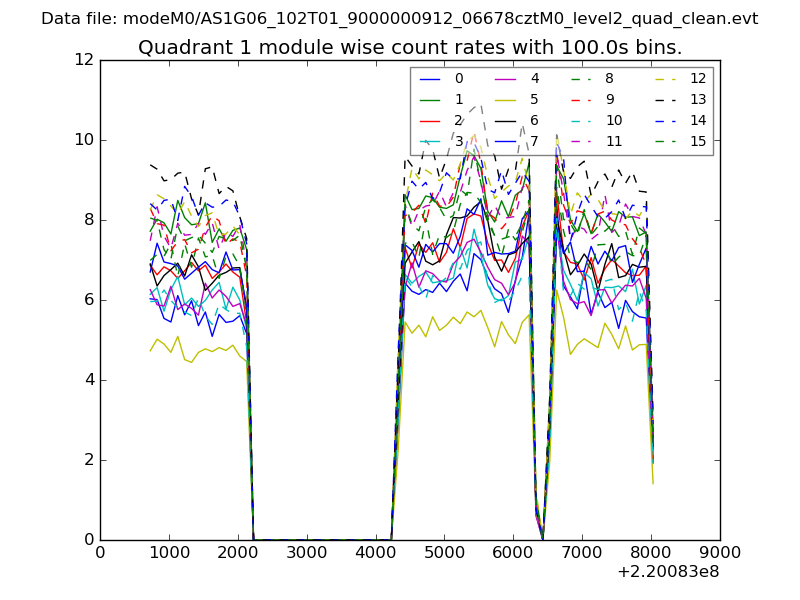
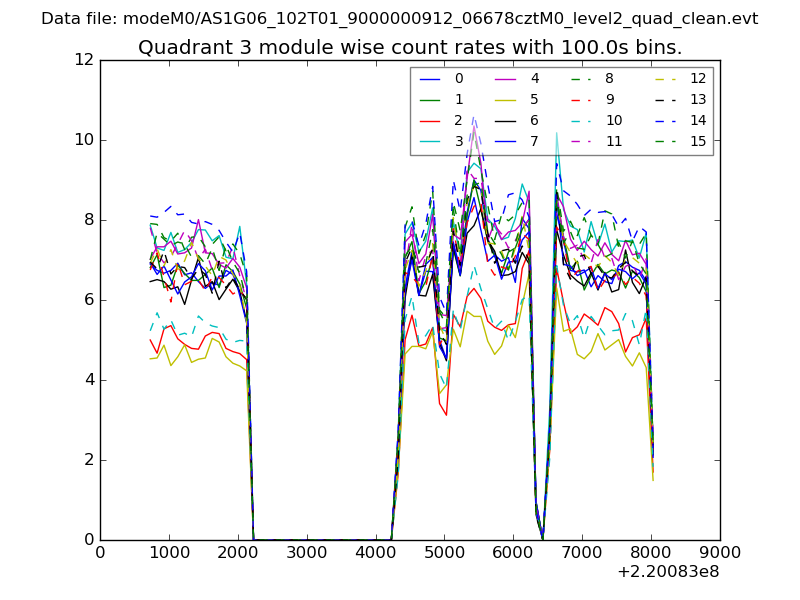
| Module-wise count rates for Quadrant A Data is divided into 100 sec bins |
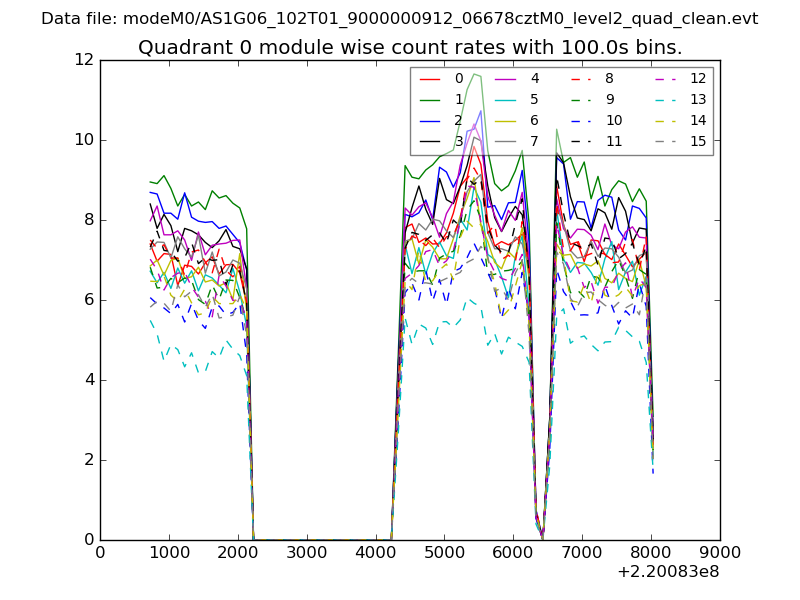 |
 |
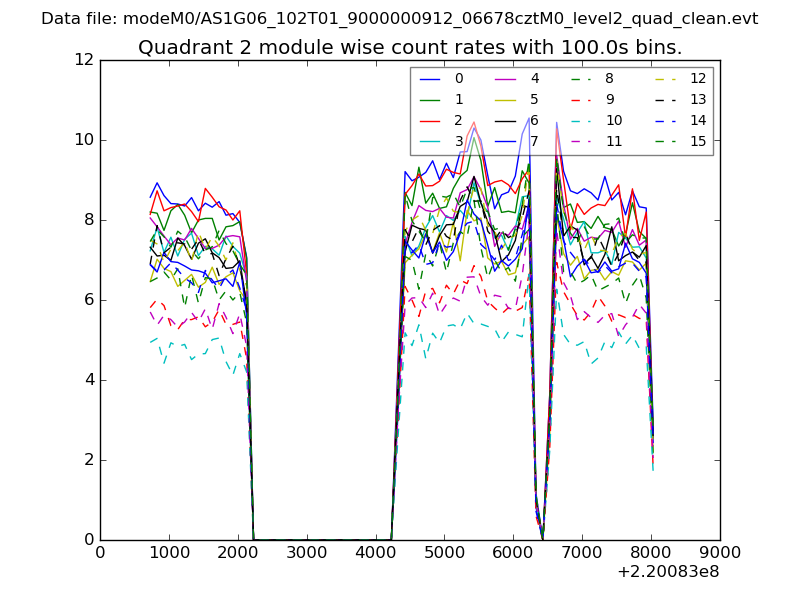
| Module-wise count rates for Quadrant B Data is divided into 100 sec bins |
 |
 |
| Module-wise count rates for Quadrant C Data is divided into 100 sec bins |
 |
 |
| Module-wise count rates for Quadrant D Data is divided into 100 sec bins |
 |
 |
| Parameter | Plot |
|---|---|
| CZT HV Monitor | 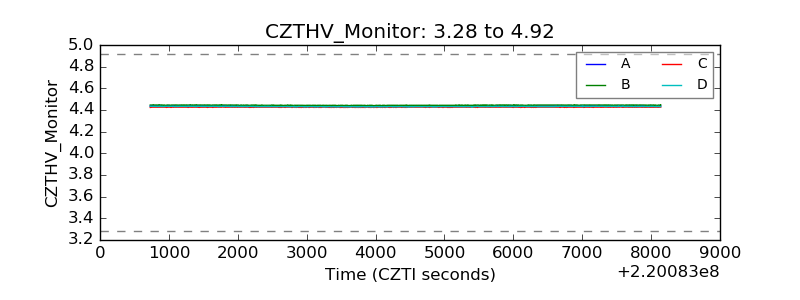 |
| D_VDD | 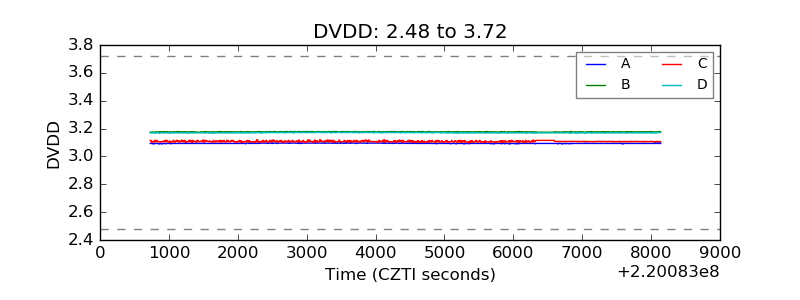 |
| Temperature 1 | 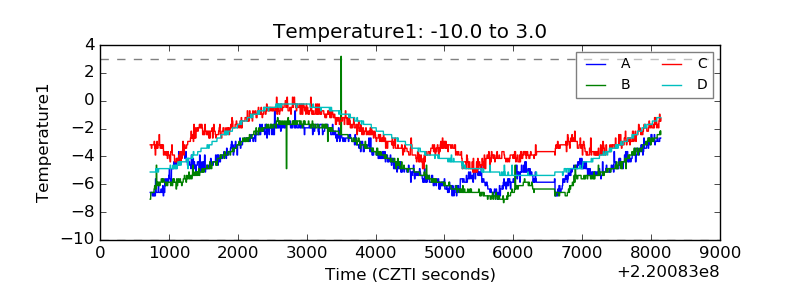 |
| Veto HV Monitor | 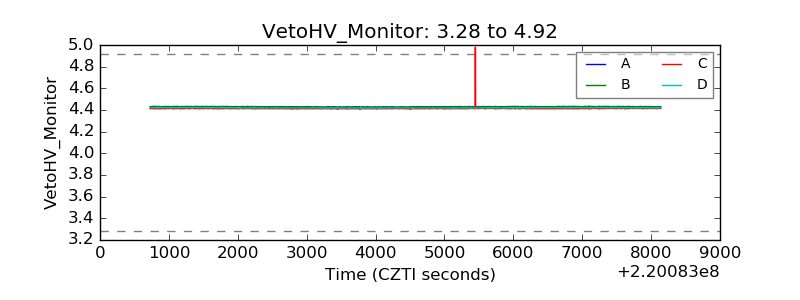 |
| Veto LLD | 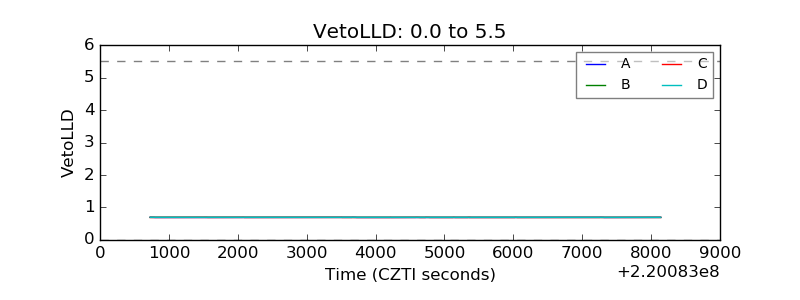 |
| Alpha Counter | 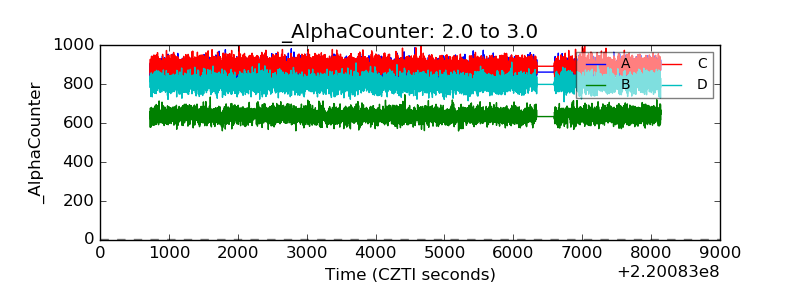 |
| _CPM_Rate | 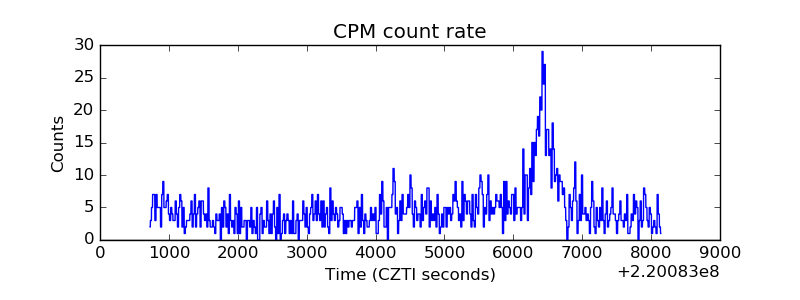 |
| CZT Counter | 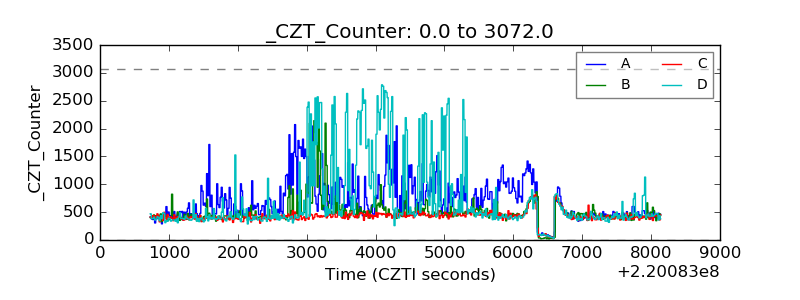 |
| +2.5 Volts monitor |  |
| +5 Volts monitor |  |
| _ROLL_ROT | 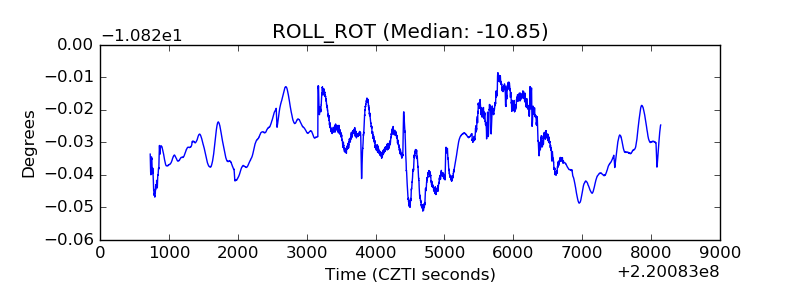 |
| _Roll_DEC | 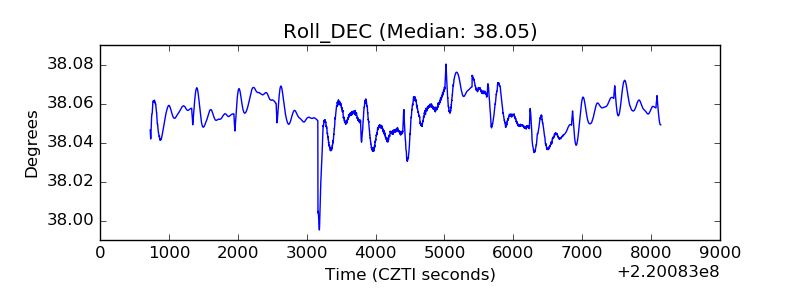 |
| _Roll_RA | 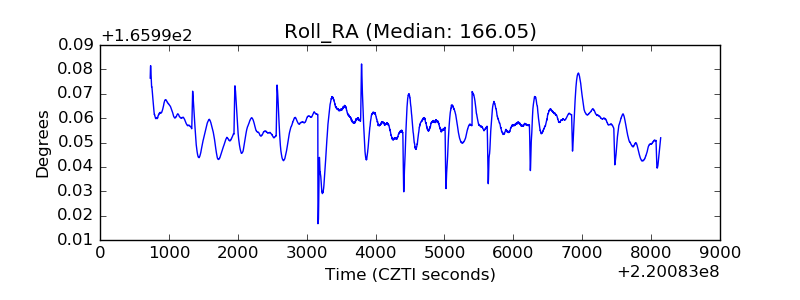 |
| Veto Counter | 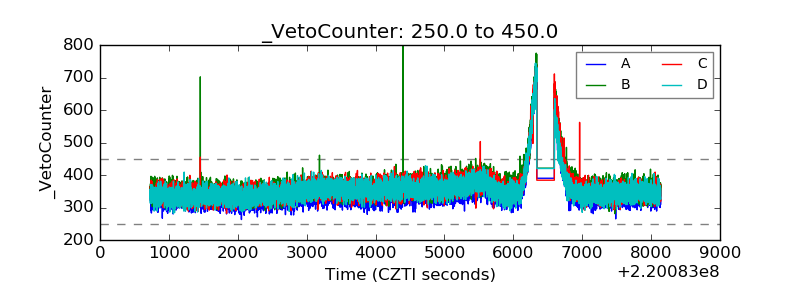 |