| Param | Original file | Final file |
|---|---|---|
| Filename | modeM0/AS1G06_102T01_9000000912_06682cztM0_level2.evt | modeM0/AS1G06_102T01_9000000912_06682cztM0_level2_quad_clean.evt |
| Size (bytes) | 1,992,173,760 | 238,144,320 |
| Size | 1.9 GB | 227.1 MB |
| Events in quadrant A | 12,004,619 | 1,451,928 |
| Events in quadrant B | 11,534,867 | 1,459,400 |
| Events in quadrant C | 9,971,901 | 1,451,523 |
| Events in quadrant D | 25,327,176 | 1,322,045 |
| Mode M9 | |||
|---|---|---|---|
| Quadrant | BADHDUFLAG | Total packets | Discarded packets |
| A | 0 | 30 | 0 |
| B | 0 | 30 | 0 |
| C | 0 | 30 | 0 |
| D | 0 | 30 | 0 |
| Mode SS | |||
|---|---|---|---|
| Quadrant | BADHDUFLAG | Total packets | Discarded packets |
| A | 0 | 450 | 0 |
| B | 0 | 450 | 0 |
| C | 0 | 450 | 0 |
| D | 0 | 450 | 0 |
| Mode M0 | |||
|---|---|---|---|
| Quadrant | BADHDUFLAG | Total packets | Discarded packets |
| A | 0 | 50532 | 5 |
| B | 0 | 49085 | 4 |
| C | 0 | 45404 | 4 |
| D | 0 | 90669 | 4 |
| Quadrant | Total seconds | Saturated seconds | Saturation percentage |
|---|---|---|---|
| A | 22185 | 558 | 2.515213% |
| B | 22185 | 396 | 1.784990% |
| C | 22185 | 233 | 1.050259% |
| D | 22185 | 4415 | 19.900834% |
Noise dominated data is calculated using 1-second bins in cleaned event files. If a bin has >2000 counts, and if more than 50% of those come from <1% of pixels, then it is considered to be noise-dominated and hence unusable.
| Quadrant | # 1 sec bins | Bins with >0 counts | Bins with >2000 counts | High rate bins dominated by noise | Noise dominated (total time) | Noise dominated (detector-on time) | Marked lightcurve |
|---|---|---|---|---|---|---|---|
| A | 25135 | 22189 | 174 | 174 | 0.69% | 0.78% | 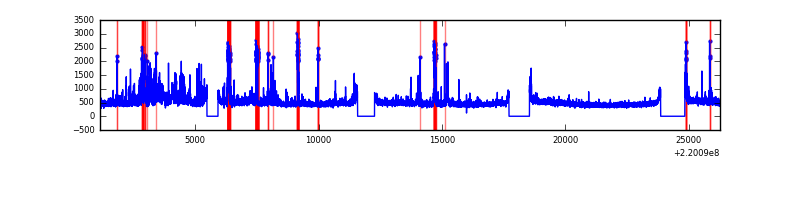 |
| B | 25135 | 22189 | 61 | 61 | 0.24% | 0.27% | 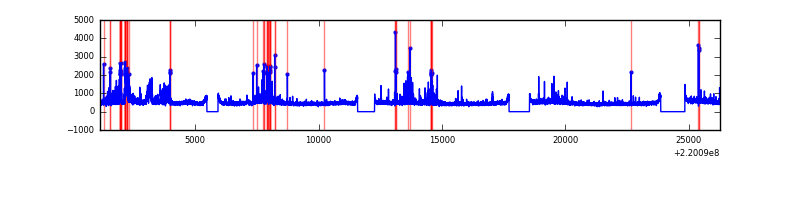 |
| C | 25135 | 22189 | 10 | 10 | 0.04% | 0.05% | 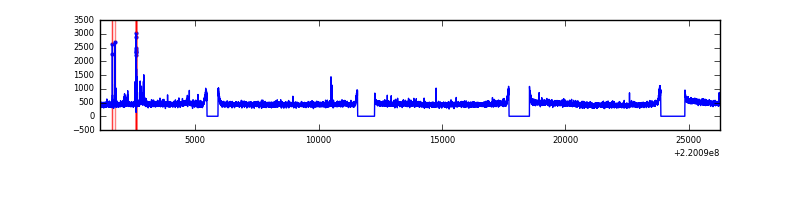 |
| D | 25135 | 22189 | 3404 | 3404 | 13.54% | 15.34% | 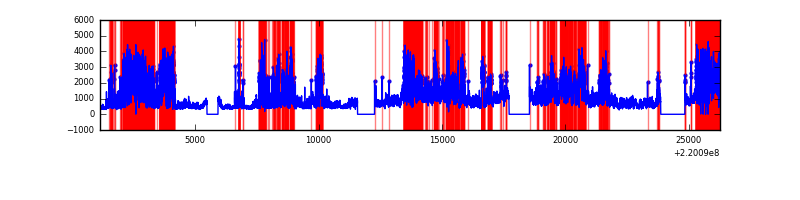 |
Top three noisy pixels from each quadrant. If the there are fewer than three noisy pixels in the level2.evt file, extra rows are filled as -1
| Pixel properties | Quadrant properties | ||||||
|---|---|---|---|---|---|---|---|
| Quadrant | DetID | PixID | Counts | Sigma | Mean | Median | Sigma |
| A | 13 | 251 | 1647024 | 3137.66 | 2575 | 2514 | 524.1 |
| A | 14 | 111 | 264292 | 499.46 | 2575 | 2514 | 524.1 |
| A | 8 | 15 | 109244 | 203.64 | 2575 | 2514 | 524.1 |
| B | 0 | 228 | 638743 | 1288.88 | 2598 | 2536 | 493.6 |
| B | 0 | 219 | 259125 | 519.82 | 2598 | 2536 | 493.6 |
| B | 0 | 214 | 195900 | 391.73 | 2598 | 2536 | 493.6 |
| C | 4 | 254 | 114161 | 191.55 | 2515 | 2526 | 582.8 |
| C | 9 | 16 | 23275 | 35.6 | 2515 | 2526 | 582.8 |
| C | 13 | 61 | 20053 | 30.07 | 2515 | 2526 | 582.8 |
| D | 2 | 33 | 8816242 | 15839.51 | 2281 | 2207 | 556.5 |
| D | 8 | 195 | 4392997 | 7890.59 | 2281 | 2207 | 556.5 |
| D | 12 | 221 | 1489465 | 2672.72 | 2281 | 2207 | 556.5 |
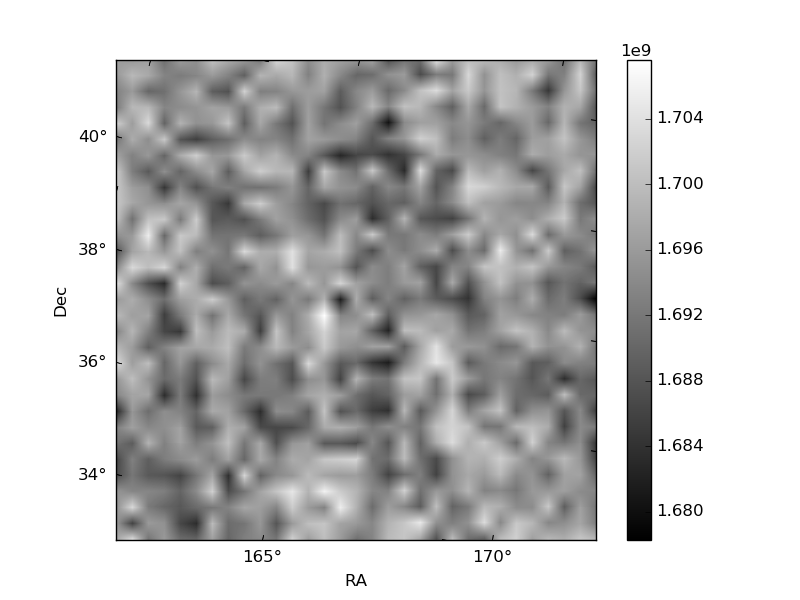
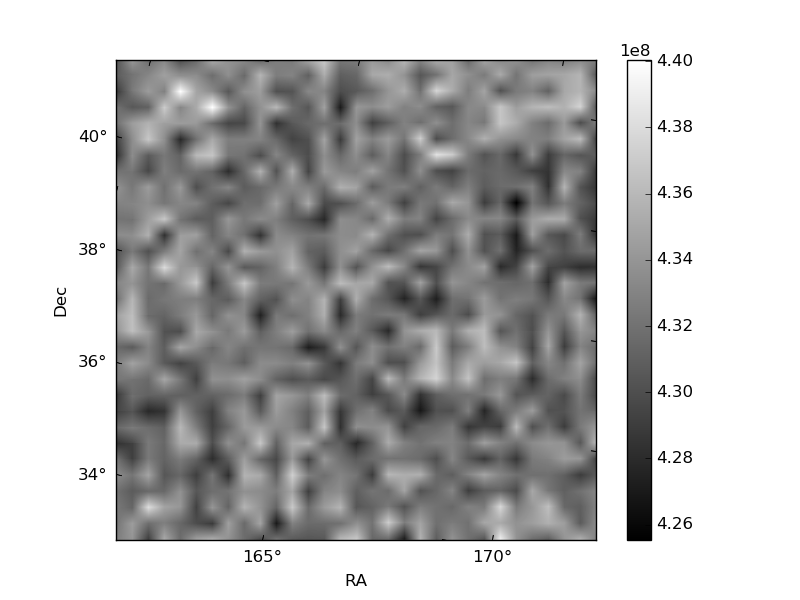
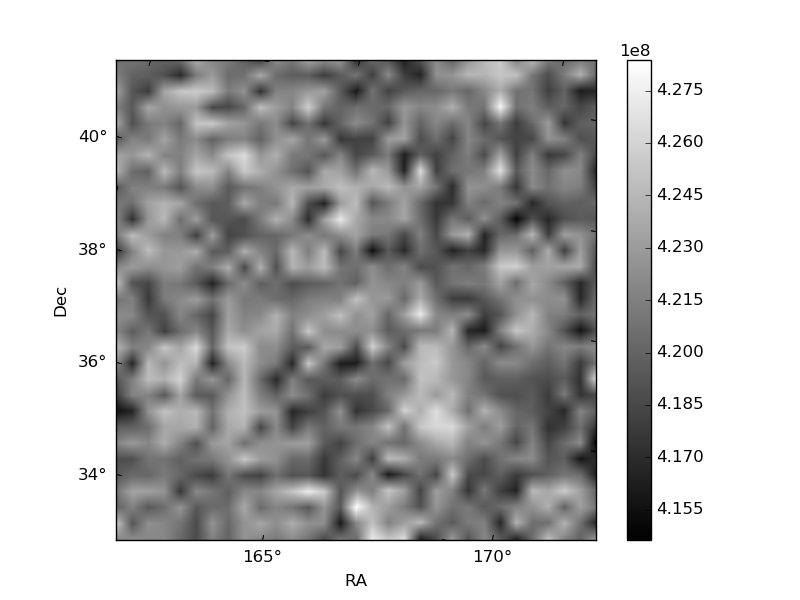
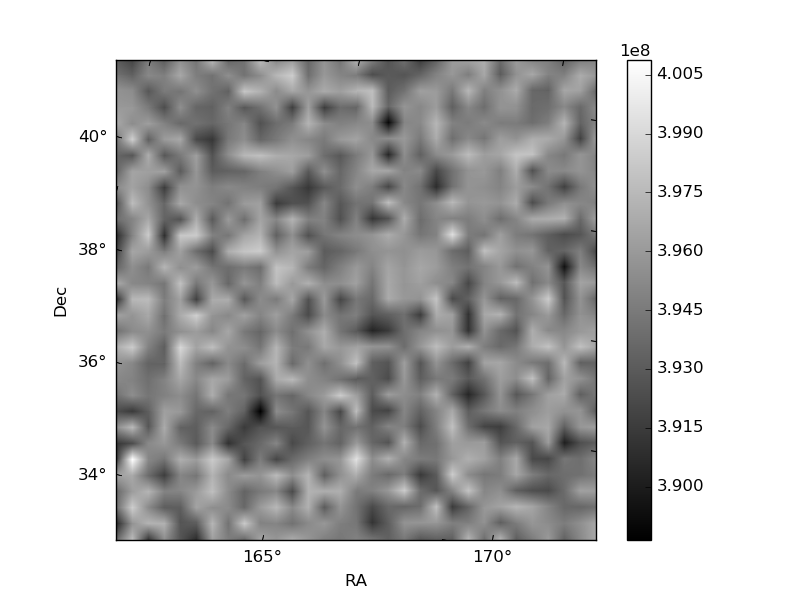
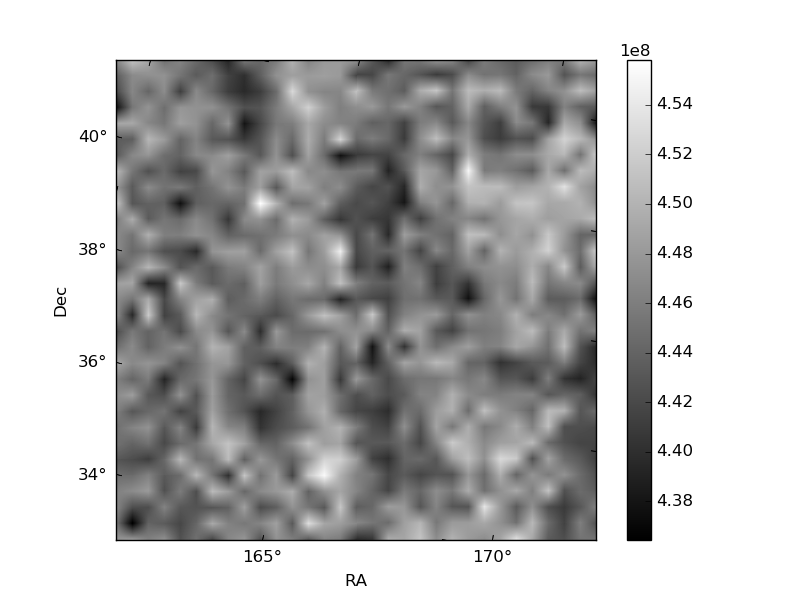
Histogram calculated using DETX and DETY for each event in the final _common_clean file
| Quadrant A | 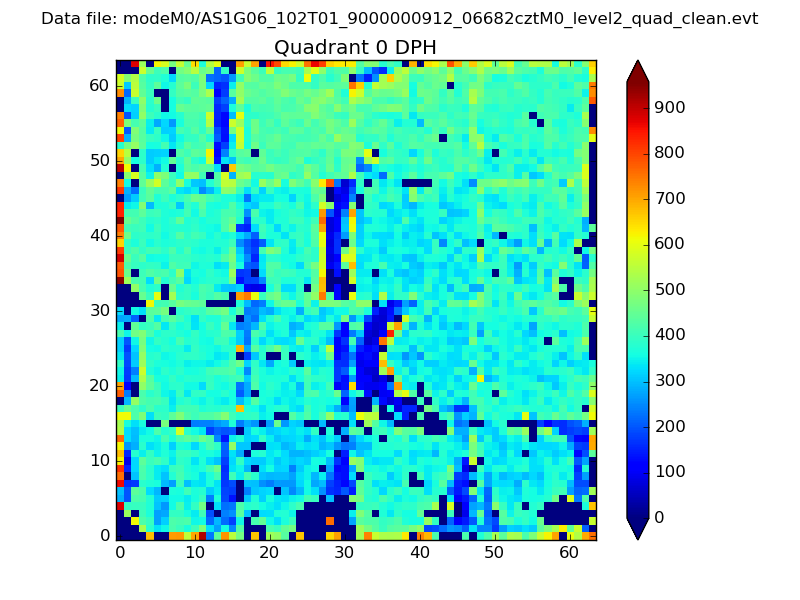 |
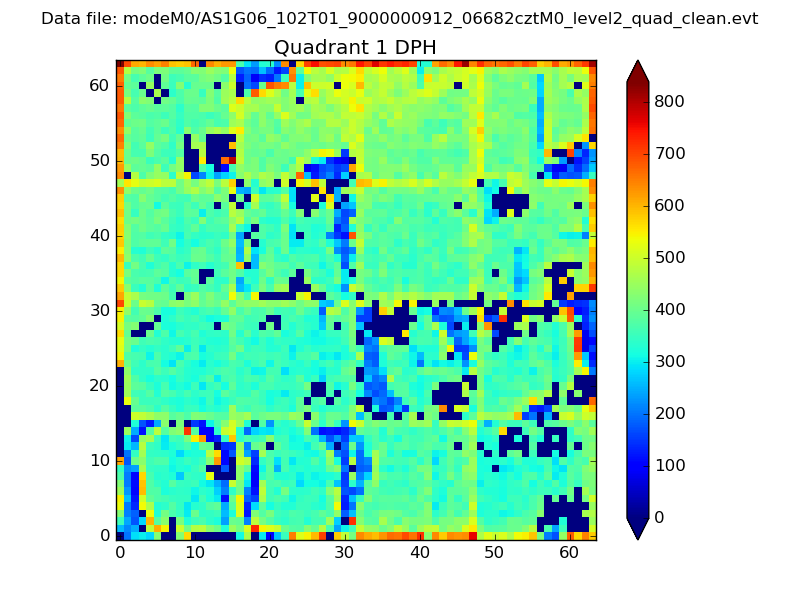 |
Quadrant B |
|---|---|---|---|
| Quadrant D | 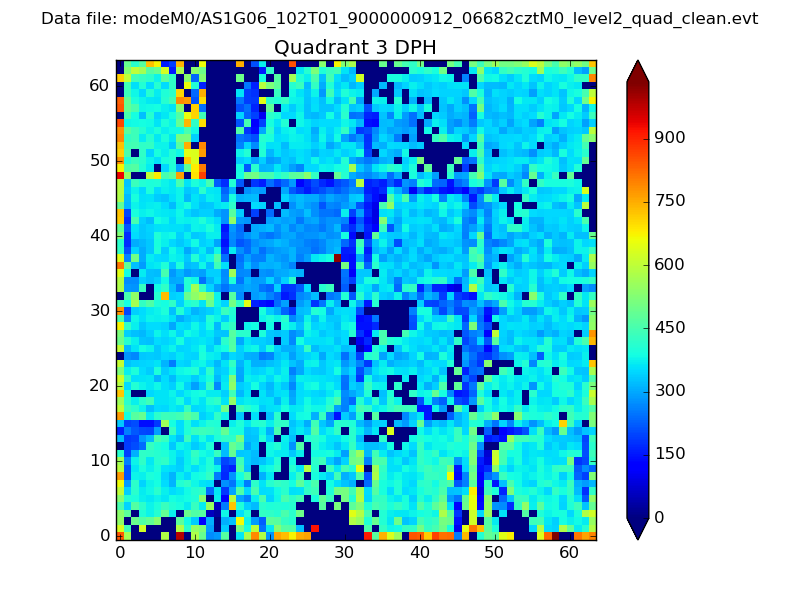 |
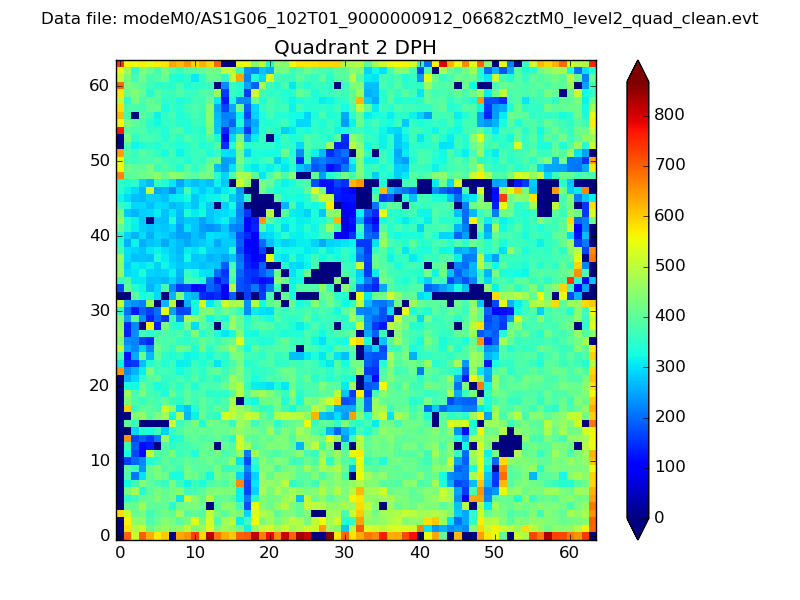 |
Quadrant C |
| Plot type | Count rate plots | Images |
|---|---|---|
| Comparison with Poisson distribution Blue bars denote a histogram of data divided into 1 sec bins. Red curve is a Poisson curve with rate = median count rate of data. |
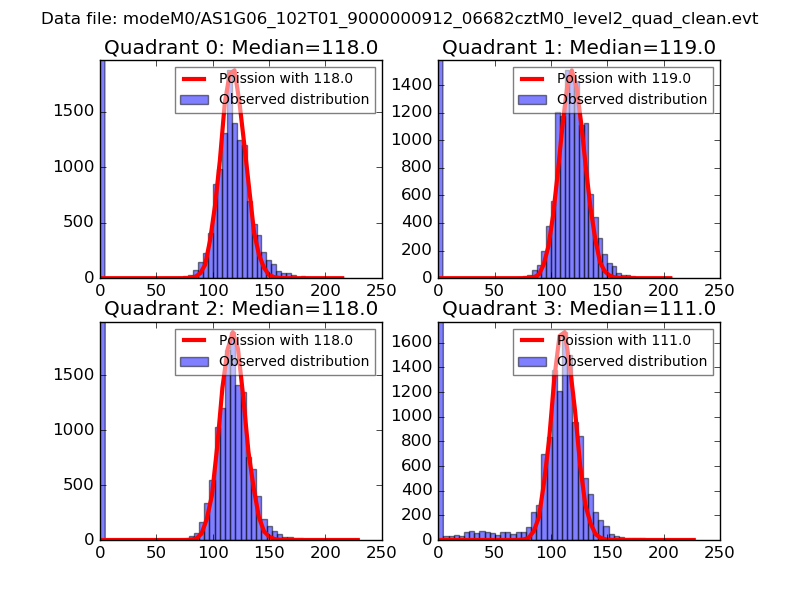 |
 |
| Quadrant-wise count rates Data is divided into 100 sec bins |
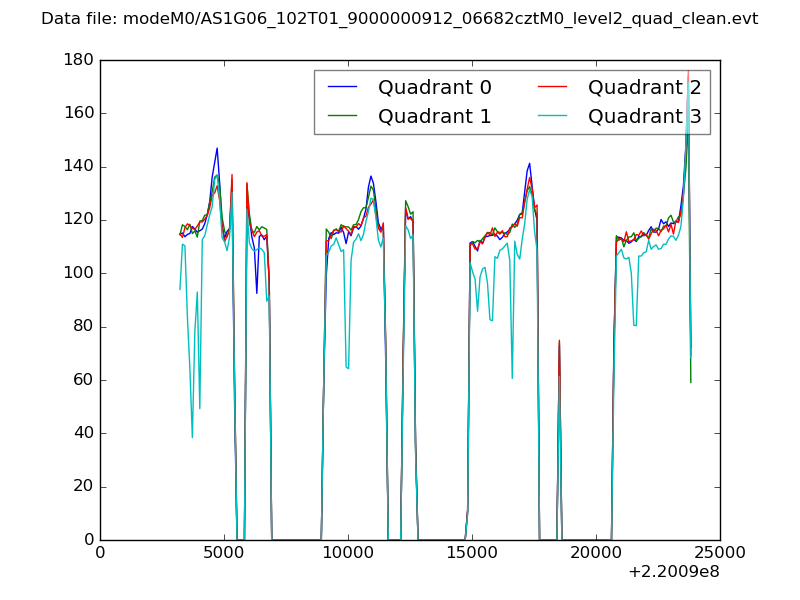 |
|
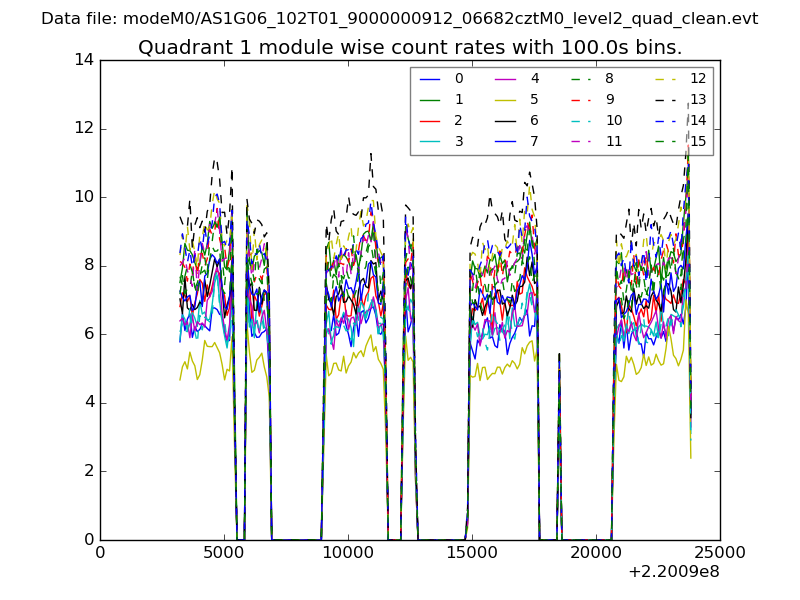
| Module-wise count rates for Quadrant A Data is divided into 100 sec bins |
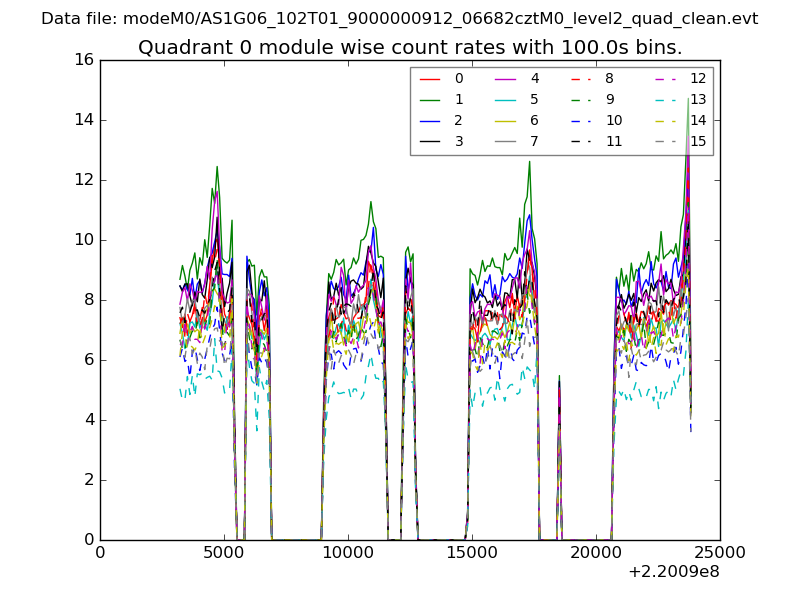 |
 |
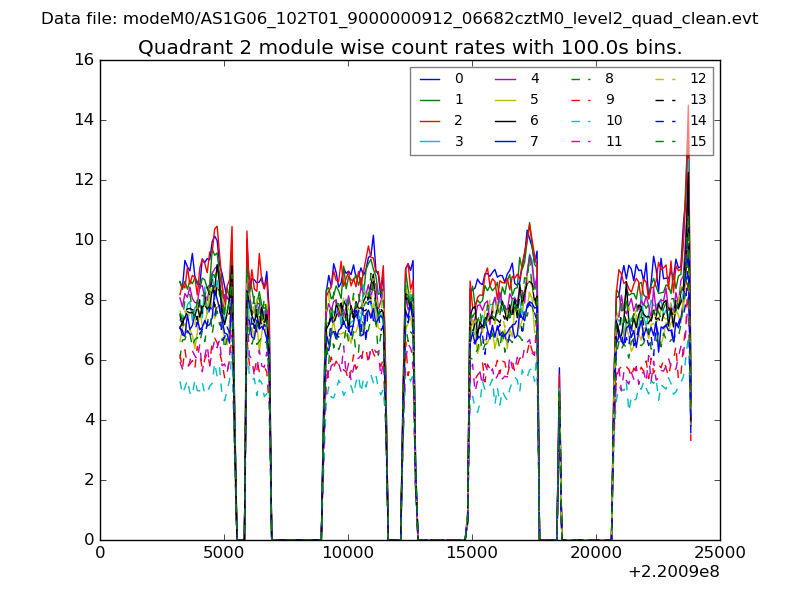
| Module-wise count rates for Quadrant B Data is divided into 100 sec bins |
 |
 |
| Module-wise count rates for Quadrant C Data is divided into 100 sec bins |
 |
 |
| Module-wise count rates for Quadrant D Data is divided into 100 sec bins |
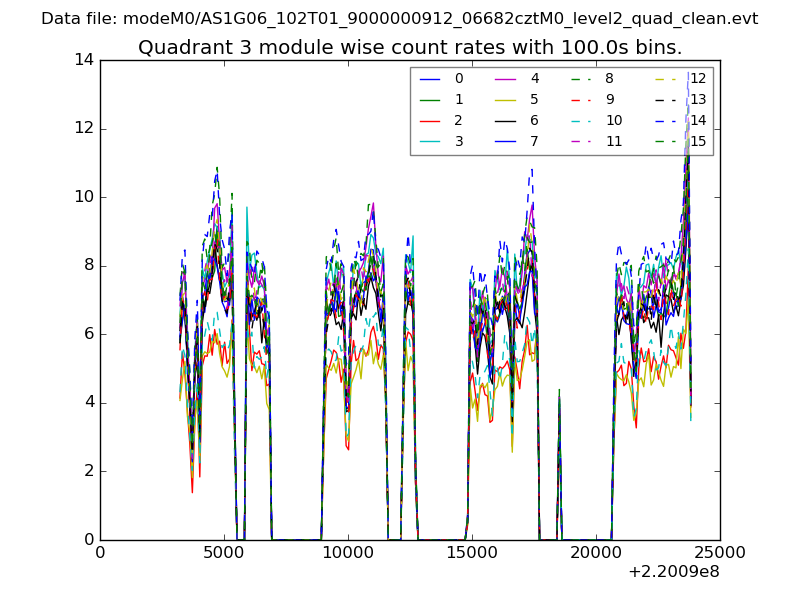 |
 |
| Parameter | Plot |
|---|---|
| CZT HV Monitor | 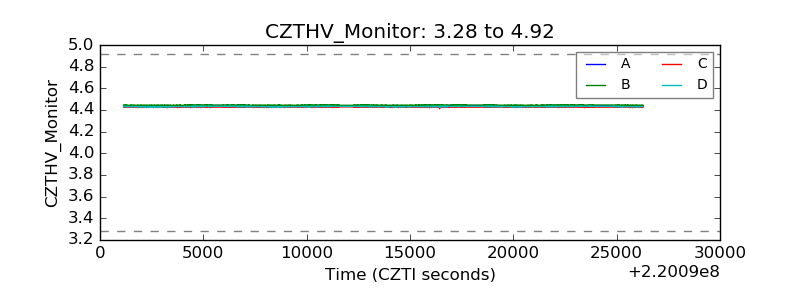 |
| D_VDD | 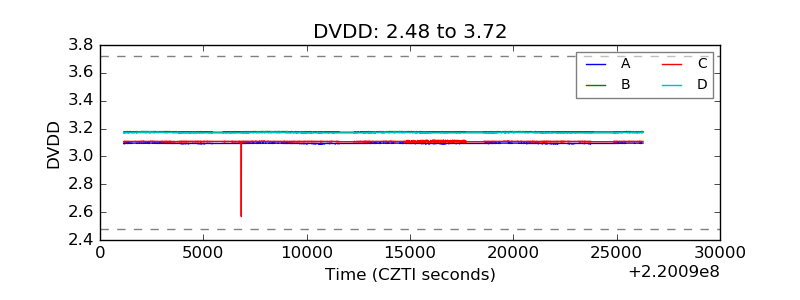 |
| Temperature 1 | 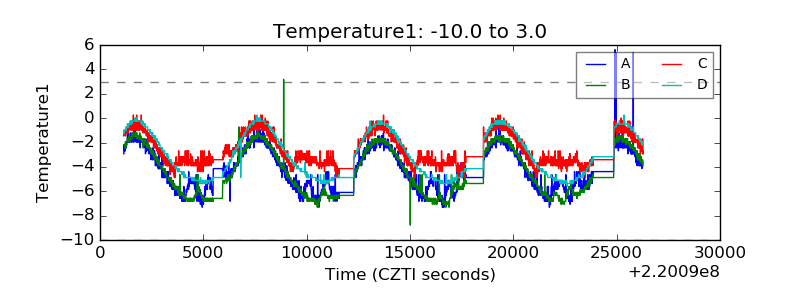 |
| Veto HV Monitor | 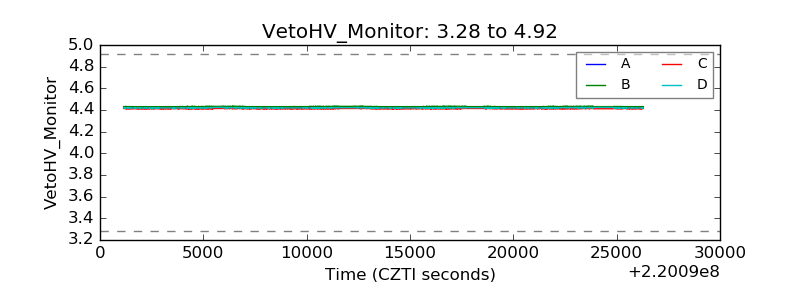 |
| Veto LLD | 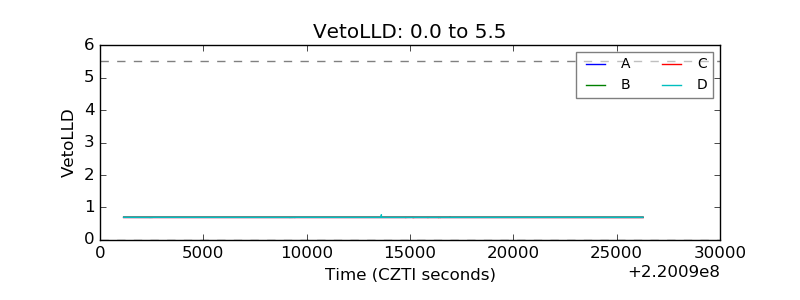 |
| Alpha Counter | 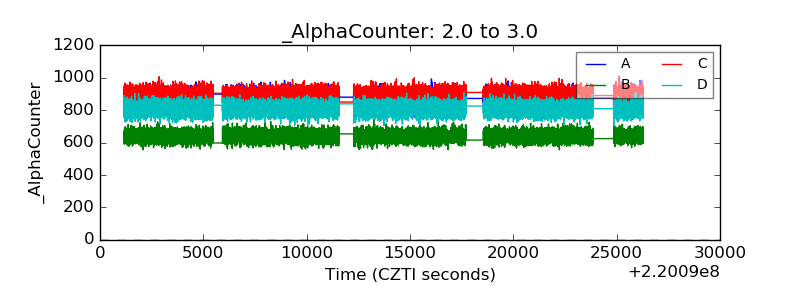 |
| _CPM_Rate | 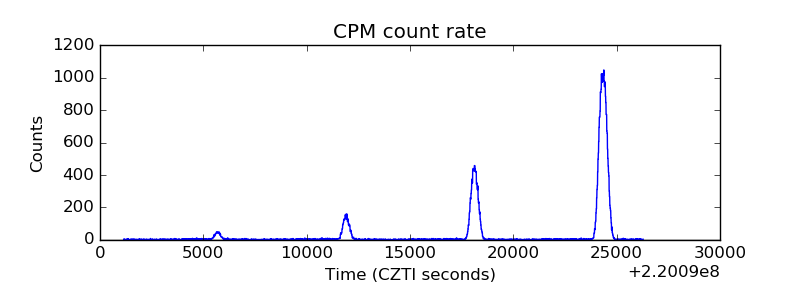 |
| CZT Counter | 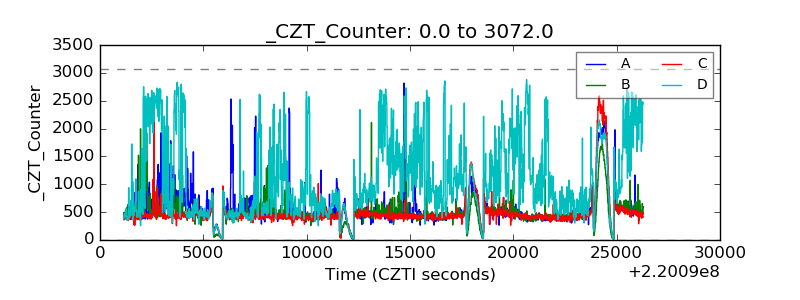 |
| +2.5 Volts monitor | 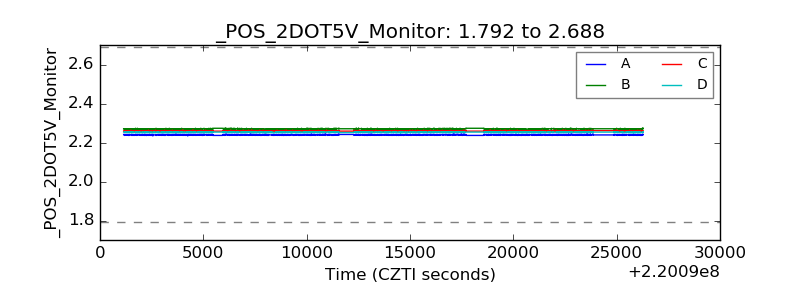 |
| +5 Volts monitor | 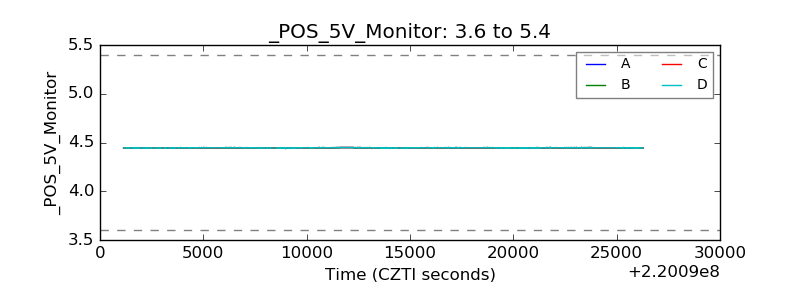 |
| _ROLL_ROT | 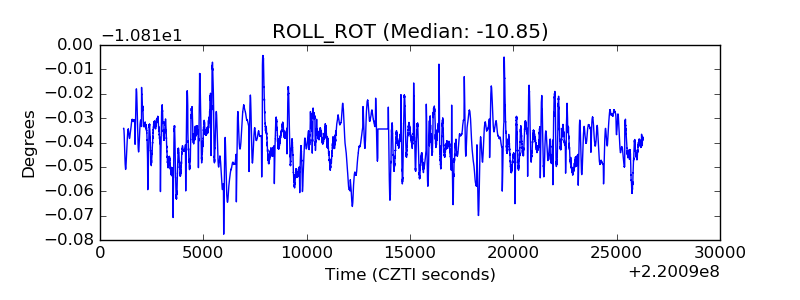 |
| _Roll_DEC | 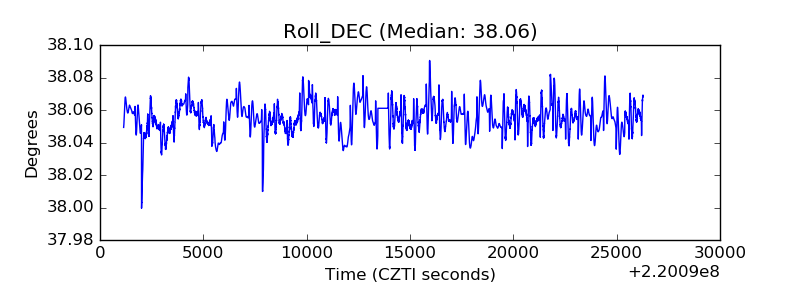 |
| _Roll_RA | 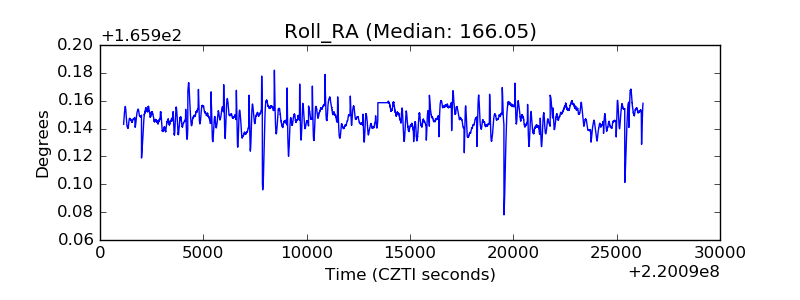 |
| Veto Counter | 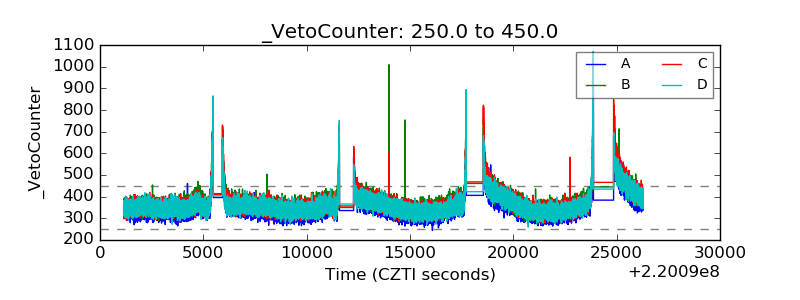 |