| Param | Original file | Final file |
|---|---|---|
| Filename | modeM0/AS1G06_102T01_9000000912_06684cztM0_level2.evt | modeM0/AS1G06_102T01_9000000912_06684cztM0_level2_quad_clean.evt |
| Size (bytes) | 567,043,200 | 66,870,720 |
| Size | 540.8 MB | 63.8 MB |
| Events in quadrant A | 3,129,514 | 408,496 |
| Events in quadrant B | 2,979,318 | 408,089 |
| Events in quadrant C | 2,738,335 | 409,397 |
| Events in quadrant D | 7,923,709 | 384,295 |
| Mode M9 | |||
|---|---|---|---|
| Quadrant | BADHDUFLAG | Total packets | Discarded packets |
| A | 0 | 11 | 0 |
| B | 0 | 11 | 0 |
| C | 0 | 11 | 0 |
| D | 0 | 11 | 0 |
| Mode SS | |||
|---|---|---|---|
| Quadrant | BADHDUFLAG | Total packets | Discarded packets |
| A | 0 | 120 | 0 |
| B | 0 | 120 | 0 |
| C | 0 | 120 | 0 |
| D | 0 | 120 | 0 |
| Mode M0 | |||
|---|---|---|---|
| Quadrant | BADHDUFLAG | Total packets | Discarded packets |
| A | 0 | 13238 | 2 |
| B | 0 | 12980 | 1 |
| C | 0 | 12293 | 1 |
| D | 0 | 27504 | 1 |
| Quadrant | Total seconds | Saturated seconds | Saturation percentage |
|---|---|---|---|
| A | 5932 | 86 | 1.449764% |
| B | 5932 | 67 | 1.129467% |
| C | 5932 | 35 | 0.590020% |
| D | 5932 | 1611 | 27.157788% |
Noise dominated data is calculated using 1-second bins in cleaned event files. If a bin has >2000 counts, and if more than 50% of those come from <1% of pixels, then it is considered to be noise-dominated and hence unusable.
| Quadrant | # 1 sec bins | Bins with >0 counts | Bins with >2000 counts | High rate bins dominated by noise | Noise dominated (total time) | Noise dominated (detector-on time) | Marked lightcurve |
|---|---|---|---|---|---|---|---|
| A | 7067 | 5933 | 12 | 12 | 0.17% | 0.20% | 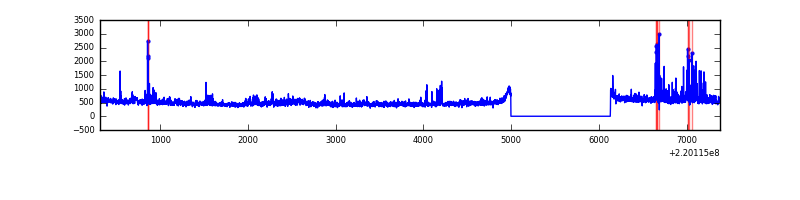 |
| B | 7067 | 5933 | 9 | 9 | 0.13% | 0.15% | 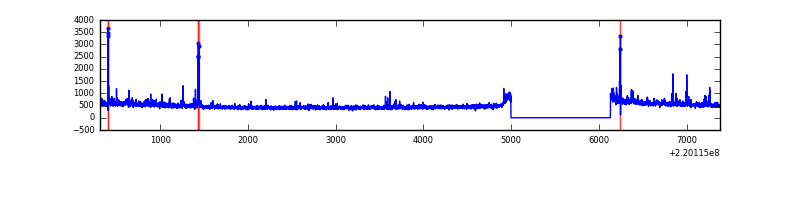 |
| C | 7067 | 5933 | 0 | 0 | 0.00% | 0.00% |  |
| D | 7067 | 5933 | 1175 | 1175 | 16.63% | 19.80% | 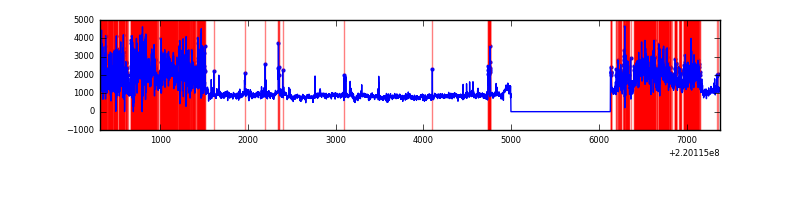 |
Top three noisy pixels from each quadrant. If the there are fewer than three noisy pixels in the level2.evt file, extra rows are filled as -1
| Pixel properties | Quadrant properties | ||||||
|---|---|---|---|---|---|---|---|
| Quadrant | DetID | PixID | Counts | Sigma | Mean | Median | Sigma |
| A | 8 | 15 | 176114 | 1215.09 | 712 | 697 | 144.4 |
| A | 13 | 251 | 163966 | 1130.94 | 712 | 697 | 144.4 |
| A | 4 | 2 | 19184 | 128.06 | 712 | 697 | 144.4 |
| B | 0 | 219 | 50165 | 361.31 | 718 | 701 | 136.9 |
| B | 0 | 214 | 31307 | 223.56 | 718 | 701 | 136.9 |
| B | 4 | 173 | 27861 | 198.39 | 718 | 701 | 136.9 |
| C | 9 | 54 | 11723 | 67.84 | 698 | 703 | 162.4 |
| C | 13 | 61 | 5578 | 30.01 | 698 | 703 | 162.4 |
| C | 0 | 235 | 2537 | 11.29 | 698 | 703 | 162.4 |
| D | 2 | 33 | 2916447 | 19864.83 | 599 | 582 | 146.8 |
| D | 8 | 195 | 2543471 | 17323.87 | 599 | 582 | 146.8 |
| D | 12 | 221 | 81551 | 551.62 | 599 | 582 | 146.8 |
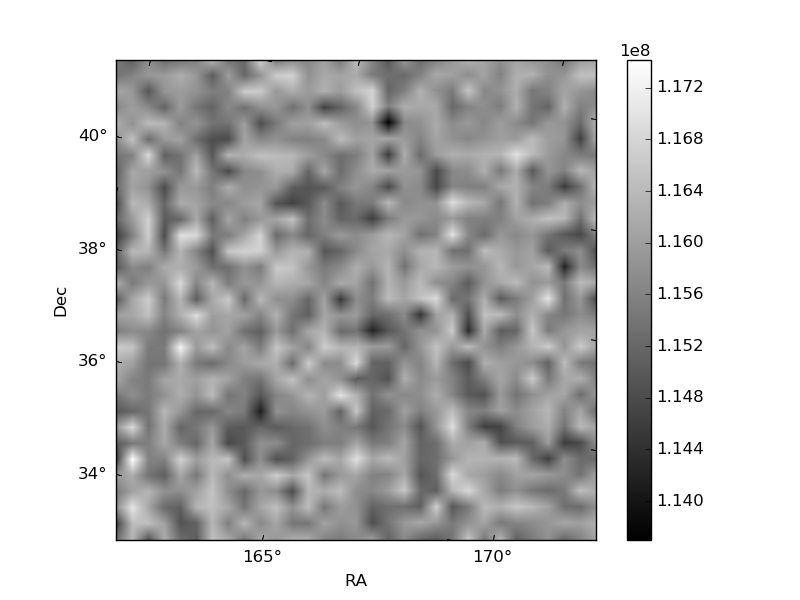
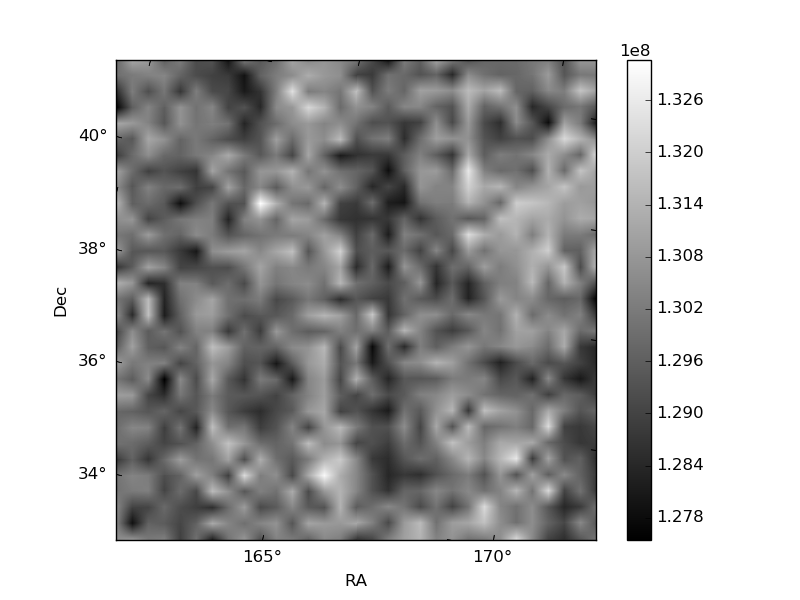
Histogram calculated using DETX and DETY for each event in the final _common_clean file
| Quadrant A |  |
 |
Quadrant B |
|---|---|---|---|
| Quadrant D | 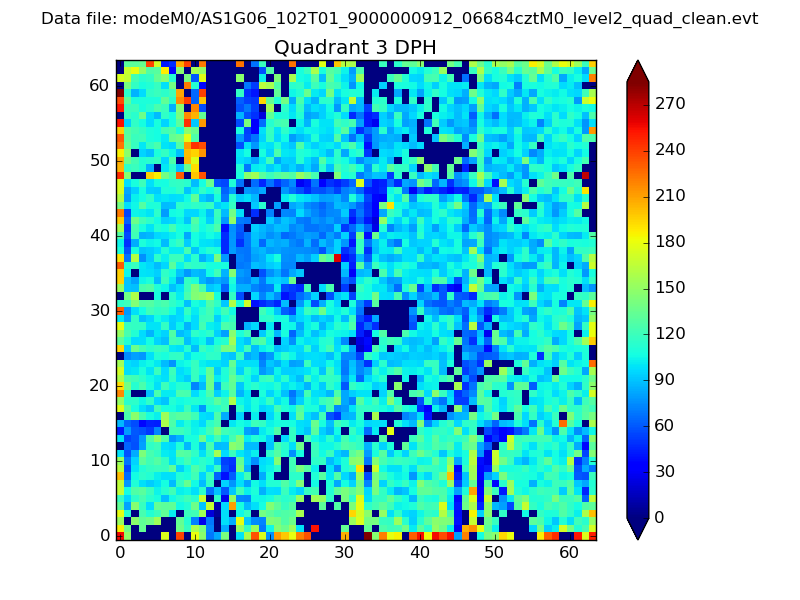 |
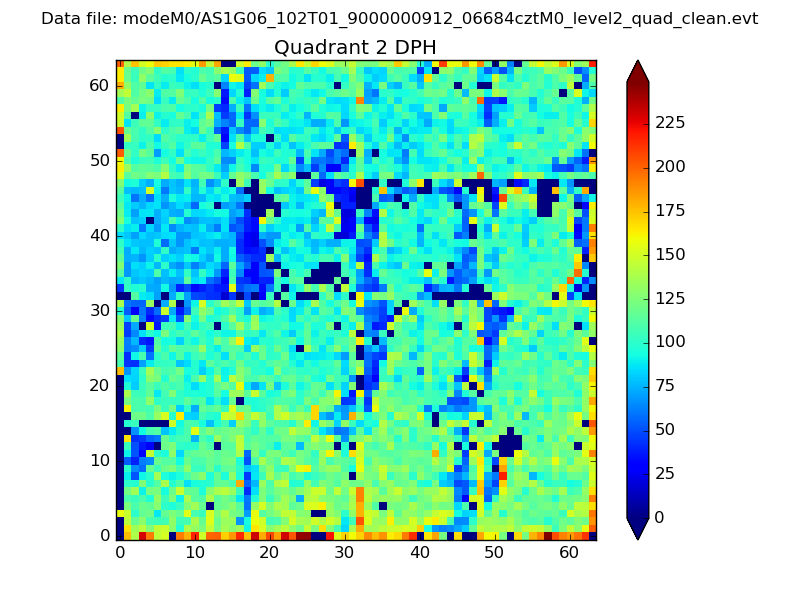 |
Quadrant C |
| Plot type | Count rate plots | Images |
|---|---|---|
| Comparison with Poisson distribution Blue bars denote a histogram of data divided into 1 sec bins. Red curve is a Poisson curve with rate = median count rate of data. |
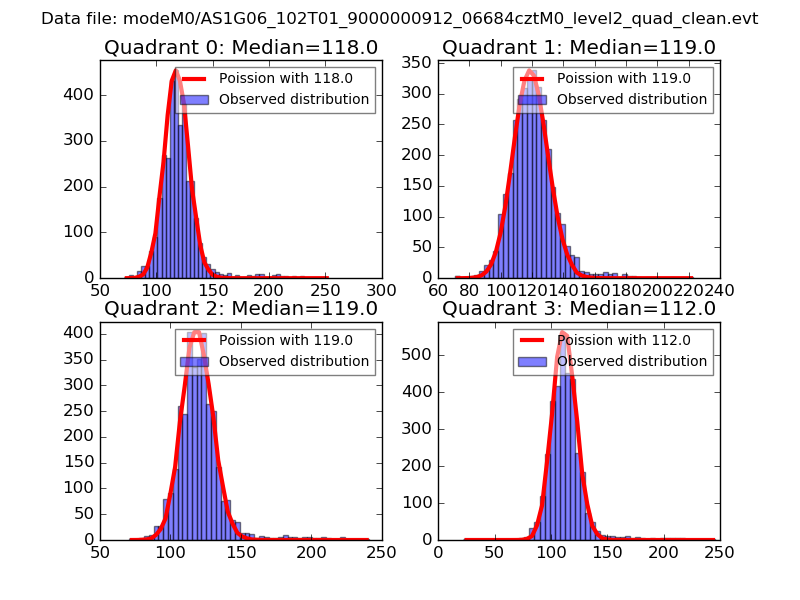 |
 |
| Quadrant-wise count rates Data is divided into 100 sec bins |
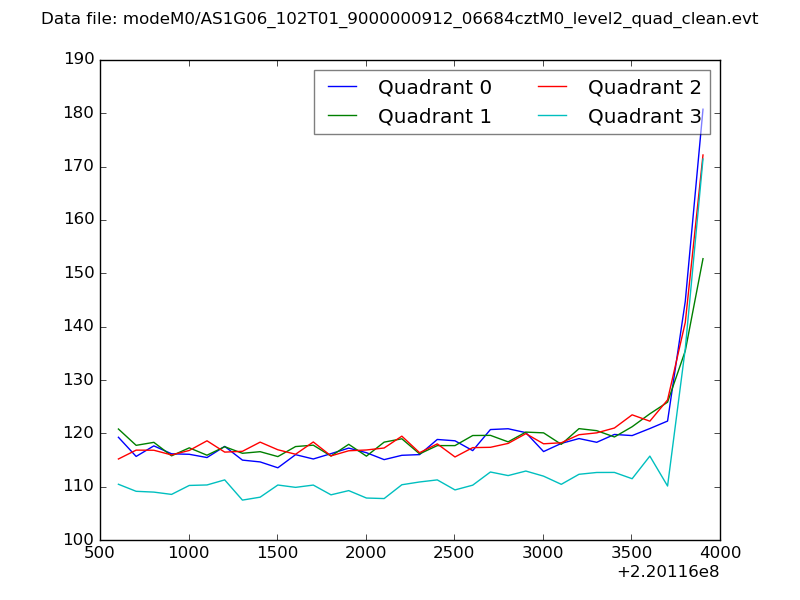 |
|
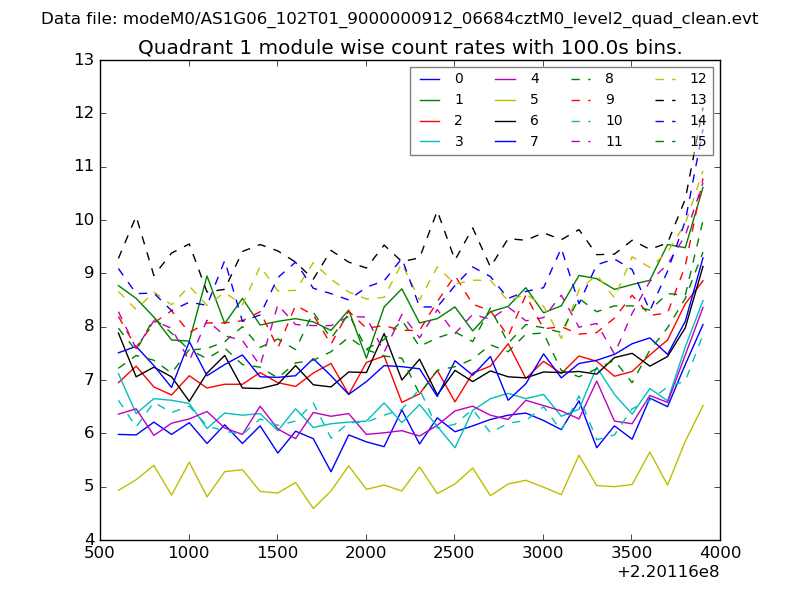
| Module-wise count rates for Quadrant A Data is divided into 100 sec bins |
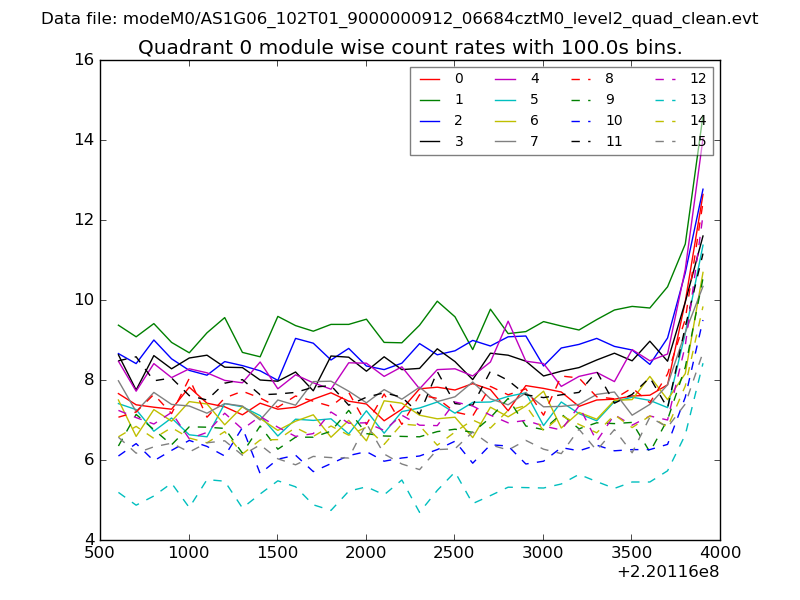 |
 |
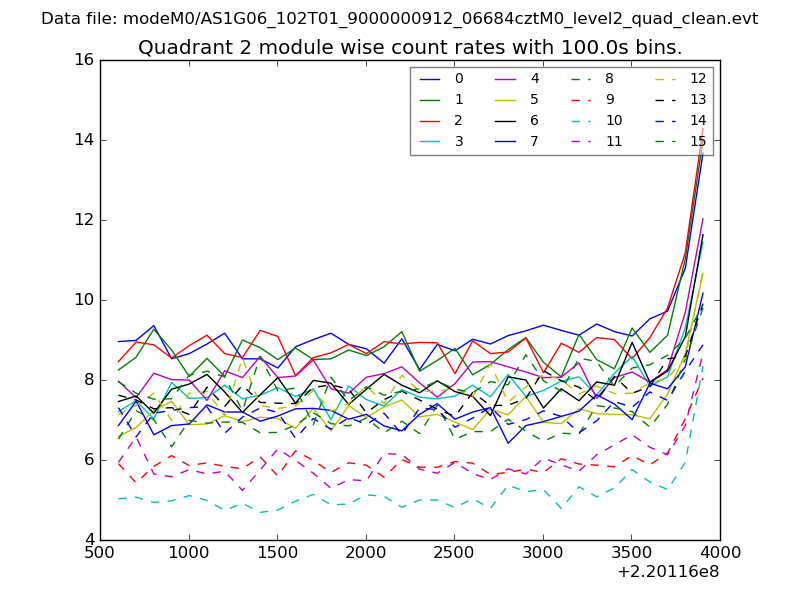
| Module-wise count rates for Quadrant B Data is divided into 100 sec bins |
 |
 |
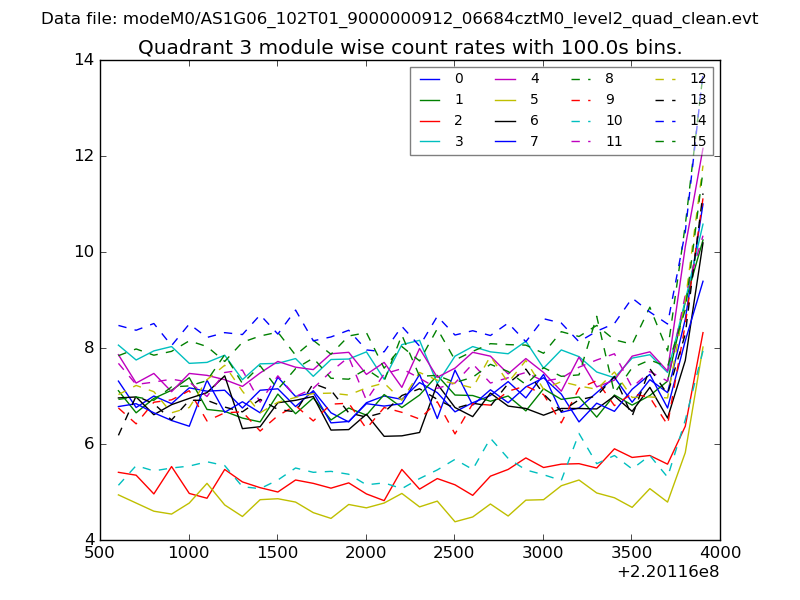
| Module-wise count rates for Quadrant C Data is divided into 100 sec bins |
 |
 |
| Module-wise count rates for Quadrant D Data is divided into 100 sec bins |
 |
 |
| Parameter | Plot |
|---|---|
| CZT HV Monitor | 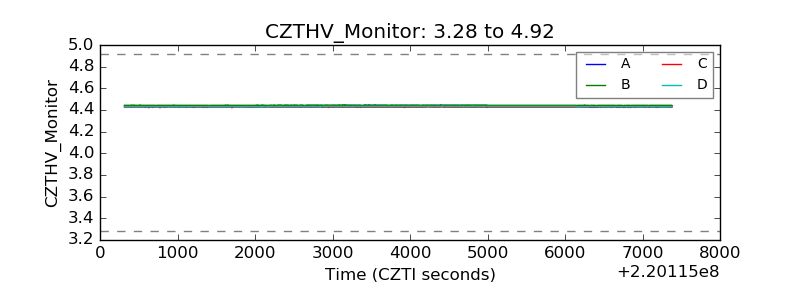 |
| D_VDD | 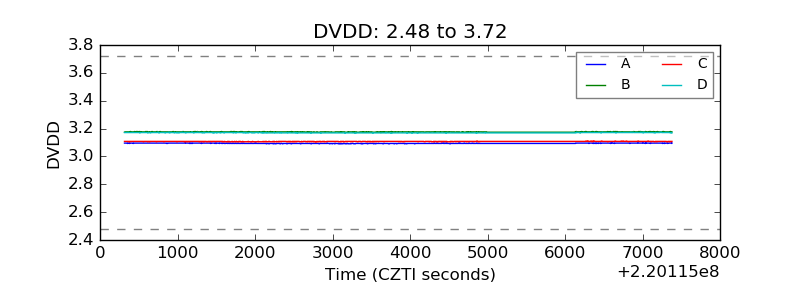 |
| Temperature 1 | 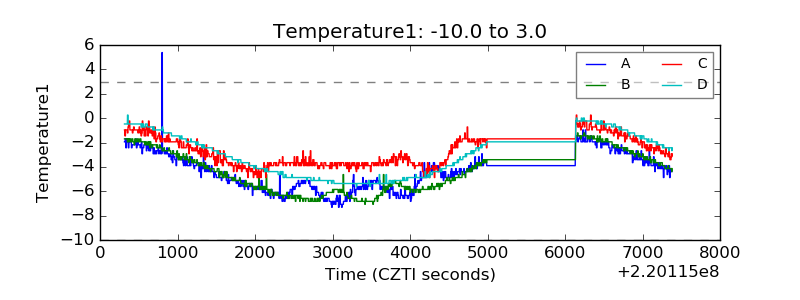 |
| Veto HV Monitor | 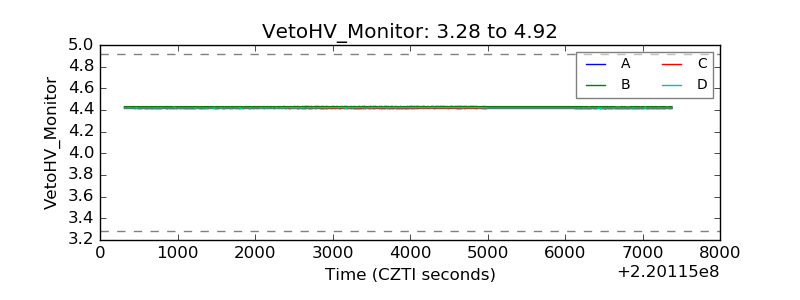 |
| Veto LLD | 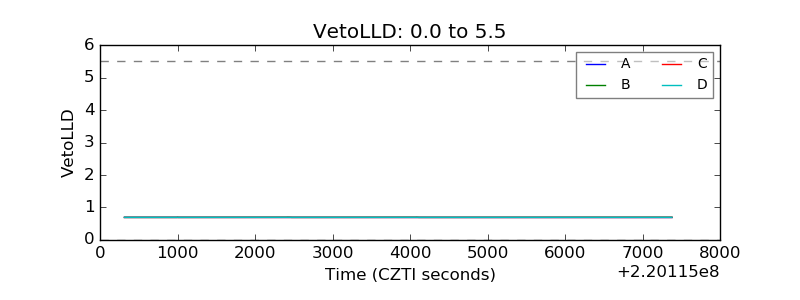 |
| Alpha Counter | 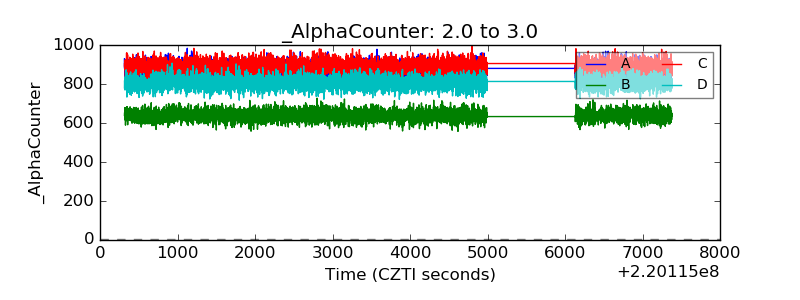 |
| _CPM_Rate | 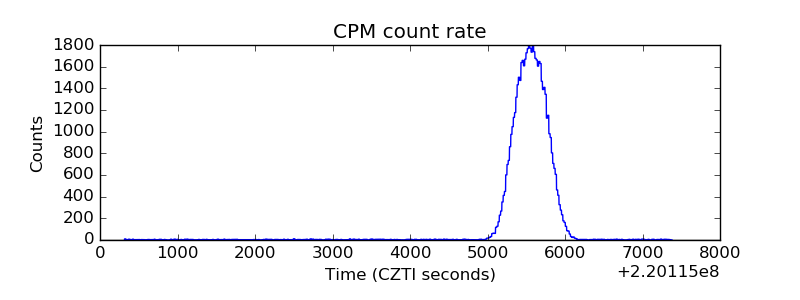 |
| CZT Counter | 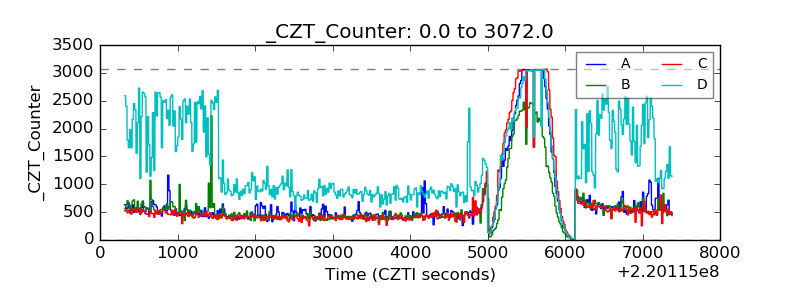 |
| +2.5 Volts monitor |  |
| +5 Volts monitor |  |
| _ROLL_ROT | 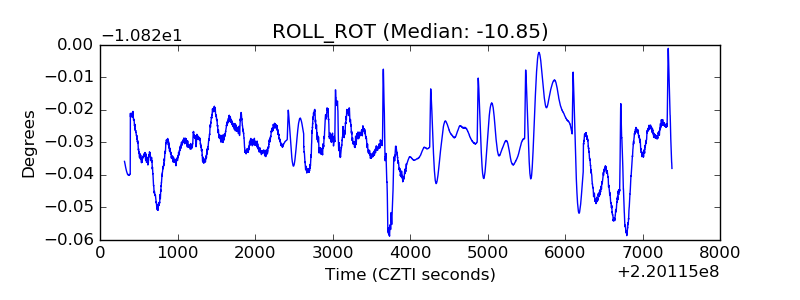 |
| _Roll_DEC | 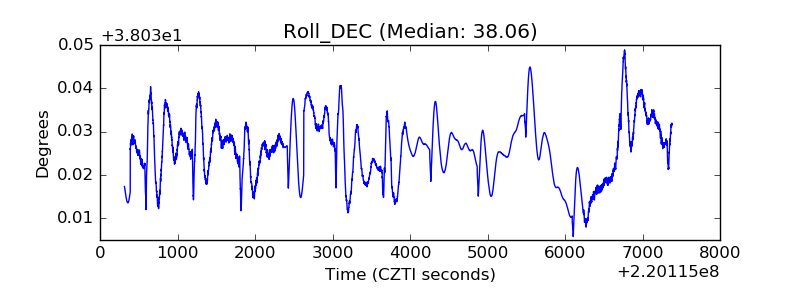 |
| _Roll_RA | 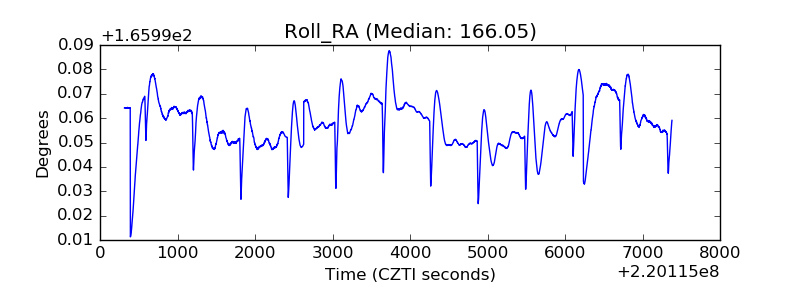 |
| Veto Counter | 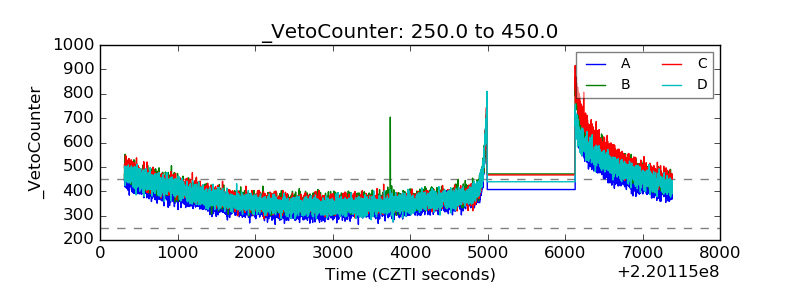 |