| Param | Original file | Final file |
|---|---|---|
| Filename | modeM0/AS1G06_135T01_9000000908cztM0_level2.fits | modeM0/AS1G06_135T01_9000000908cztM0_level2_quad_clean.evt |
| Size (bytes) | 77,463,360 | 62,712,000 |
| Size | 73.9 MB | 59.8 MB |
| Events in quadrant A | 469,530 | 367,882 |
| Events in quadrant B | 457,788 | 366,028 |
| Events in quadrant C | 465,592 | 347,402 |
| Events in quadrant D | 357,902 | 222,192 |
| Mode M0 | |||
|---|---|---|---|
| Quadrant | BADHDUFLAG | Total packets | Discarded packets |
| A | 0 | 17663 | 0 |
| B | 0 | 18209 | 0 |
| C | 0 | 17690 | 0 |
| D | 0 | 30080 | 0 |
| Mode SS | |||
|---|---|---|---|
| Quadrant | BADHDUFLAG | Total packets | Discarded packets |
| A | 0 | 174 | 0 |
| B | 0 | 174 | 0 |
| C | 0 | 174 | 0 |
| D | 0 | 174 | 0 |
| Mode M9 | |||
|---|---|---|---|
| Quadrant | BADHDUFLAG | Total packets | Discarded packets |
| A | 0 | 19 | 0 |
| B | 0 | 19 | 0 |
| C | 0 | 19 | 0 |
| D | 0 | 19 | 0 |
| Quadrant | Total seconds | Saturated seconds | Saturation percentage |
|---|---|---|---|
| A | 8560 | 113 | 1.320093% |
| B | 8560 | 146 | 1.705607% |
| C | 8560 | 94 | 1.098131% |
| D | 8560 | 1663 | 19.427570% |
Noise dominated data is calculated using 1-second bins in cleaned event files. If a bin has >2000 counts, and if more than 50% of those come from <1% of pixels, then it is considered to be noise-dominated and hence unusable.
| Quadrant | # 1 sec bins | Bins with >0 counts | Bins with >2000 counts | High rate bins dominated by noise | Noise dominated (total time) | Noise dominated (detector-on time) | Marked lightcurve |
|---|---|---|---|---|---|---|---|
| A | 10520 | 8560 | 0 | 0 | 0.00% | 0.00% |  |
| B | 10520 | 8560 | 0 | 0 | 0.00% | 0.00% |  |
| C | 10520 | 8560 | 0 | 0 | 0.00% | 0.00% |  |
| D | 10520 | 8491 | 0 | 0 | 0.00% | 0.00% |  |
Top three noisy pixels from each quadrant. If the there are fewer than three noisy pixels in the level2.evt file, extra rows are filled as -1
| Pixel properties | Quadrant properties | ||||||
|---|---|---|---|---|---|---|---|
| Quadrant | DetID | PixID | Counts | Sigma | Mean | Median | Sigma |
| A | 0 | 29 | 489 | 11.36 | 122 | 114 | 33.0 |
| A | 7 | 110 | 415 | 9.12 | 122 | 114 | 33.0 |
| A | 0 | 30 | 361 | 7.48 | 122 | 114 | 33.0 |
| B | 2 | 9 | 441 | 12.01 | 120 | 114 | 27.2 |
| B | 5 | 128 | 323 | 7.68 | 120 | 114 | 27.2 |
| B | 3 | 17 | 321 | 7.6 | 120 | 114 | 27.2 |
| C | 3 | 158 | 332 | 6.3 | 123 | 113 | 34.8 |
| C | 9 | 233 | 327 | 6.15 | 123 | 113 | 34.8 |
| C | 9 | 188 | 327 | 6.15 | 123 | 113 | 34.8 |
| D | 4 | 160 | 294 | 6.84 | 102 | 92 | 29.5 |
| D | 1 | 31 | 279 | 6.33 | 102 | 92 | 29.5 |
| D | 7 | 5 | 266 | 5.89 | 102 | 92 | 29.5 |
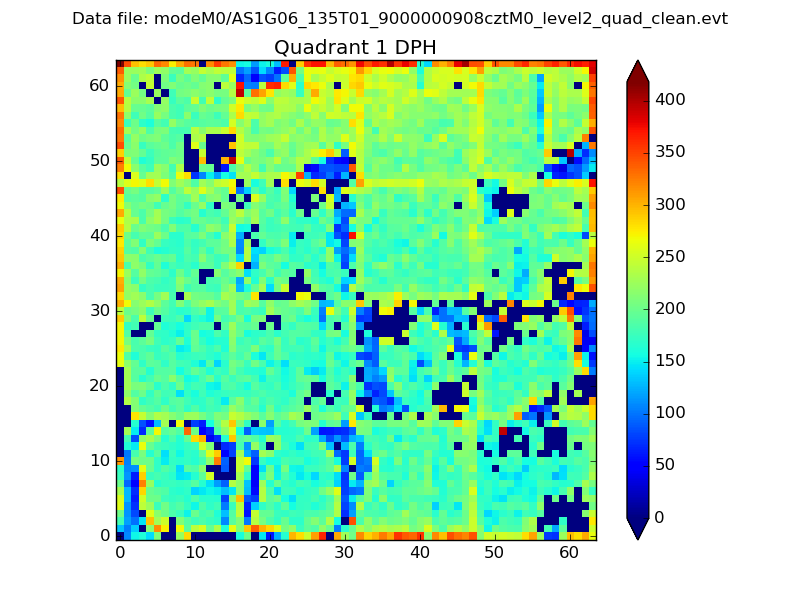
Histogram calculated using DETX and DETY for each event in the final _common_clean file
| Quadrant A |  |
 |
Quadrant B |
|---|---|---|---|
| Quadrant D |  |
 |
Quadrant C |
| Plot type | Count rate plots | Images |
|---|---|---|
| Comparison with Poisson distribution Blue bars denote a histogram of data divided into 1 sec bins. Red curve is a Poisson curve with rate = median count rate of data. |
 |
 |
| Quadrant-wise count rates Data is divided into 100 sec bins |
 |
|
| Module-wise count rates for Quadrant A Data is divided into 100 sec bins |
 |
 |
| Module-wise count rates for Quadrant B Data is divided into 100 sec bins |
 |
 |
| Module-wise count rates for Quadrant C Data is divided into 100 sec bins |
 |
 |
| Module-wise count rates for Quadrant D Data is divided into 100 sec bins |
 |
 |
| Parameter | Plot |
|---|---|
| CZT HV Monitor |  |
| D_VDD |  |
| Temperature 1 |  |
| Veto HV Monitor |  |
| Veto LLD |  |
| Alpha Counter |  |
| _CPM_Rate |  |
| CZT Counter |  |
| +2.5 Volts monitor |  |
| +5 Volts monitor |  |
| _ROLL_ROT |  |
| _Roll_DEC |  |
| _Roll_RA |  |
| Veto Counter |  |