| Param | Original file | Final file |
|---|---|---|
| Filename | modeM0/AS1G06_135T01_9000000908_06669cztM0_level2.evt | modeM0/AS1G06_135T01_9000000908_06669cztM0_level2_quad_clean.evt |
| Size (bytes) | 535,489,920 | 89,504,640 |
| Size | 510.7 MB | 85.4 MB |
| Events in quadrant A | 2,881,744 | 605,108 |
| Events in quadrant B | 3,115,560 | 609,473 |
| Events in quadrant C | 2,801,757 | 593,763 |
| Events in quadrant D | 6,984,977 | 456,462 |
| Mode M0 | |||
|---|---|---|---|
| Quadrant | BADHDUFLAG | Total packets | Discarded packets |
| A | 0 | 13104 | 2 |
| B | 0 | 13599 | 1 |
| C | 0 | 13009 | 1 |
| D | 0 | 25234 | 1 |
| Mode SS | |||
|---|---|---|---|
| Quadrant | BADHDUFLAG | Total packets | Discarded packets |
| A | 0 | 128 | 0 |
| B | 0 | 128 | 0 |
| C | 0 | 128 | 0 |
| D | 0 | 128 | 0 |
| Mode M9 | |||
|---|---|---|---|
| Quadrant | BADHDUFLAG | Total packets | Discarded packets |
| A | 0 | 10 | 0 |
| B | 0 | 10 | 0 |
| C | 0 | 10 | 0 |
| D | 0 | 10 | 0 |
| Quadrant | Total seconds | Saturated seconds | Saturation percentage |
|---|---|---|---|
| A | 6376 | 55 | 0.862610% |
| B | 6376 | 86 | 1.348808% |
| C | 6376 | 49 | 0.768507% |
| D | 6376 | 1596 | 25.031368% |
Noise dominated data is calculated using 1-second bins in cleaned event files. If a bin has >2000 counts, and if more than 50% of those come from <1% of pixels, then it is considered to be noise-dominated and hence unusable.
| Quadrant | # 1 sec bins | Bins with >0 counts | Bins with >2000 counts | High rate bins dominated by noise | Noise dominated (total time) | Noise dominated (detector-on time) | Marked lightcurve |
|---|---|---|---|---|---|---|---|
| A | 7431 | 6377 | 0 | 0 | 0.00% | 0.00% |  |
| B | 7431 | 6377 | 23 | 23 | 0.31% | 0.36% |  |
| C | 7431 | 6377 | 2 | 2 | 0.03% | 0.03% | 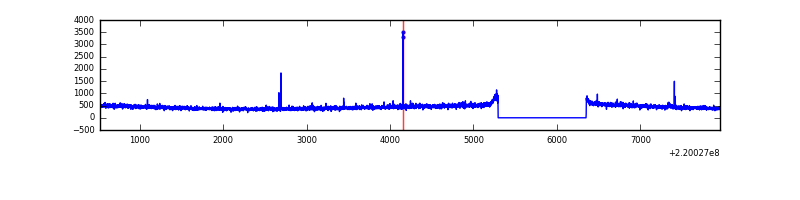 |
| D | 7431 | 6377 | 1356 | 1356 | 18.25% | 21.26% |  |
Top three noisy pixels from each quadrant. If the there are fewer than three noisy pixels in the level2.evt file, extra rows are filled as -1
| Pixel properties | Quadrant properties | ||||||
|---|---|---|---|---|---|---|---|
| Quadrant | DetID | PixID | Counts | Sigma | Mean | Median | Sigma |
| A | 8 | 15 | 14168 | 88.97 | 738 | 723 | 151.1 |
| A | 0 | 226 | 7217 | 42.97 | 738 | 723 | 151.1 |
| A | 12 | 194 | 6861 | 40.62 | 738 | 723 | 151.1 |
| B | 0 | 214 | 105154 | 729.13 | 742 | 724 | 143.2 |
| B | 4 | 80 | 32446 | 221.48 | 742 | 724 | 143.2 |
| B | 4 | 81 | 23598 | 159.71 | 742 | 724 | 143.2 |
| C | 9 | 247 | 26861 | 158.9 | 707 | 712 | 164.6 |
| C | 9 | 221 | 7517 | 41.35 | 707 | 712 | 164.6 |
| C | 1 | 3 | 5929 | 31.7 | 707 | 712 | 164.6 |
| D | 2 | 33 | 4438737 | 29242.35 | 615 | 595 | 151.8 |
| D | 2 | 63 | 89884 | 588.31 | 615 | 595 | 151.8 |
| D | 2 | 152 | 57700 | 376.26 | 615 | 595 | 151.8 |
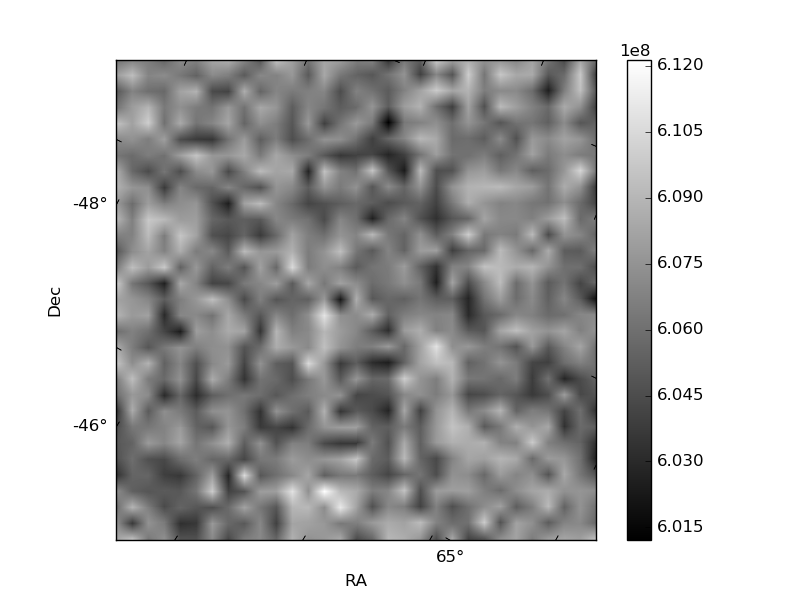
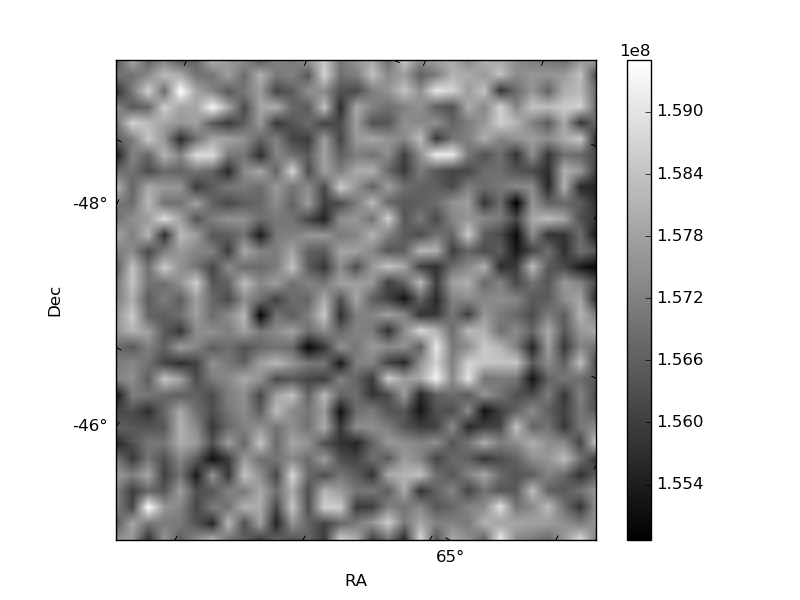
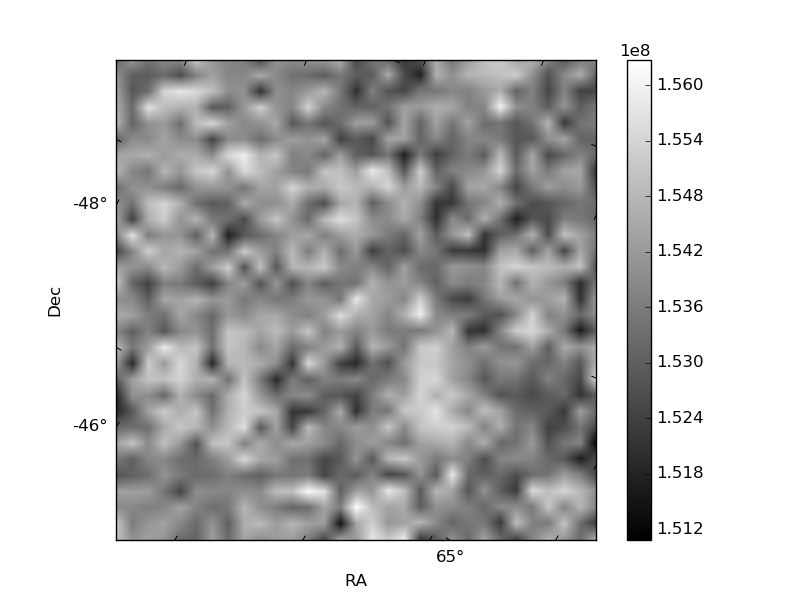
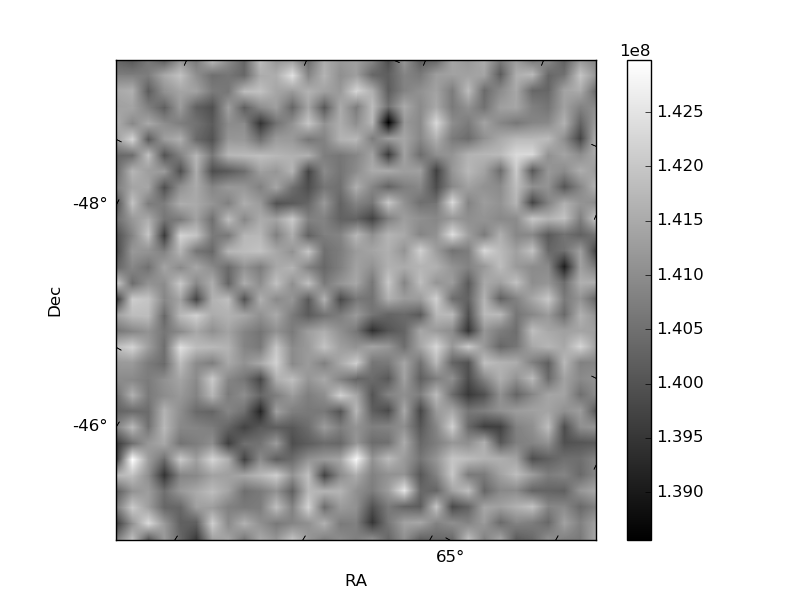
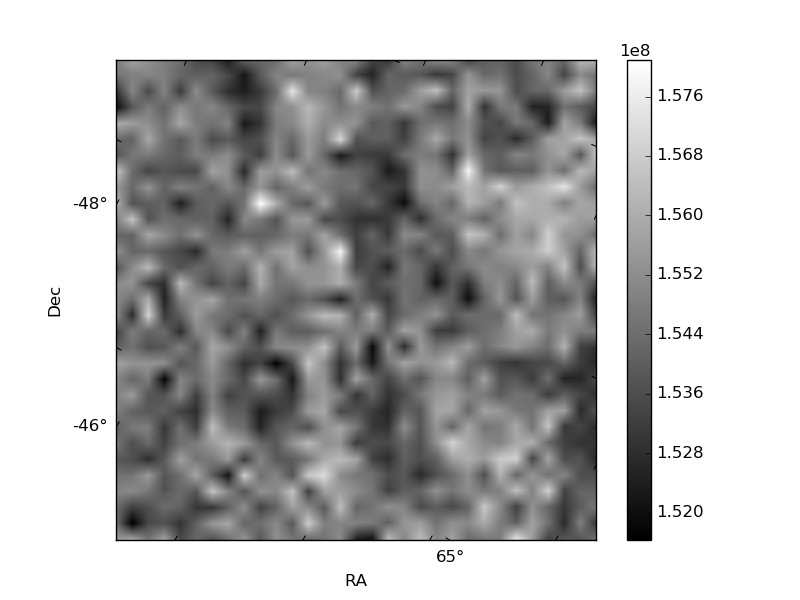
Histogram calculated using DETX and DETY for each event in the final _common_clean file
| Quadrant A | 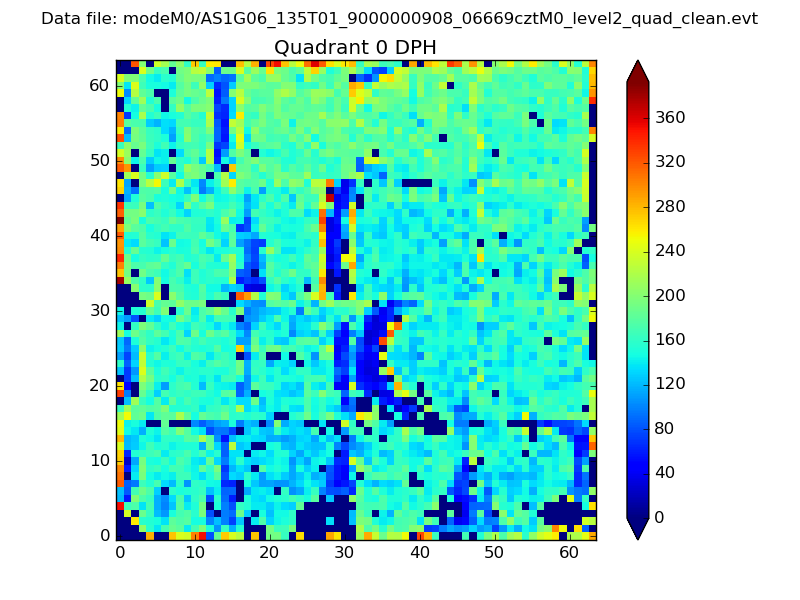 |
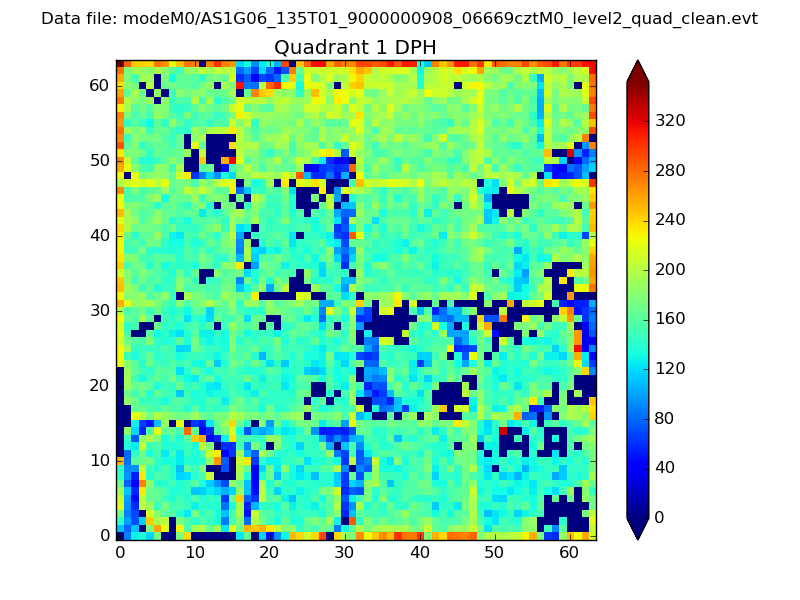 |
Quadrant B |
|---|---|---|---|
| Quadrant D | 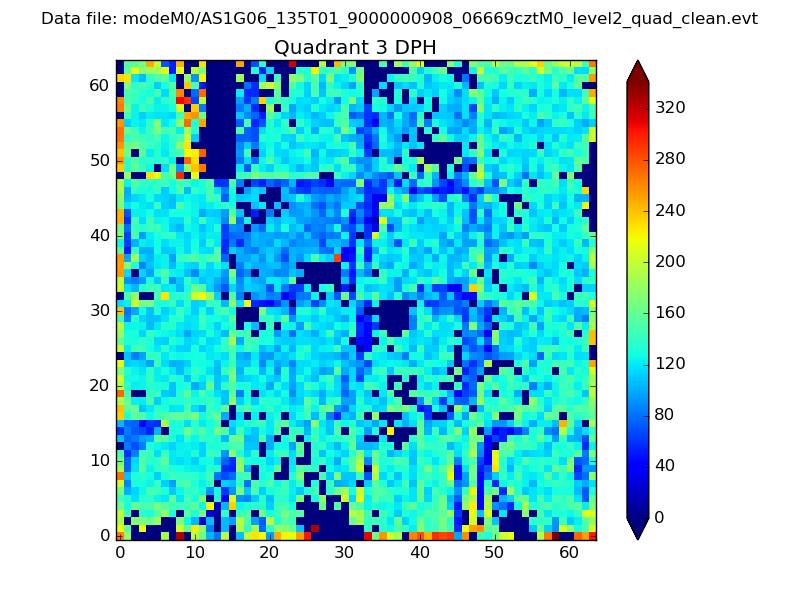 |
 |
Quadrant C |
| Plot type | Count rate plots | Images |
|---|---|---|
| Comparison with Poisson distribution Blue bars denote a histogram of data divided into 1 sec bins. Red curve is a Poisson curve with rate = median count rate of data. |
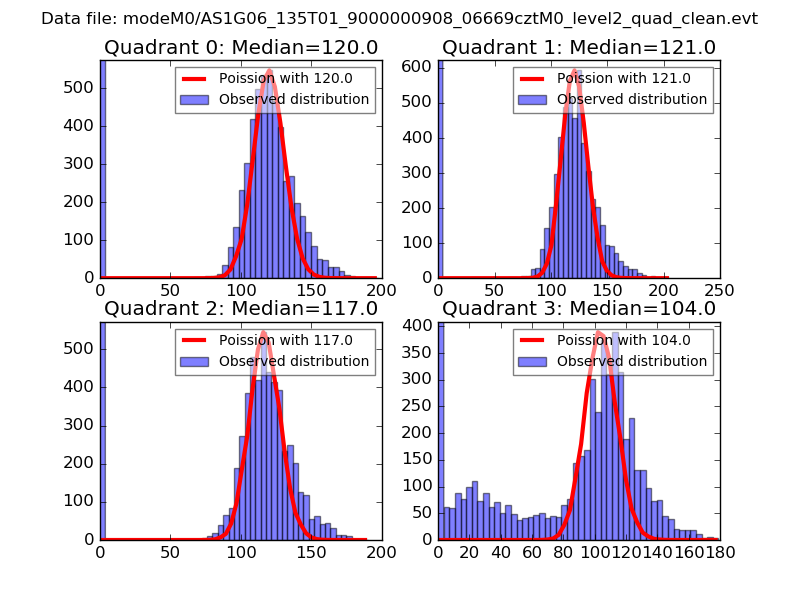 |
 |
| Quadrant-wise count rates Data is divided into 100 sec bins |
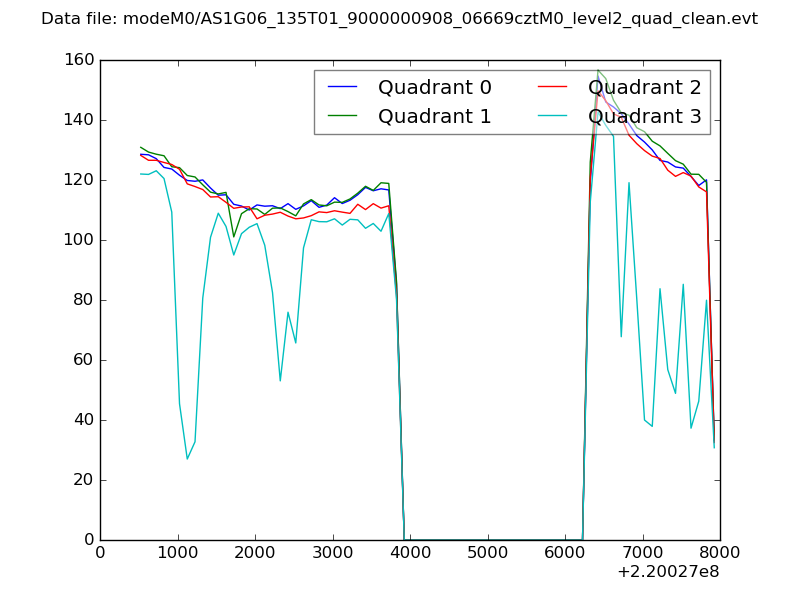 |
|
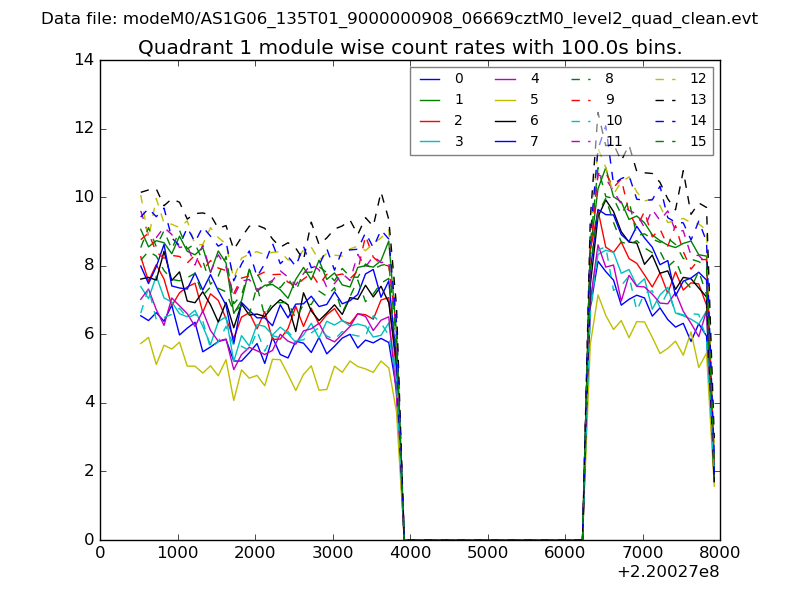
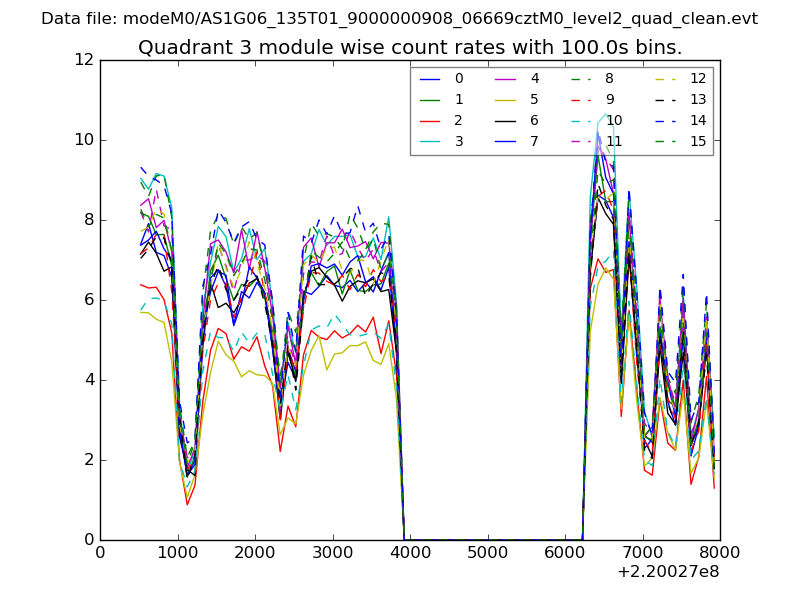
| Module-wise count rates for Quadrant A Data is divided into 100 sec bins |
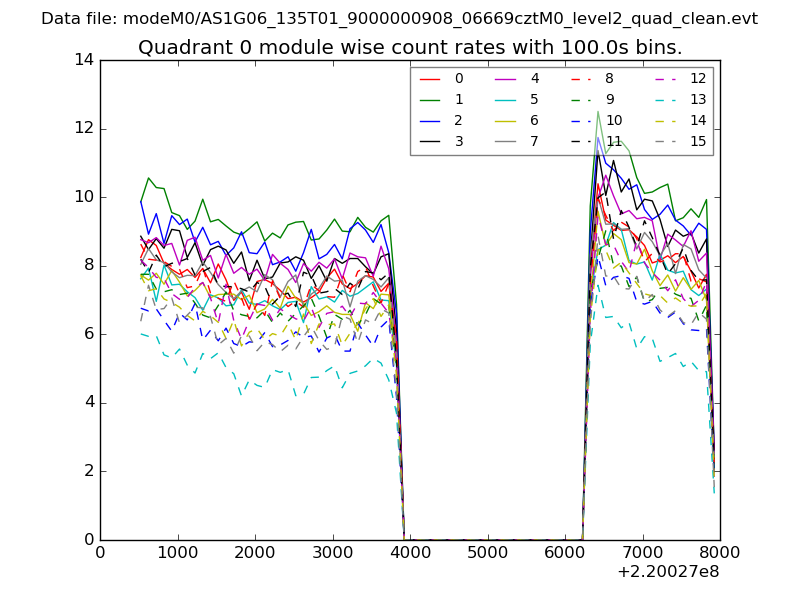 |
 |
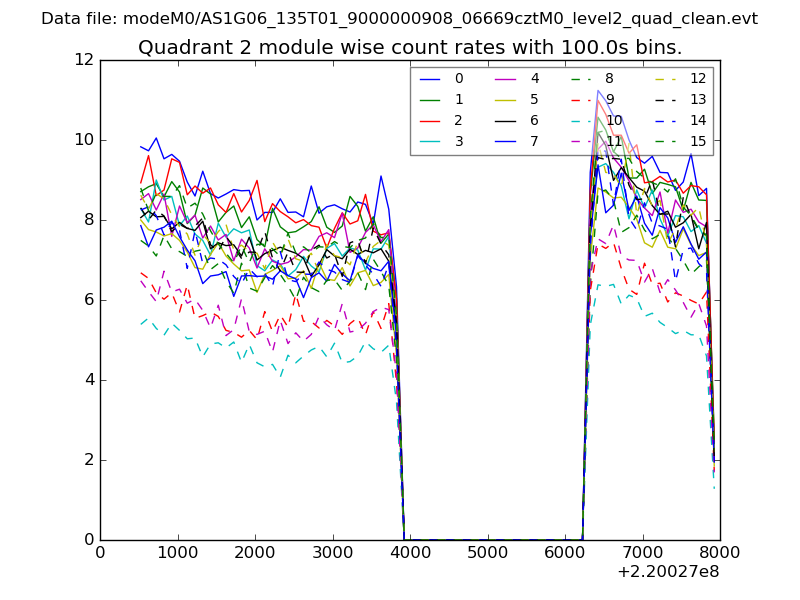
| Module-wise count rates for Quadrant B Data is divided into 100 sec bins |
 |
 |
| Module-wise count rates for Quadrant C Data is divided into 100 sec bins |
 |
 |
| Module-wise count rates for Quadrant D Data is divided into 100 sec bins |
 |
 |
| Parameter | Plot |
|---|---|
| CZT HV Monitor | 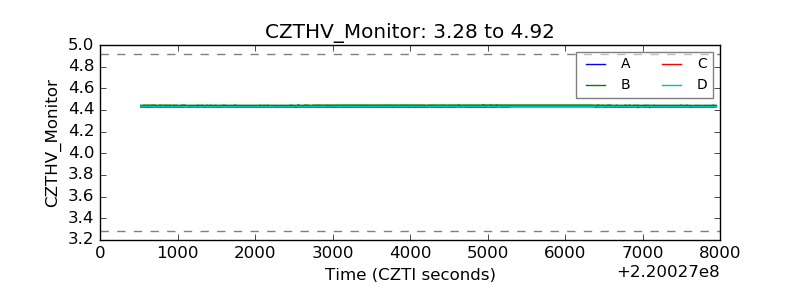 |
| D_VDD | 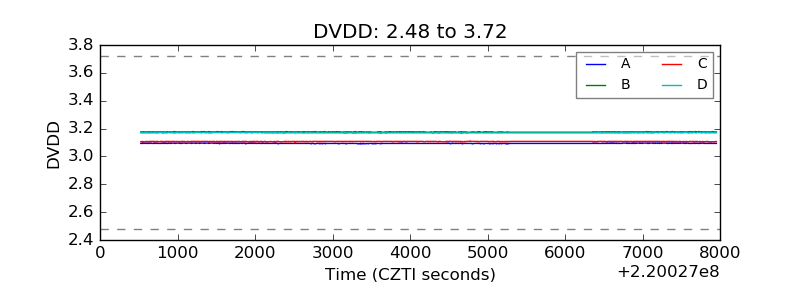 |
| Temperature 1 | 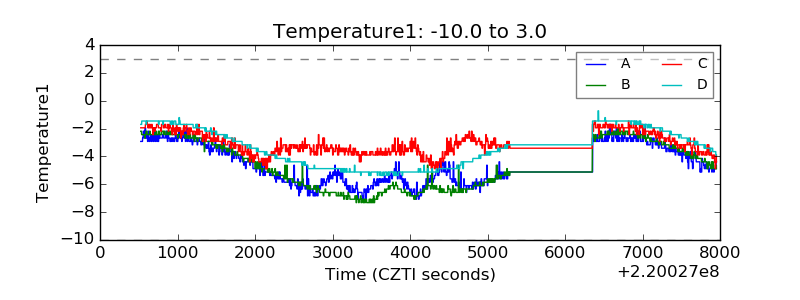 |
| Veto HV Monitor | 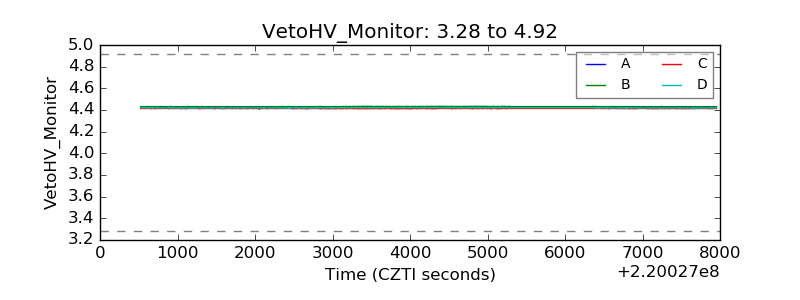 |
| Veto LLD | 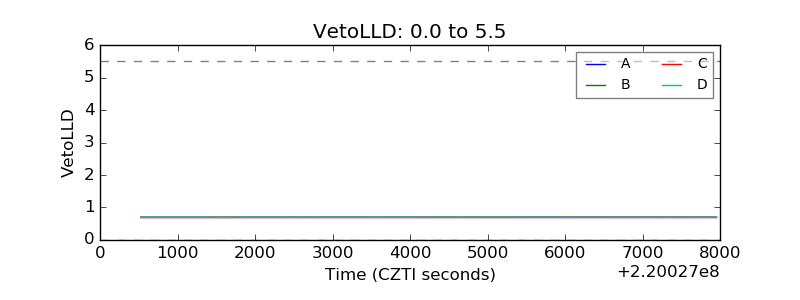 |
| Alpha Counter | 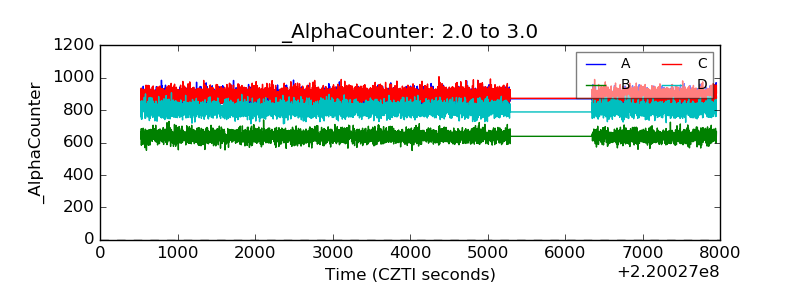 |
| _CPM_Rate | 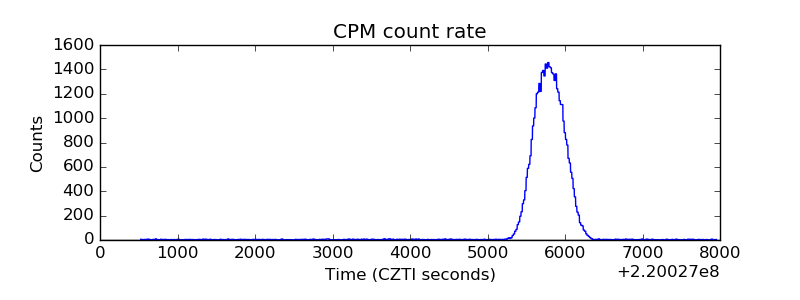 |
| CZT Counter | 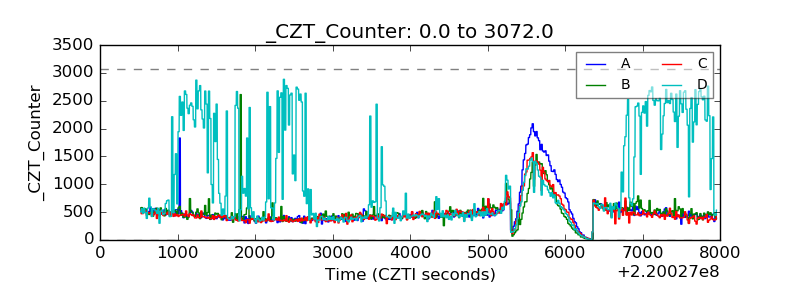 |
| +2.5 Volts monitor | 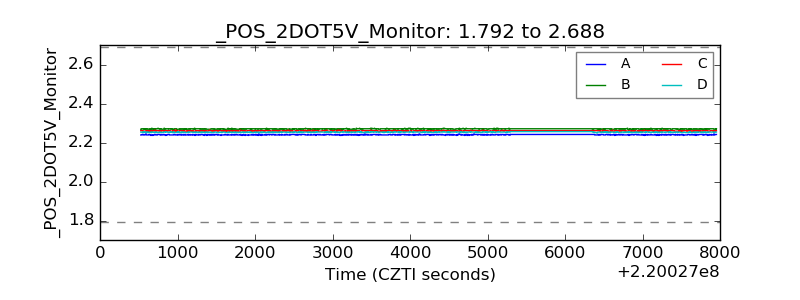 |
| +5 Volts monitor |  |
| _ROLL_ROT | 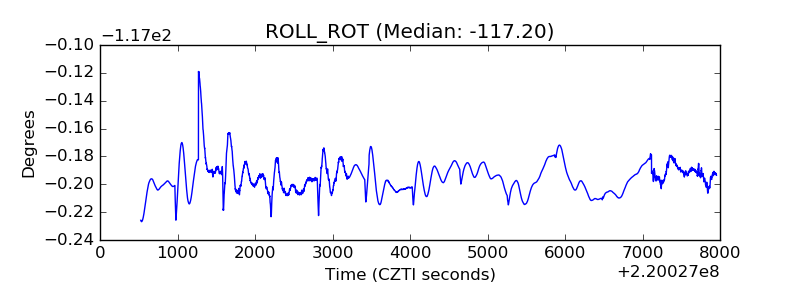 |
| _Roll_DEC | 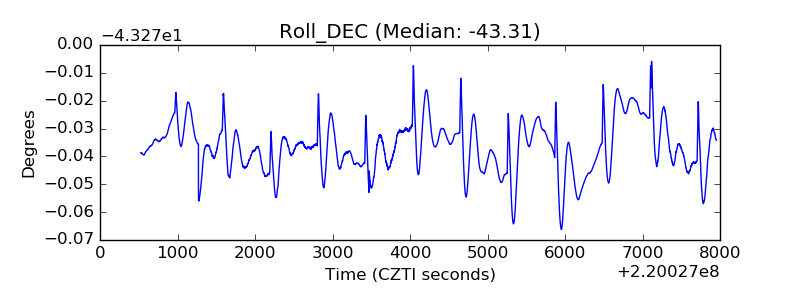 |
| _Roll_RA | 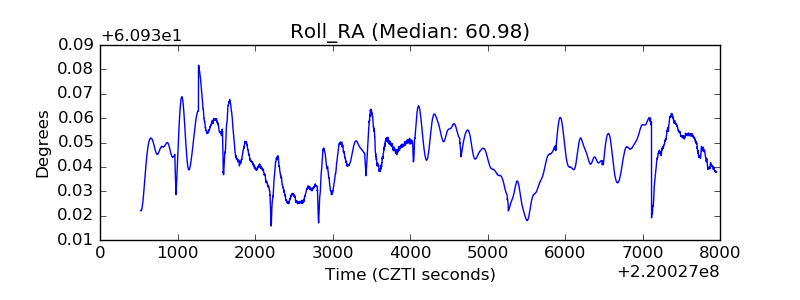 |
| Veto Counter | 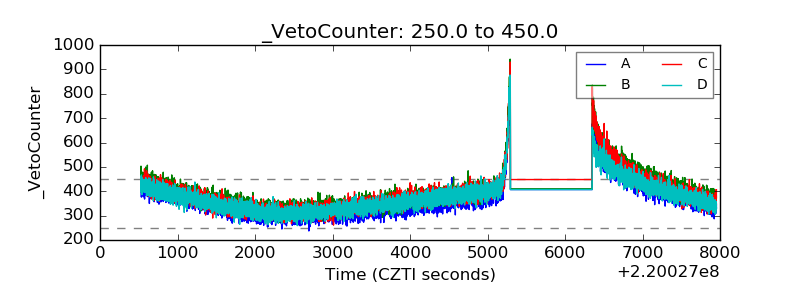 |