| Param | Original file | Final file |
|---|---|---|
| Filename | modeM0/AS1G06_135T01_9000000908_06670cztM0_level2.evt | modeM0/AS1G06_135T01_9000000908_06670cztM0_level2_quad_clean.evt |
| Size (bytes) | 142,223,040 | 21,513,600 |
| Size | 135.6 MB | 20.5 MB |
| Events in quadrant A | 566,213 | 156,354 |
| Events in quadrant B | 616,308 | 159,080 |
| Events in quadrant C | 530,213 | 153,611 |
| Events in quadrant D | 2,506,135 | 86,876 |
| Mode M0 | |||
|---|---|---|---|
| Quadrant | BADHDUFLAG | Total packets | Discarded packets |
| A | 0 | 2530 | 0 |
| B | 0 | 2633 | 0 |
| C | 0 | 2523 | 0 |
| D | 0 | 8304 | 0 |
| Mode SS | |||
|---|---|---|---|
| Quadrant | BADHDUFLAG | Total packets | Discarded packets |
| A | 0 | 26 | 0 |
| B | 0 | 26 | 0 |
| C | 0 | 26 | 0 |
| D | 0 | 26 | 0 |
| Quadrant | Total seconds | Saturated seconds | Saturation percentage |
|---|---|---|---|
| A | 1255 | 0 | 0.000000% |
| B | 1255 | 0 | 0.000000% |
| C | 1255 | 1 | 0.079681% |
| D | 1255 | 803 | 63.984064% |
Noise dominated data is calculated using 1-second bins in cleaned event files. If a bin has >2000 counts, and if more than 50% of those come from <1% of pixels, then it is considered to be noise-dominated and hence unusable.
| Quadrant | # 1 sec bins | Bins with >0 counts | Bins with >2000 counts | High rate bins dominated by noise | Noise dominated (total time) | Noise dominated (detector-on time) | Marked lightcurve |
|---|---|---|---|---|---|---|---|
| A | 1255 | 1255 | 0 | 0 | 0.00% | 0.00% | 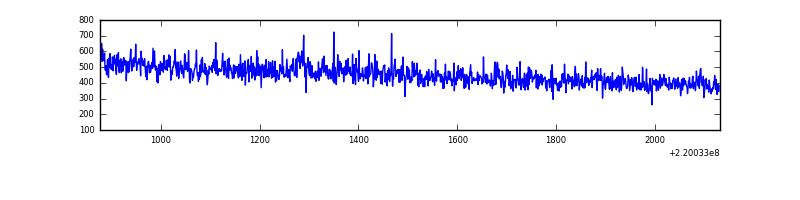 |
| B | 1255 | 1255 | 0 | 0 | 0.00% | 0.00% | 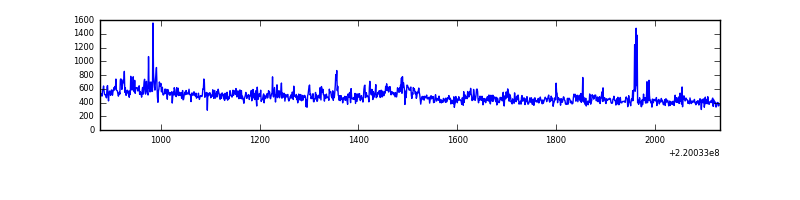 |
| C | 1255 | 1255 | 0 | 0 | 0.00% | 0.00% |  |
| D | 1255 | 1255 | 701 | 701 | 55.86% | 55.86% | 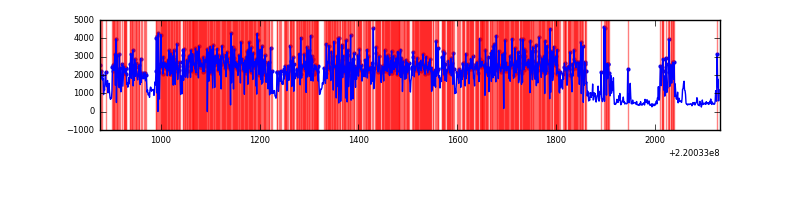 |
Top three noisy pixels from each quadrant. If the there are fewer than three noisy pixels in the level2.evt file, extra rows are filled as -1
| Pixel properties | Quadrant properties | ||||||
|---|---|---|---|---|---|---|---|
| Quadrant | DetID | PixID | Counts | Sigma | Mean | Median | Sigma |
| A | 8 | 15 | 4469 | 138.3 | 143 | 141 | 31.3 |
| A | 3 | 1 | 3806 | 117.12 | 143 | 141 | 31.3 |
| A | 4 | 2 | 1819 | 53.62 | 143 | 141 | 31.3 |
| B | 0 | 228 | 17777 | 577.8 | 144 | 141 | 30.5 |
| B | 4 | 80 | 15927 | 517.19 | 144 | 141 | 30.5 |
| B | 0 | 214 | 11358 | 367.5 | 144 | 141 | 30.5 |
| C | 9 | 247 | 5563 | 165.35 | 133 | 134 | 32.8 |
| C | 1 | 3 | 3408 | 99.72 | 133 | 134 | 32.8 |
| C | 13 | 61 | 1116 | 29.91 | 133 | 134 | 32.8 |
| D | 2 | 33 | 2085359 | 89505.07 | 86 | 82 | 23.3 |
| D | 2 | 63 | 51223 | 2195.09 | 86 | 82 | 23.3 |
| D | 12 | 221 | 13183 | 562.33 | 86 | 82 | 23.3 |
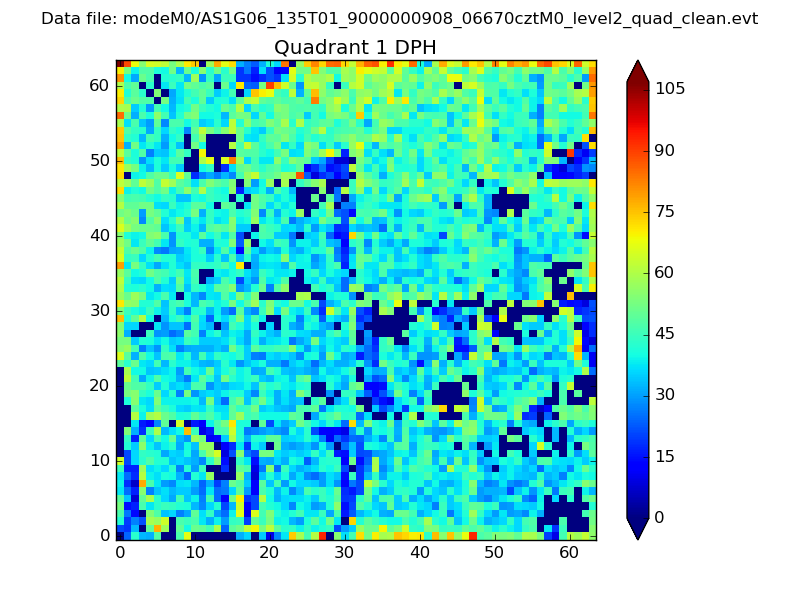
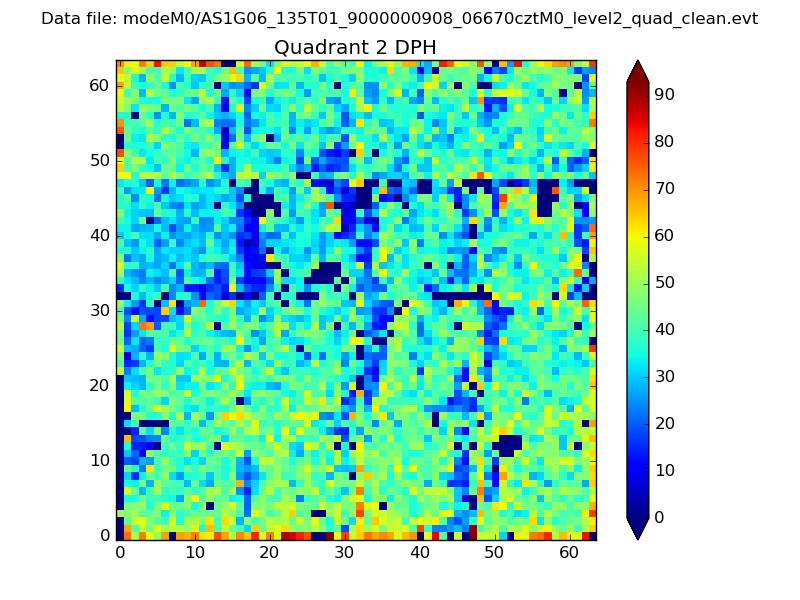
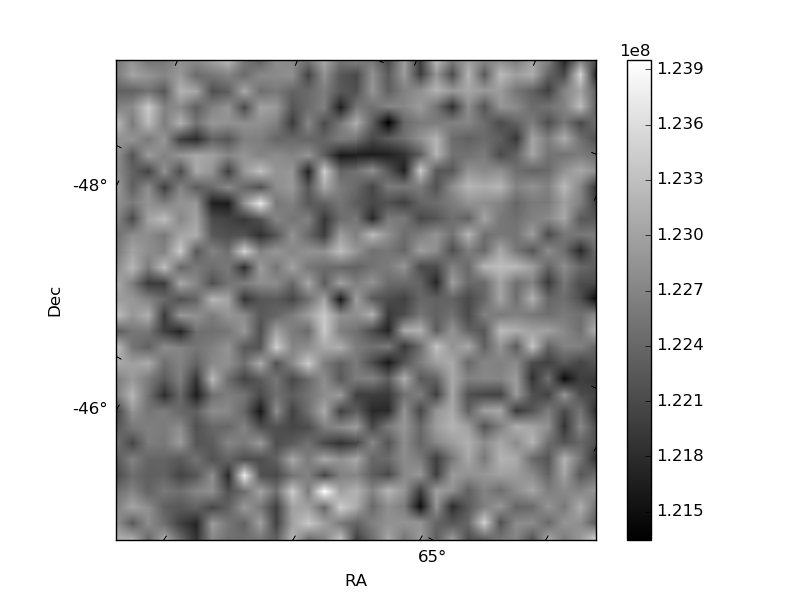
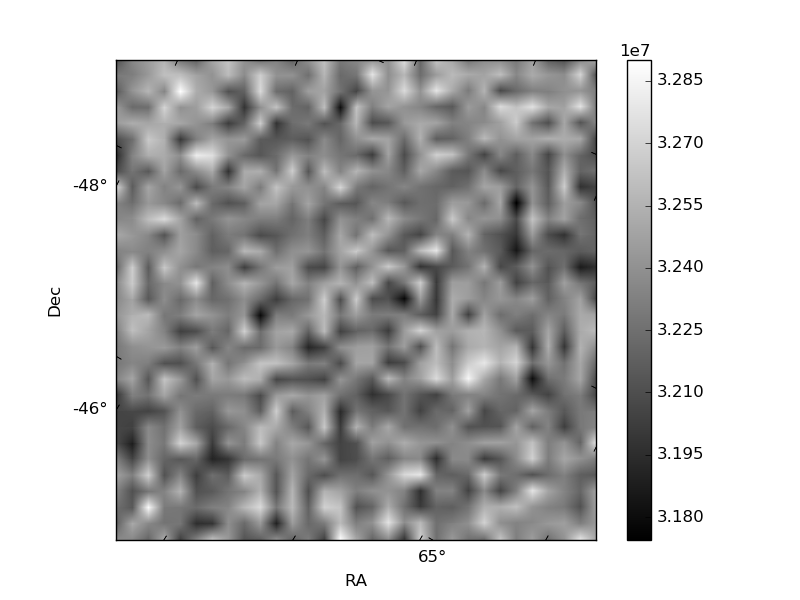
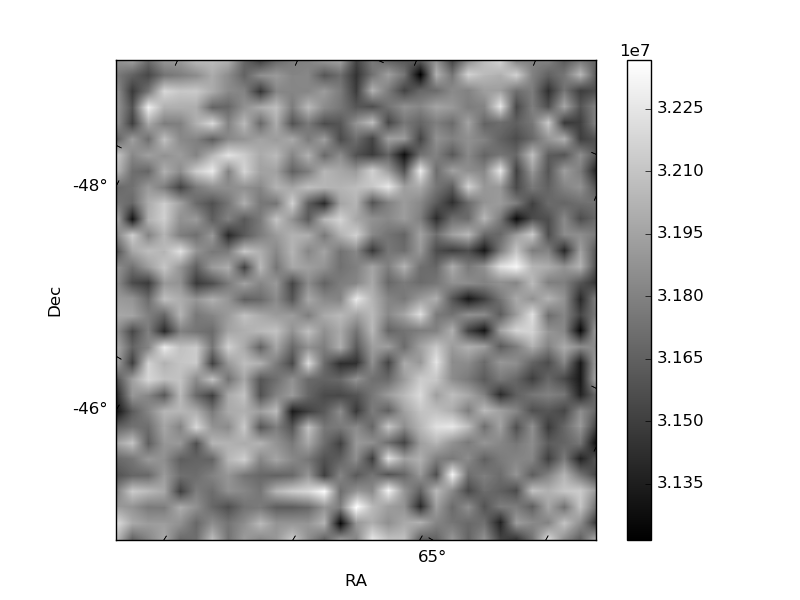
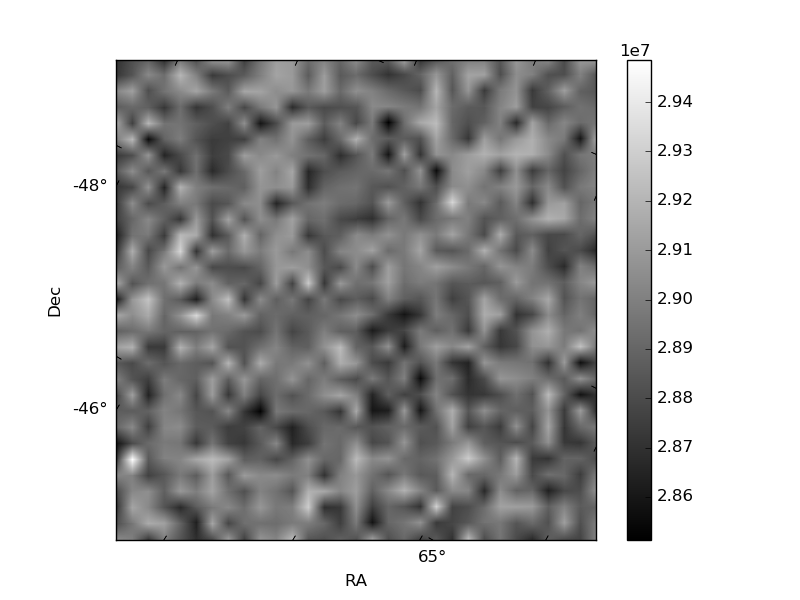
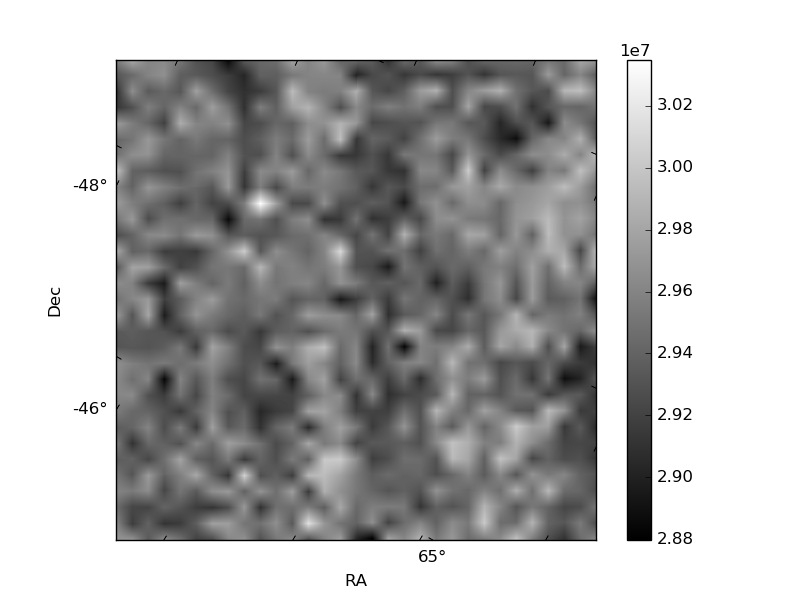
Histogram calculated using DETX and DETY for each event in the final _common_clean file
| Quadrant A | 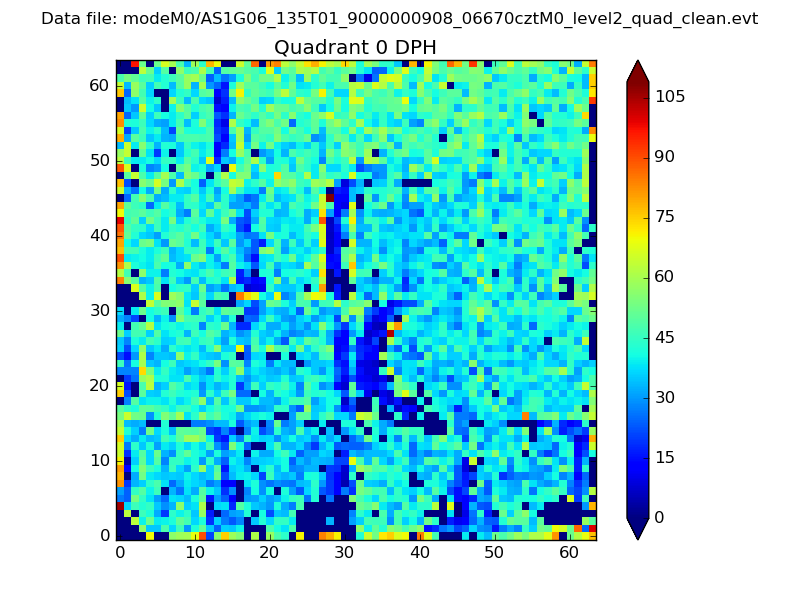 |
 |
Quadrant B |
|---|---|---|---|
| Quadrant D | 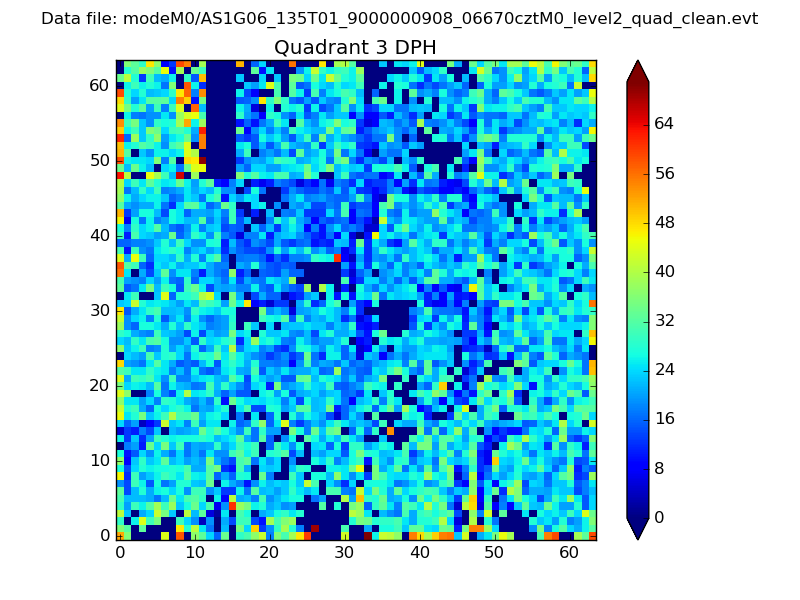 |
 |
Quadrant C |
| Plot type | Count rate plots | Images |
|---|---|---|
| Comparison with Poisson distribution Blue bars denote a histogram of data divided into 1 sec bins. Red curve is a Poisson curve with rate = median count rate of data. |
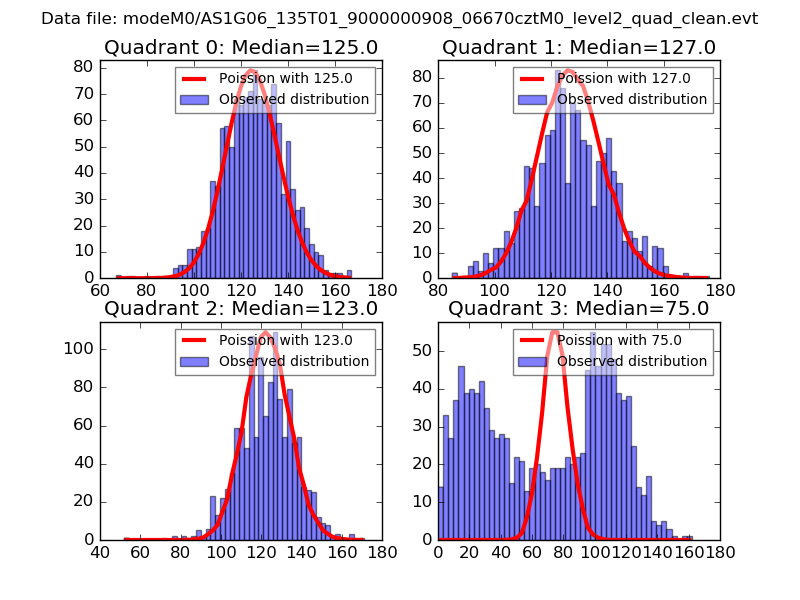 |
 |
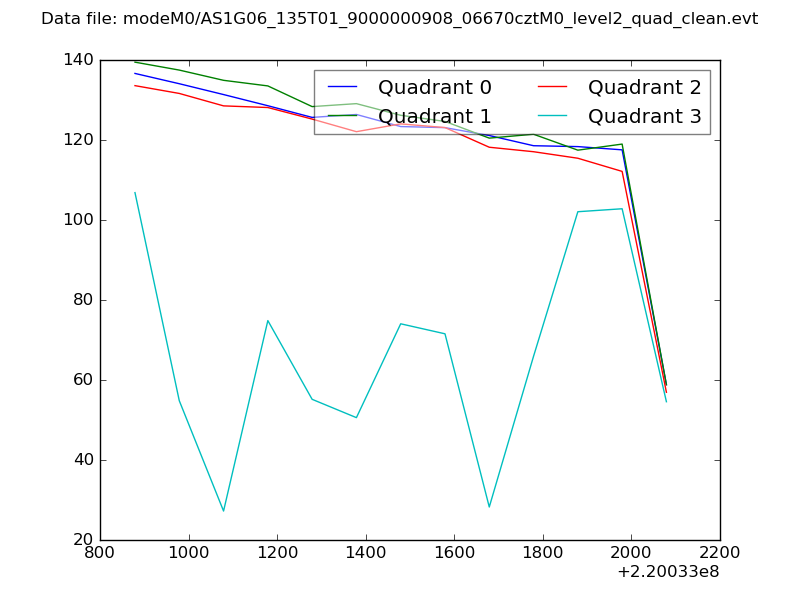
| Quadrant-wise count rates Data is divided into 100 sec bins |
 |
|
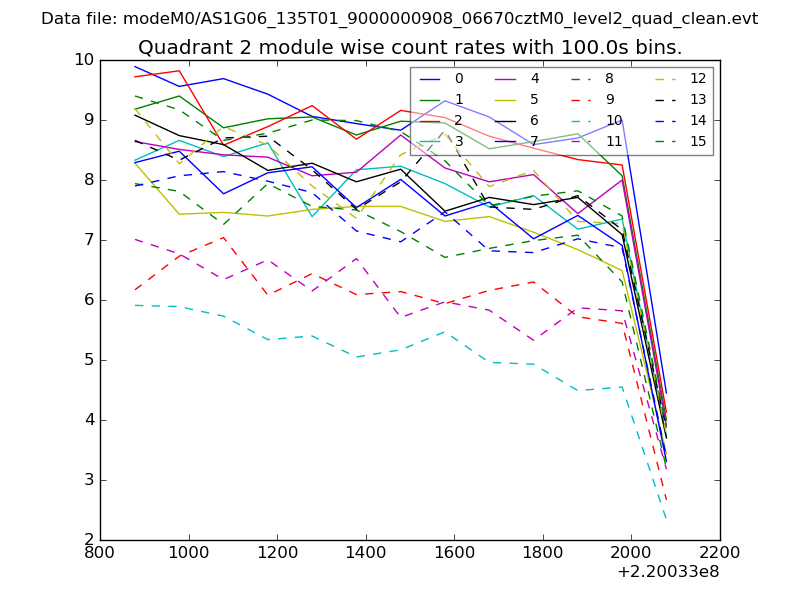
| Module-wise count rates for Quadrant A Data is divided into 100 sec bins |
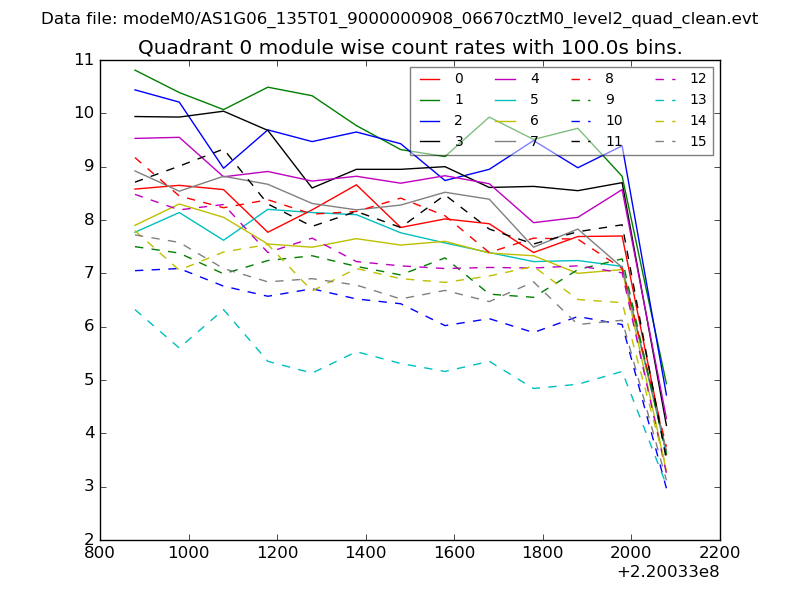 |
 |
| Module-wise count rates for Quadrant B Data is divided into 100 sec bins |
 |
 |
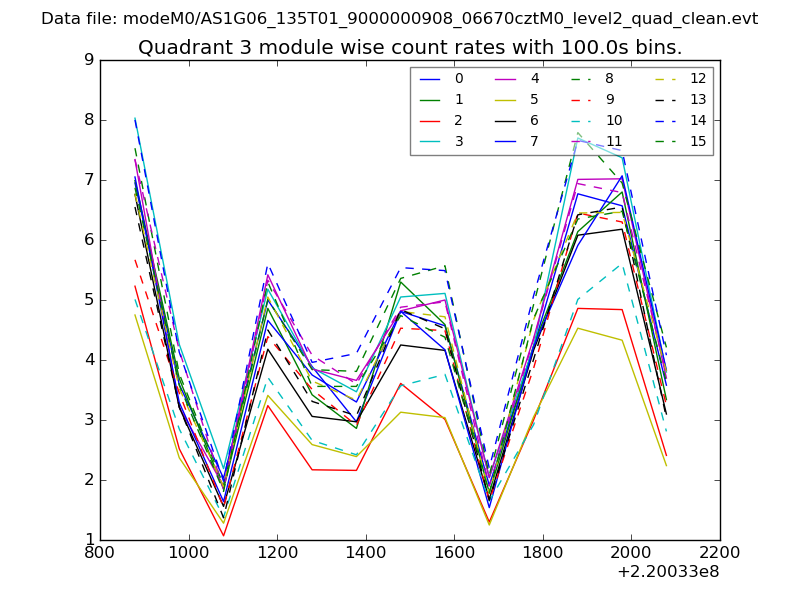
| Module-wise count rates for Quadrant C Data is divided into 100 sec bins |
 |
 |
| Module-wise count rates for Quadrant D Data is divided into 100 sec bins |
 |
 |
| Parameter | Plot |
|---|---|
| CZT HV Monitor |  |
| D_VDD | 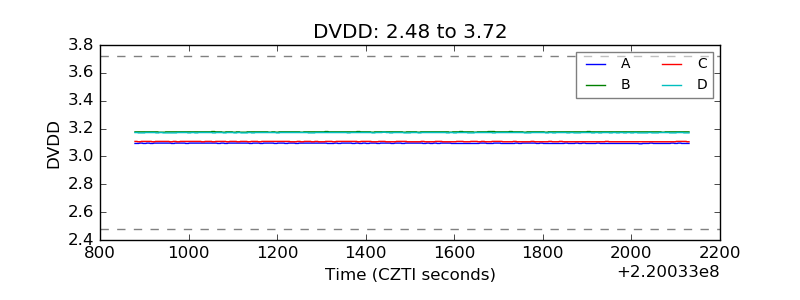 |
| Temperature 1 | 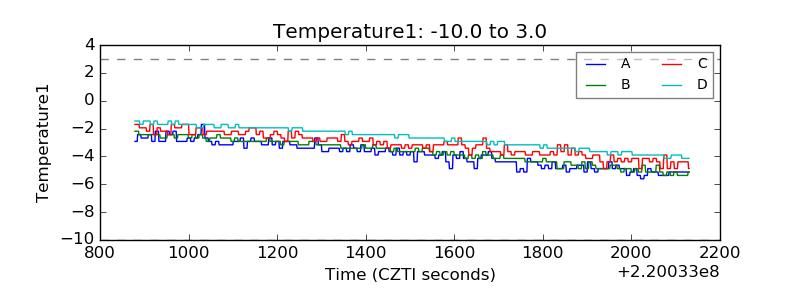 |
| Veto HV Monitor | 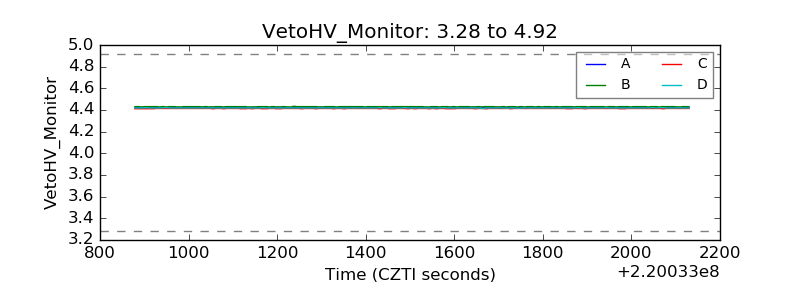 |
| Veto LLD | 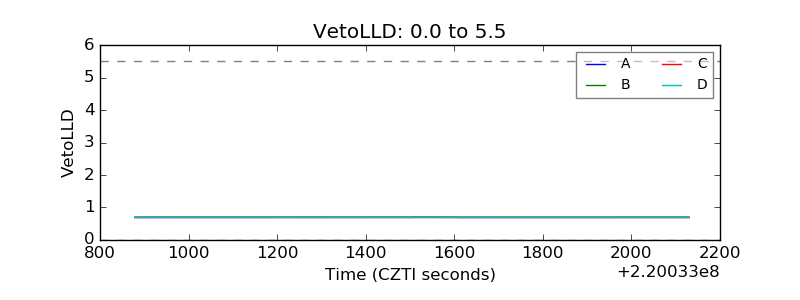 |
| Alpha Counter | 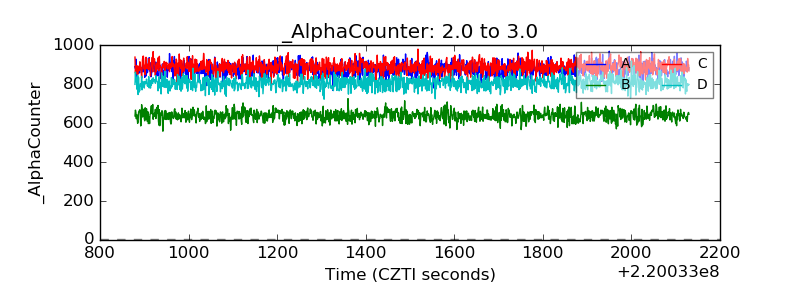 |
| _CPM_Rate | 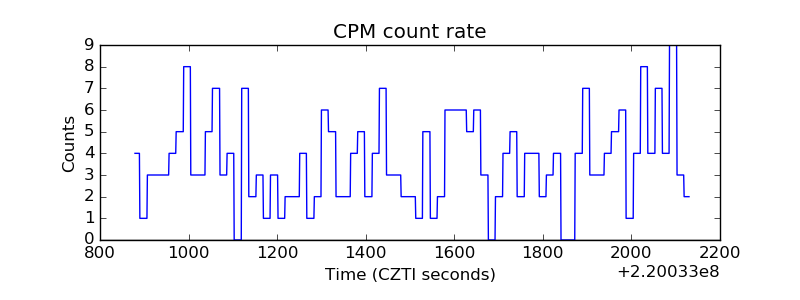 |
| CZT Counter | 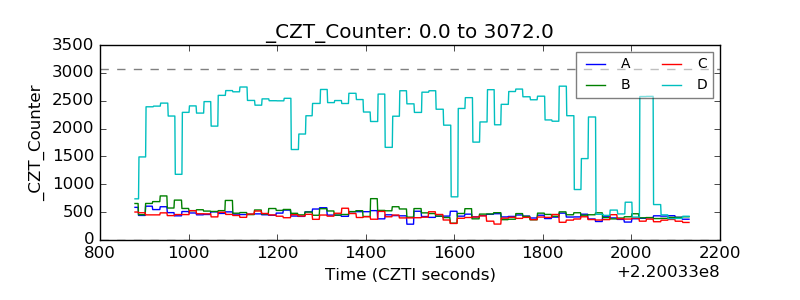 |
| +2.5 Volts monitor |  |
| +5 Volts monitor |  |
| _ROLL_ROT | 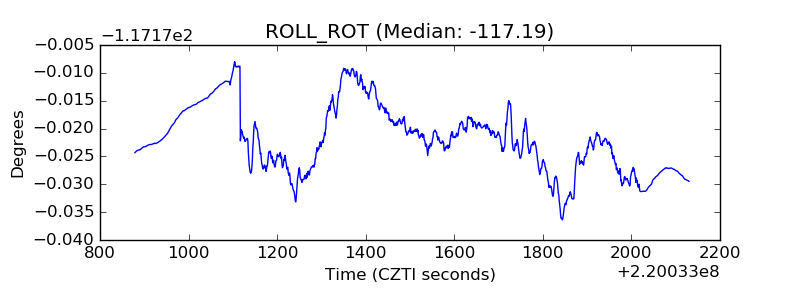 |
| _Roll_DEC | 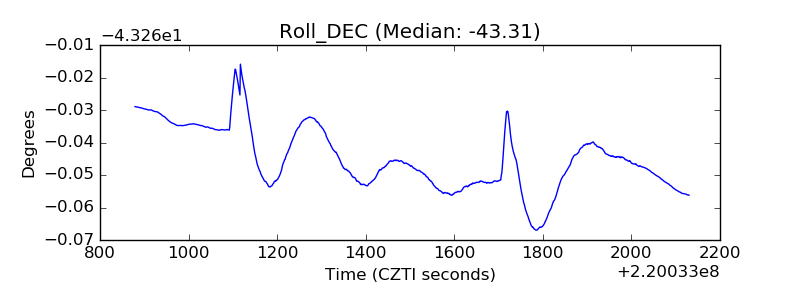 |
| _Roll_RA | 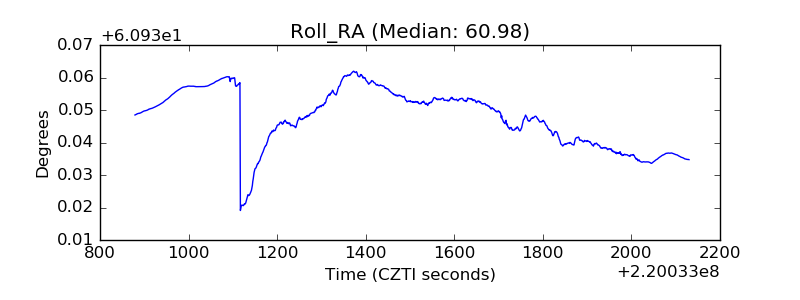 |
| Veto Counter |  |