| Param | Original file | Final file |
|---|---|---|
| Filename | modeM0/AS1G06_145T01_9000000914cztM0_level2.fits | modeM0/AS1G06_145T01_9000000914cztM0_level2_quad_clean.evt |
| Size (bytes) | 140,086,080 | 118,474,560 |
| Size | 133.6 MB | 113.0 MB |
| Events in quadrant A | 847,982 | 665,805 |
| Events in quadrant B | 828,510 | 684,820 |
| Events in quadrant C | 857,016 | 662,210 |
| Events in quadrant D | 675,846 | 541,581 |
| Mode SS | |||
|---|---|---|---|
| Quadrant | BADHDUFLAG | Total packets | Discarded packets |
| A | 0 | 306 | 0 |
| B | 0 | 306 | 0 |
| C | 0 | 306 | 0 |
| D | 0 | 306 | 0 |
| Mode M9 | |||
|---|---|---|---|
| Quadrant | BADHDUFLAG | Total packets | Discarded packets |
| A | 0 | 38 | 0 |
| B | 0 | 38 | 0 |
| C | 0 | 38 | 0 |
| D | 0 | 38 | 0 |
| Mode M0 | |||
|---|---|---|---|
| Quadrant | BADHDUFLAG | Total packets | Discarded packets |
| A | 0 | 31279 | 0 |
| B | 0 | 32393 | 0 |
| C | 0 | 30535 | 0 |
| D | 0 | 58830 | 0 |
| Quadrant | Total seconds | Saturated seconds | Saturation percentage |
|---|---|---|---|
| A | 14960 | 124 | 0.828877% |
| B | 14960 | 159 | 1.062834% |
| C | 14960 | 52 | 0.347594% |
| D | 14960 | 1783 | 11.918449% |
Noise dominated data is calculated using 1-second bins in cleaned event files. If a bin has >2000 counts, and if more than 50% of those come from <1% of pixels, then it is considered to be noise-dominated and hence unusable.
| Quadrant | # 1 sec bins | Bins with >0 counts | Bins with >2000 counts | High rate bins dominated by noise | Noise dominated (total time) | Noise dominated (detector-on time) | Marked lightcurve |
|---|---|---|---|---|---|---|---|
| A | 17534 | 14956 | 0 | 0 | 0.00% | 0.00% |  |
| B | 17534 | 14959 | 0 | 0 | 0.00% | 0.00% | 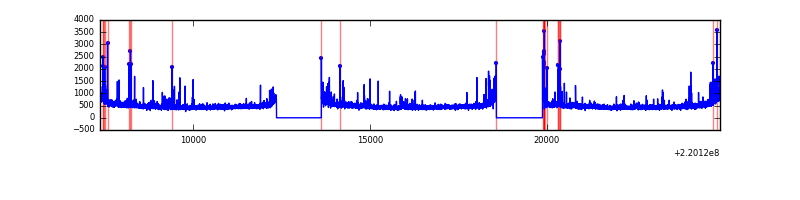 |
| C | 17534 | 14959 | 0 | 0 | 0.00% | 0.00% |  |
| D | 17534 | 14934 | 0 | 0 | 0.00% | 0.00% | 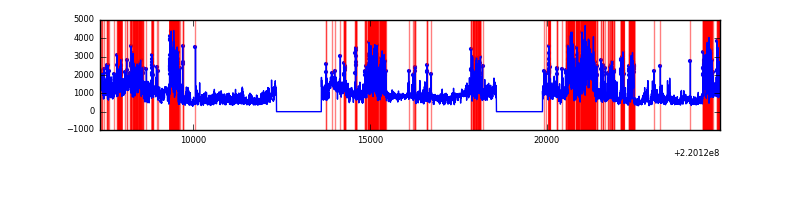 |
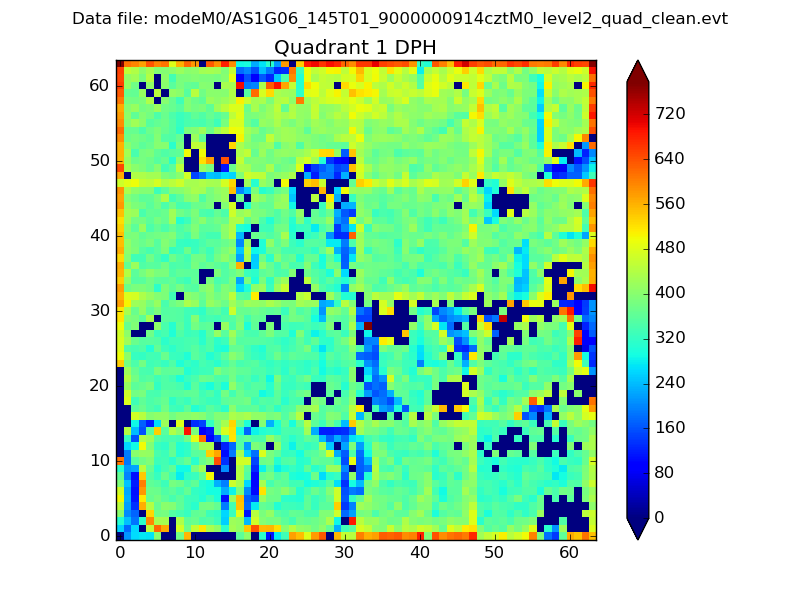
Top three noisy pixels from each quadrant. If the there are fewer than three noisy pixels in the level2.evt file, extra rows are filled as -1
| Pixel properties | Quadrant properties | ||||||
|---|---|---|---|---|---|---|---|
| Quadrant | DetID | PixID | Counts | Sigma | Mean | Median | Sigma |
| A | 0 | 29 | 806 | 10.57 | 220 | 207 | 56.7 |
| A | 7 | 110 | 703 | 8.75 | 220 | 207 | 56.7 |
| A | 0 | 30 | 660 | 7.99 | 220 | 207 | 56.7 |
| B | 2 | 9 | 720 | 11.15 | 219 | 210 | 45.7 |
| B | 12 | 226 | 641 | 9.42 | 219 | 210 | 45.7 |
| B | 5 | 128 | 635 | 9.29 | 219 | 210 | 45.7 |
| C | 1 | 81 | 678 | 7.76 | 226 | 212 | 60.0 |
| C | 1 | 80 | 634 | 7.03 | 226 | 212 | 60.0 |
| C | 1 | 65 | 600 | 6.46 | 226 | 212 | 60.0 |
| D | 6 | 83 | 517 | 6.38 | 193 | 176 | 53.4 |
| D | 10 | 189 | 503 | 6.12 | 193 | 176 | 53.4 |
| D | 7 | 5 | 498 | 6.03 | 193 | 176 | 53.4 |
Histogram calculated using DETX and DETY for each event in the final _common_clean file
| Quadrant A |  |
 |
Quadrant B |
|---|---|---|---|
| Quadrant D |  |
 |
Quadrant C |
| Plot type | Count rate plots | Images |
|---|---|---|
| Comparison with Poisson distribution Blue bars denote a histogram of data divided into 1 sec bins. Red curve is a Poisson curve with rate = median count rate of data. |
 |
 |
| Quadrant-wise count rates Data is divided into 100 sec bins |
 |
|
| Module-wise count rates for Quadrant A Data is divided into 100 sec bins |
 |
 |
| Module-wise count rates for Quadrant B Data is divided into 100 sec bins |
 |
 |
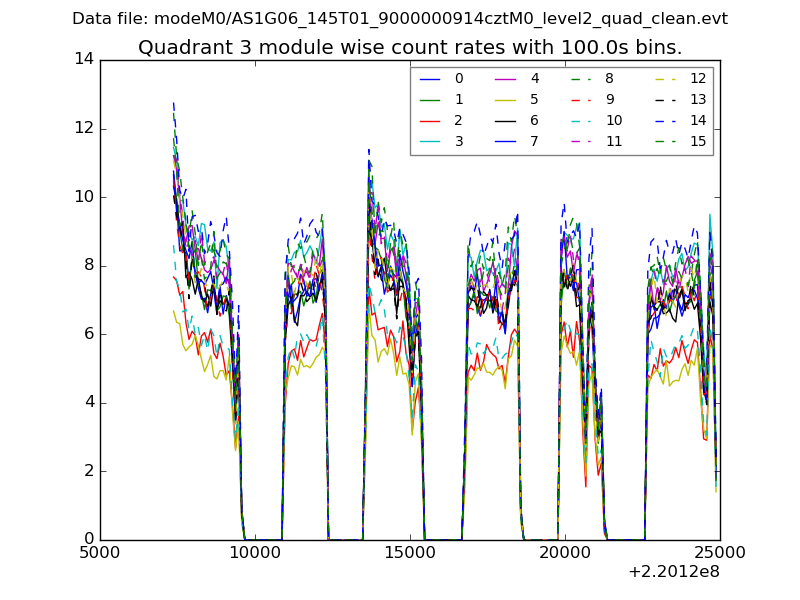
| Module-wise count rates for Quadrant C Data is divided into 100 sec bins |
 |
 |
| Module-wise count rates for Quadrant D Data is divided into 100 sec bins |
 |
 |
| Parameter | Plot |
|---|---|
| CZT HV Monitor |  |
| D_VDD |  |
| Temperature 1 |  |
| Veto HV Monitor | 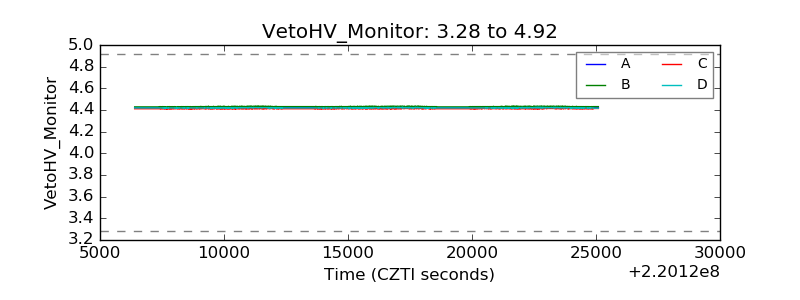 |
| Veto LLD | 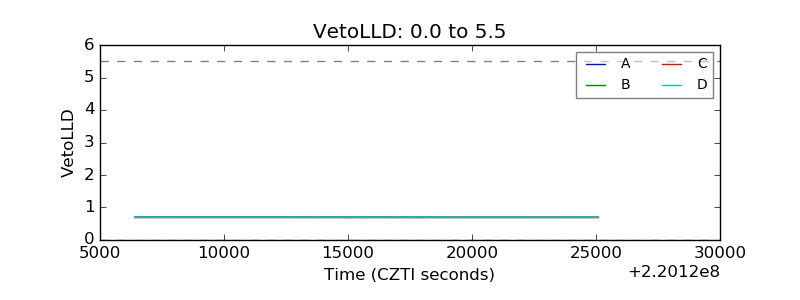 |
| Alpha Counter |  |
| _CPM_Rate |  |
| CZT Counter | 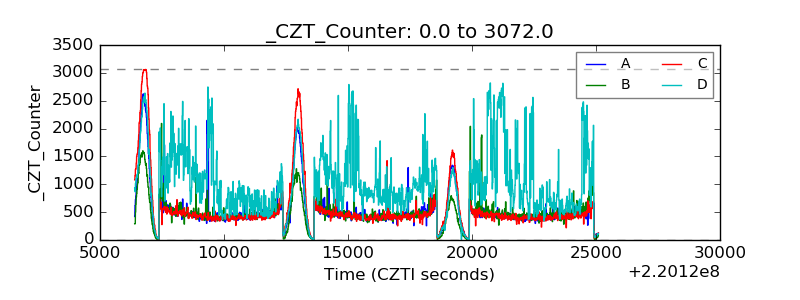 |
| +2.5 Volts monitor |  |
| +5 Volts monitor |  |
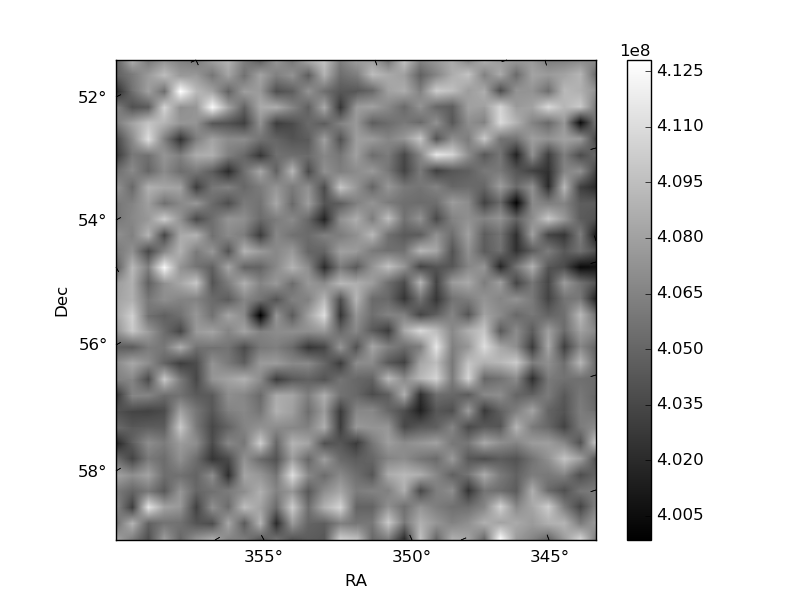
| _ROLL_ROT | 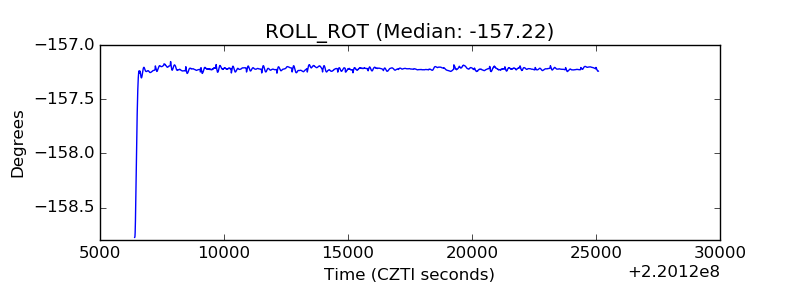 |
| _Roll_DEC |  |
| _Roll_RA | 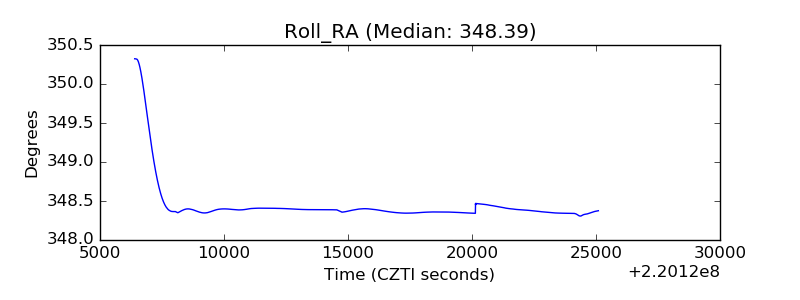 |
| Veto Counter |  |