| Param | Original file | Final file |
|---|---|---|
| Filename | modeM0/AS1G06_145T01_9000000914_06686cztM0_level2.evt | modeM0/AS1G06_145T01_9000000914_06686cztM0_level2_quad_clean.evt |
| Size (bytes) | 542,885,760 | 101,062,080 |
| Size | 517.7 MB | 96.4 MB |
| Events in quadrant A | 3,096,525 | 659,865 |
| Events in quadrant B | 3,245,474 | 679,469 |
| Events in quadrant C | 2,931,857 | 676,772 |
| Events in quadrant D | 6,737,361 | 601,400 |
| Mode SS | |||
|---|---|---|---|
| Quadrant | BADHDUFLAG | Total packets | Discarded packets |
| A | 0 | 128 | 0 |
| B | 0 | 128 | 0 |
| C | 0 | 128 | 0 |
| D | 0 | 128 | 0 |
| Mode M9 | |||
|---|---|---|---|
| Quadrant | BADHDUFLAG | Total packets | Discarded packets |
| A | 0 | 16 | 0 |
| B | 0 | 16 | 0 |
| C | 0 | 16 | 0 |
| D | 0 | 17 | 0 |
| Mode M0 | |||
|---|---|---|---|
| Quadrant | BADHDUFLAG | Total packets | Discarded packets |
| A | 0 | 13568 | 3 |
| B | 0 | 13898 | 2 |
| C | 0 | 13058 | 2 |
| D | 0 | 24428 | 2 |
| Quadrant | Total seconds | Saturated seconds | Saturation percentage |
|---|---|---|---|
| A | 6351 | 93 | 1.464336% |
| B | 6351 | 62 | 0.976224% |
| C | 6351 | 33 | 0.519603% |
| D | 6351 | 505 | 7.951504% |
Noise dominated data is calculated using 1-second bins in cleaned event files. If a bin has >2000 counts, and if more than 50% of those come from <1% of pixels, then it is considered to be noise-dominated and hence unusable.
| Quadrant | # 1 sec bins | Bins with >0 counts | Bins with >2000 counts | High rate bins dominated by noise | Noise dominated (total time) | Noise dominated (detector-on time) | Marked lightcurve |
|---|---|---|---|---|---|---|---|
| A | 7621 | 6352 | 25 | 25 | 0.33% | 0.39% | 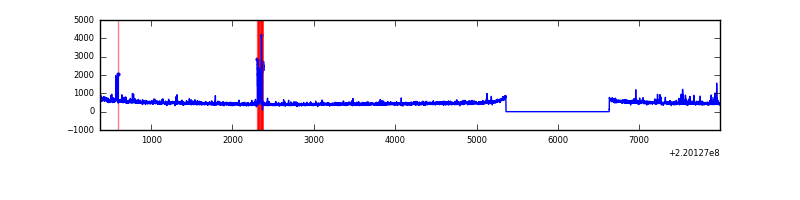 |
| B | 7621 | 6352 | 11 | 11 | 0.14% | 0.17% | 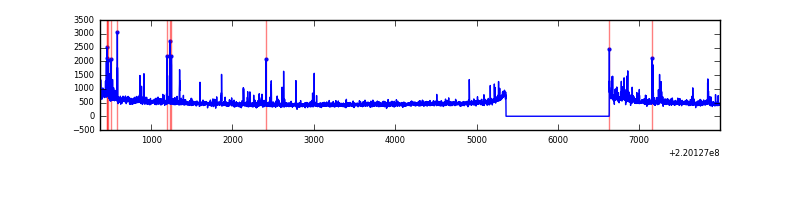 |
| C | 7621 | 6352 | 0 | 0 | 0.00% | 0.00% | 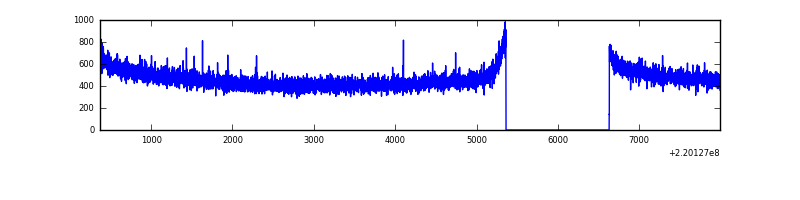 |
| D | 7621 | 6352 | 343 | 343 | 4.50% | 5.40% | 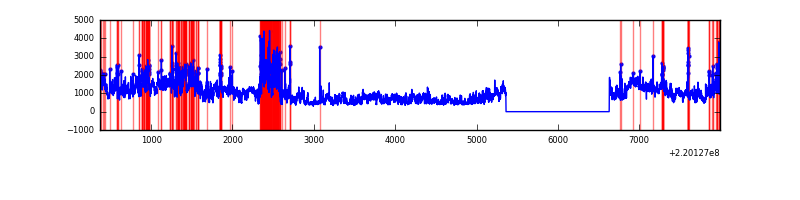 |
Top three noisy pixels from each quadrant. If the there are fewer than three noisy pixels in the level2.evt file, extra rows are filled as -1
| Pixel properties | Quadrant properties | ||||||
|---|---|---|---|---|---|---|---|
| Quadrant | DetID | PixID | Counts | Sigma | Mean | Median | Sigma |
| A | 14 | 111 | 136059 | 902.69 | 747 | 731 | 149.9 |
| A | 8 | 15 | 71424 | 471.55 | 747 | 731 | 149.9 |
| A | 12 | 194 | 7816 | 47.26 | 747 | 731 | 149.9 |
| B | 0 | 219 | 112309 | 789.02 | 762 | 745 | 141.4 |
| B | 4 | 80 | 36389 | 252.09 | 762 | 745 | 141.4 |
| B | 4 | 81 | 31065 | 214.43 | 762 | 745 | 141.4 |
| C | 13 | 61 | 5921 | 30.33 | 747 | 750 | 170.5 |
| C | 8 | 128 | 4652 | 22.88 | 747 | 750 | 170.5 |
| C | 12 | 4 | 4203 | 20.25 | 747 | 750 | 170.5 |
| D | 8 | 195 | 2616524 | 15144.07 | 720 | 701 | 172.7 |
| D | 2 | 33 | 666515 | 3854.67 | 720 | 701 | 172.7 |
| D | 12 | 221 | 389638 | 2251.72 | 720 | 701 | 172.7 |
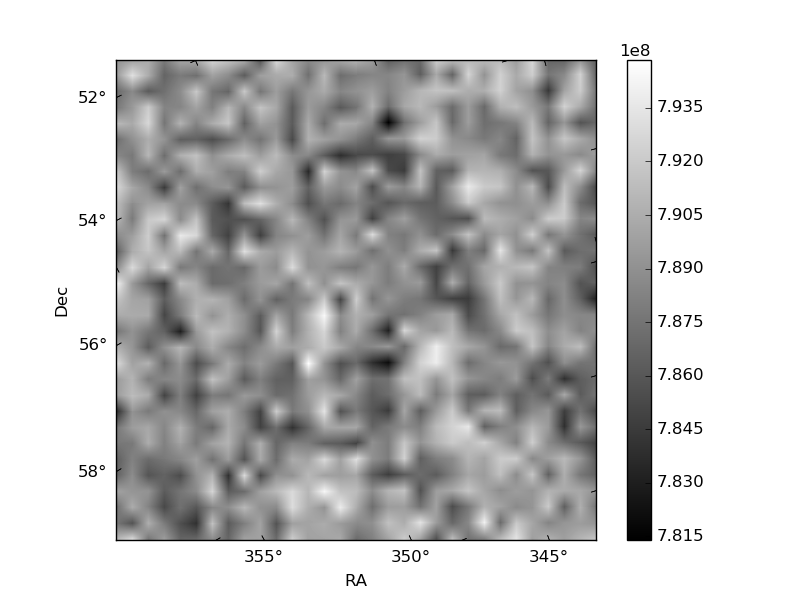
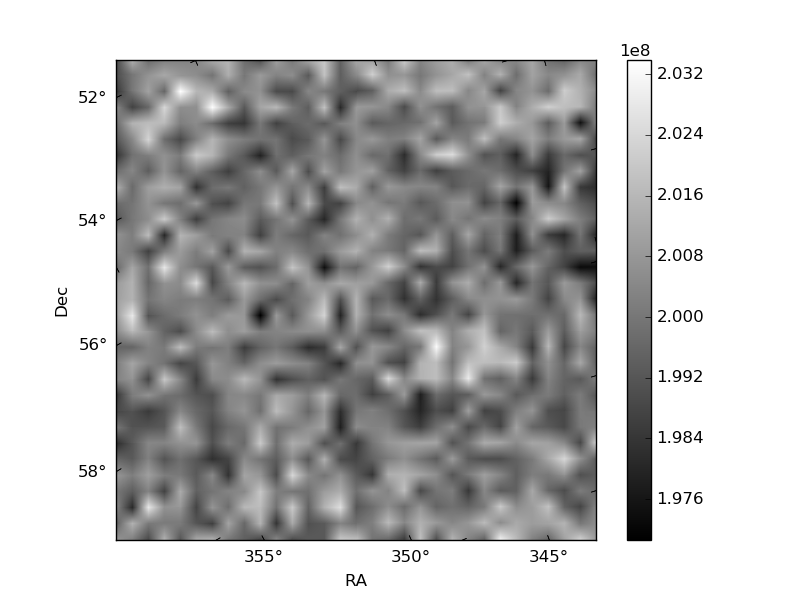
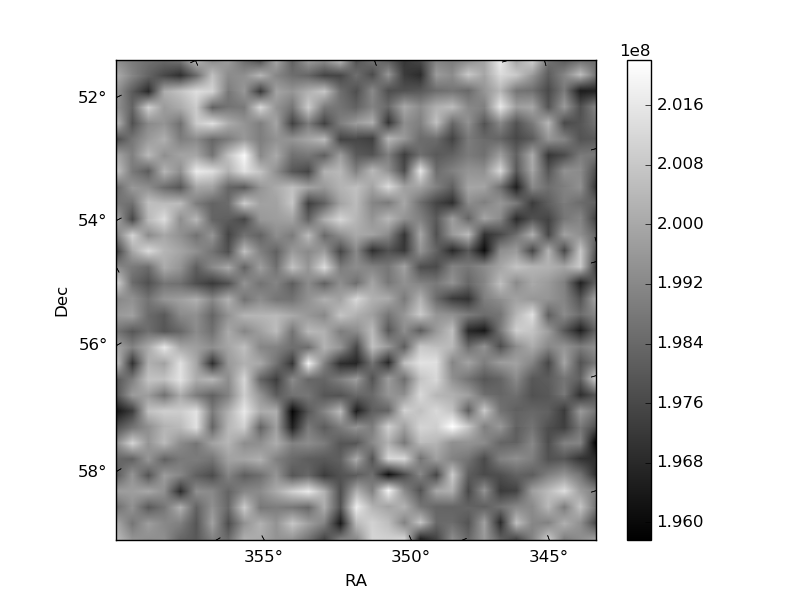
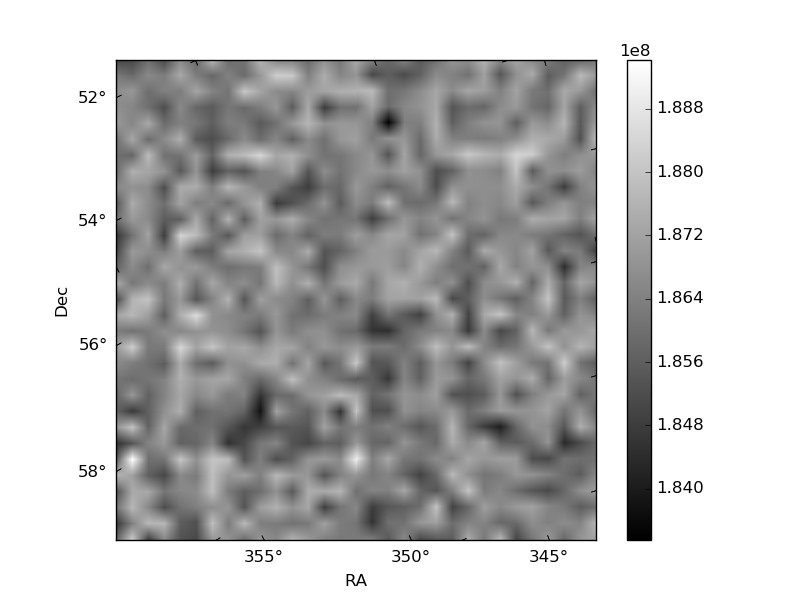
Histogram calculated using DETX and DETY for each event in the final _common_clean file
| Quadrant A | 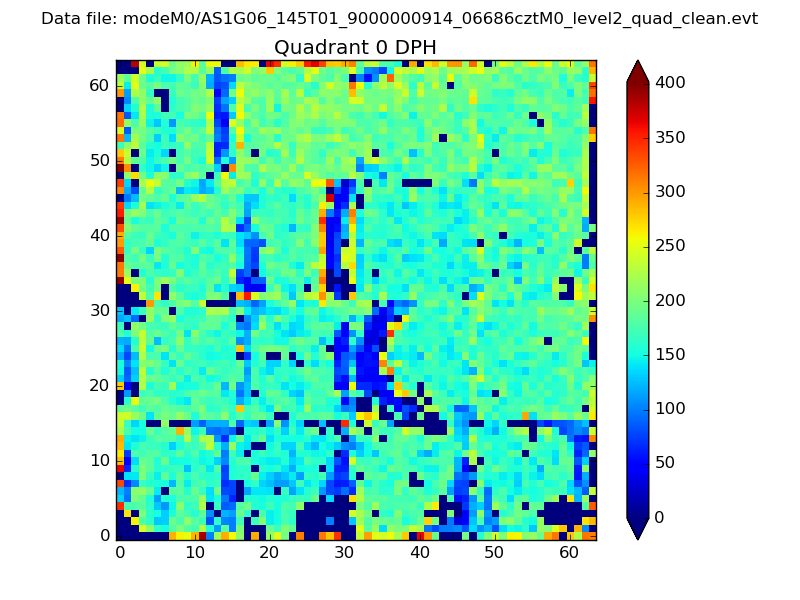 |
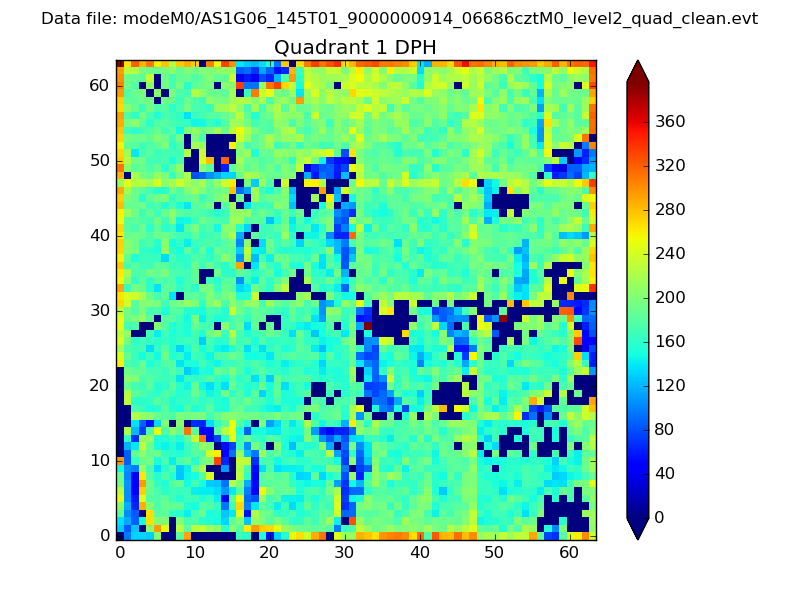 |
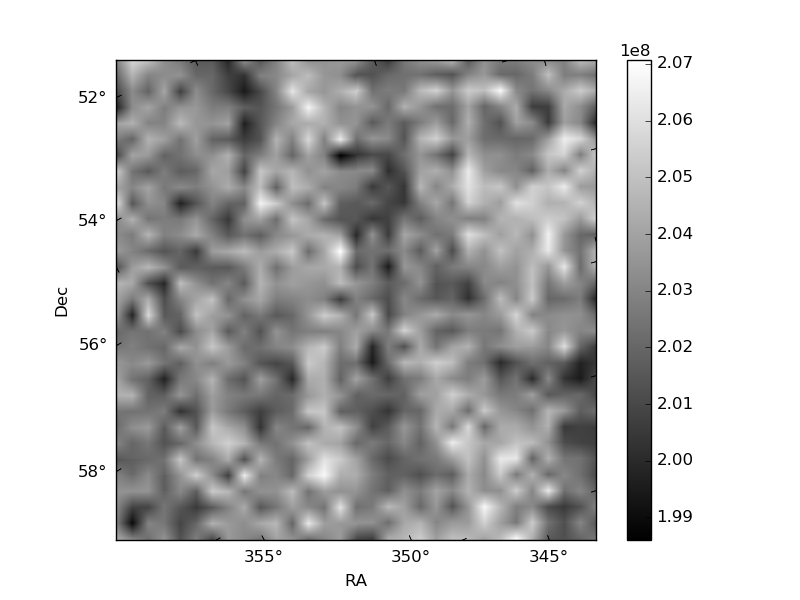
Quadrant B |
|---|---|---|---|
| Quadrant D | 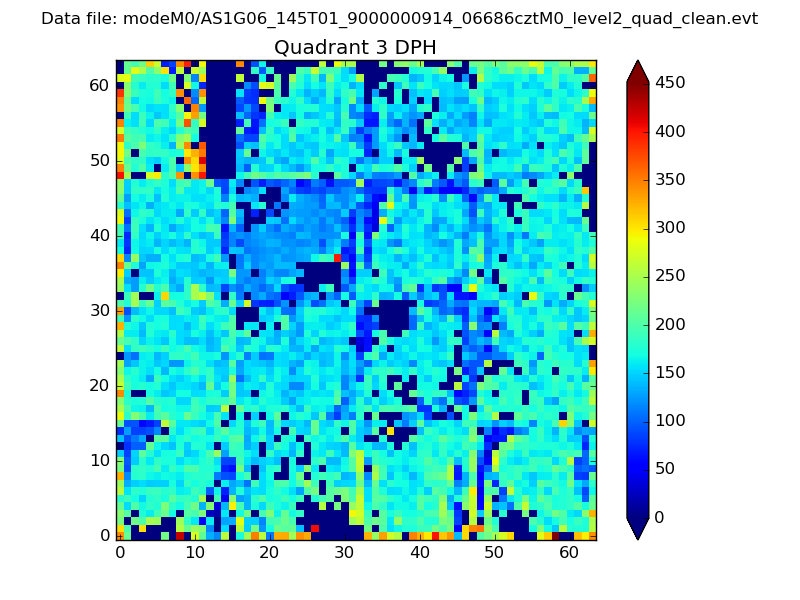 |
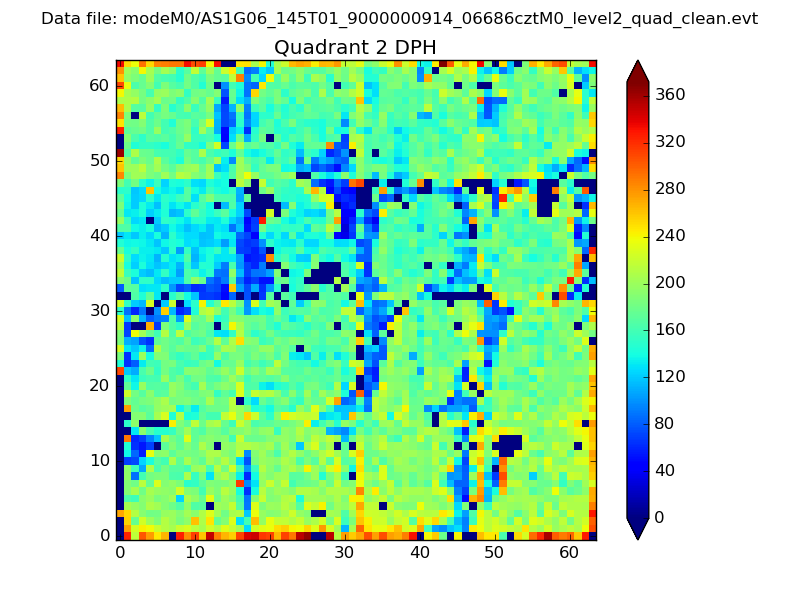 |
Quadrant C |
| Plot type | Count rate plots | Images |
|---|---|---|
| Comparison with Poisson distribution Blue bars denote a histogram of data divided into 1 sec bins. Red curve is a Poisson curve with rate = median count rate of data. |
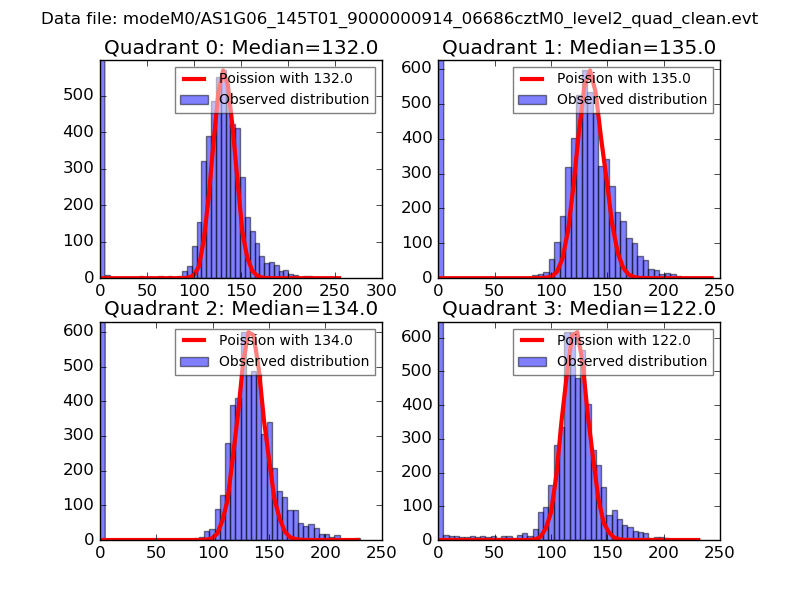 |
 |
| Quadrant-wise count rates Data is divided into 100 sec bins |
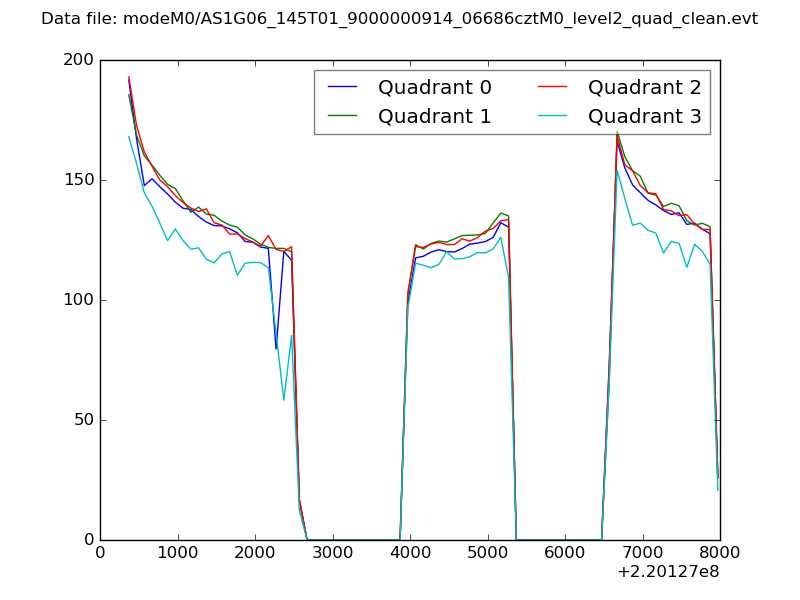 |
|
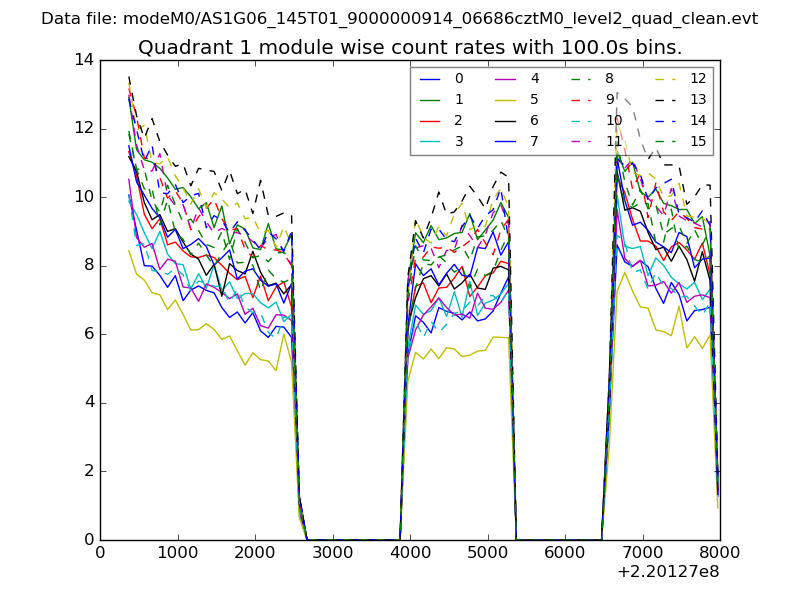
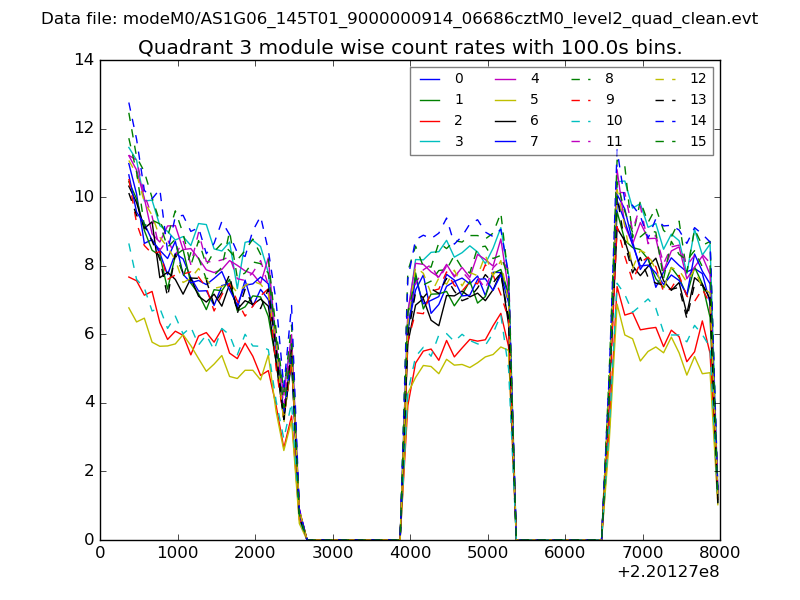
| Module-wise count rates for Quadrant A Data is divided into 100 sec bins |
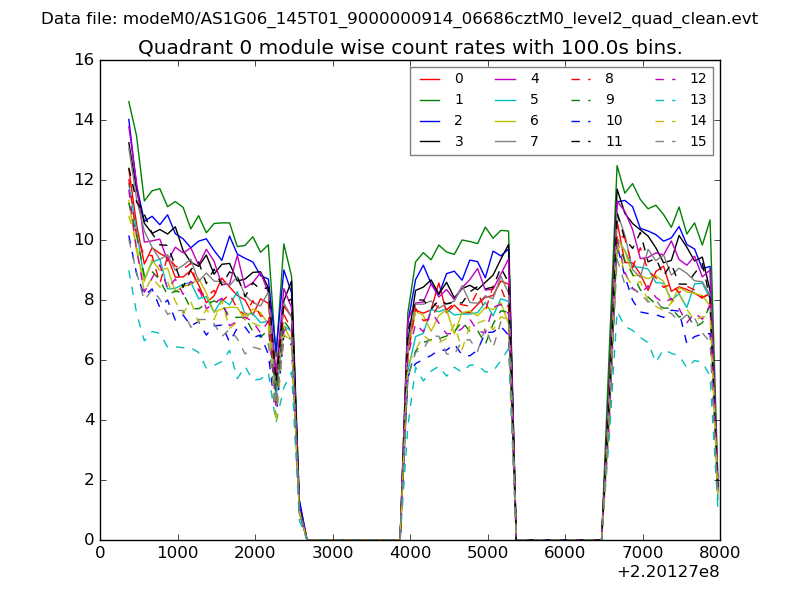 |
 |
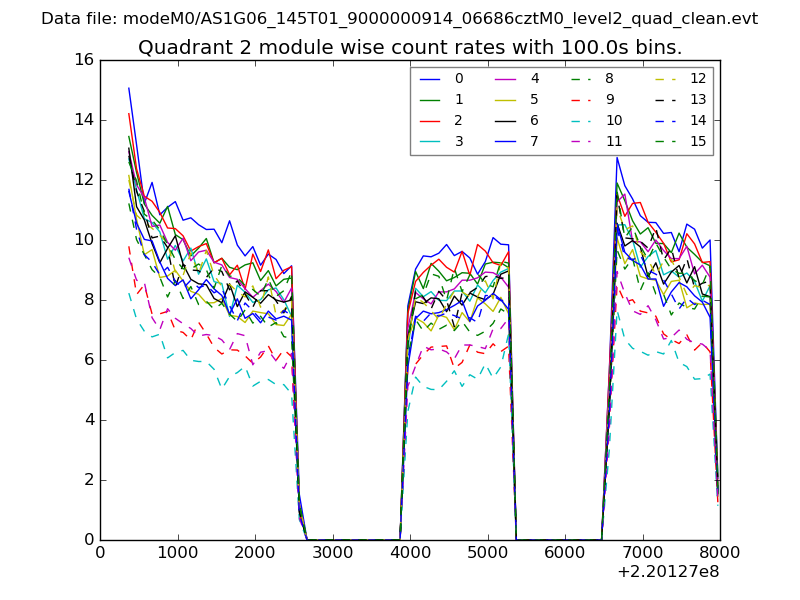
| Module-wise count rates for Quadrant B Data is divided into 100 sec bins |
 |
 |
| Module-wise count rates for Quadrant C Data is divided into 100 sec bins |
 |
 |
| Module-wise count rates for Quadrant D Data is divided into 100 sec bins |
 |
 |
| Parameter | Plot |
|---|---|
| CZT HV Monitor | 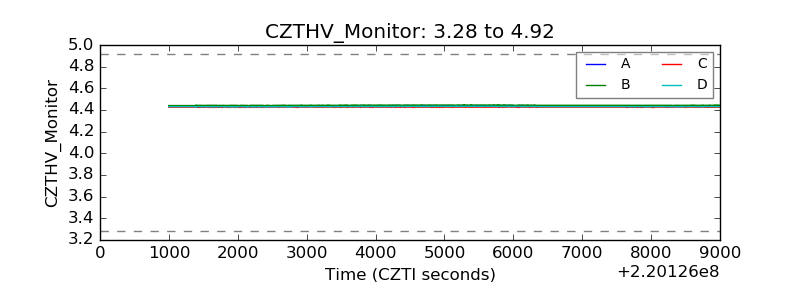 |
| D_VDD | 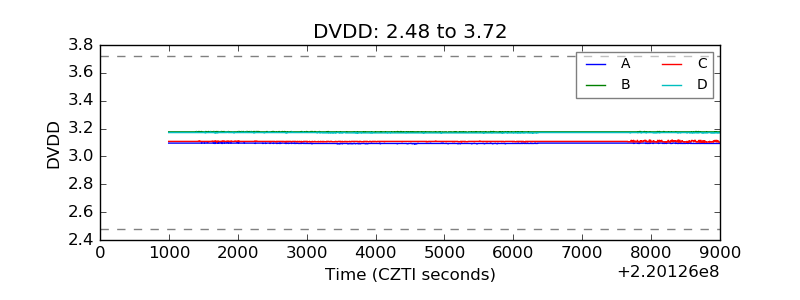 |
| Temperature 1 | 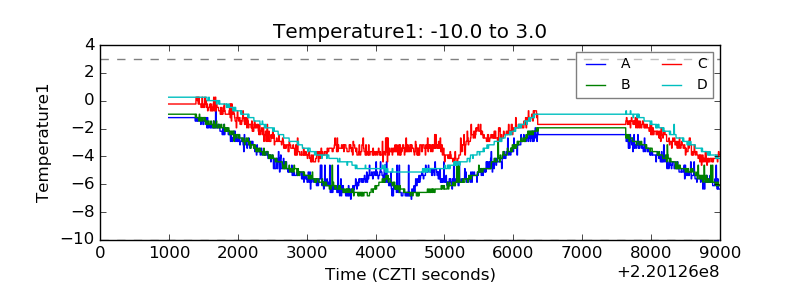 |
| Veto HV Monitor | 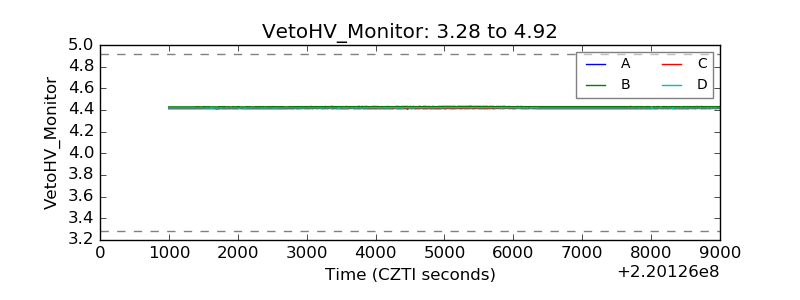 |
| Veto LLD | 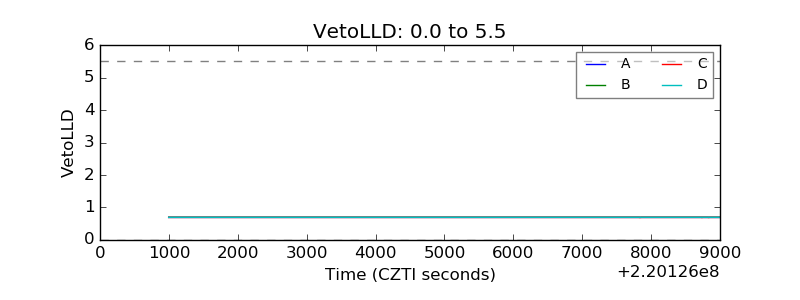 |
| Alpha Counter | 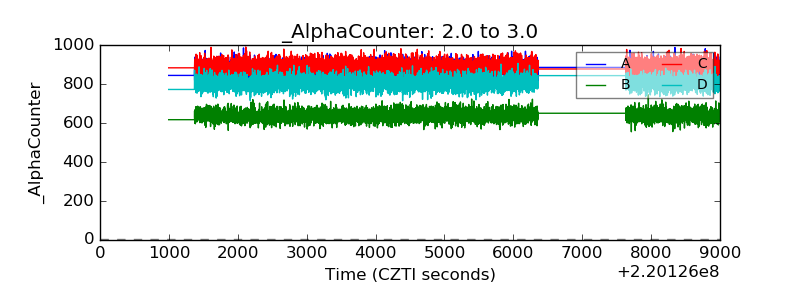 |
| _CPM_Rate | 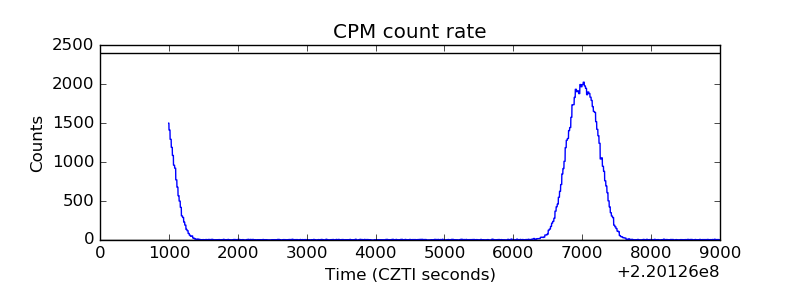 |
| CZT Counter | 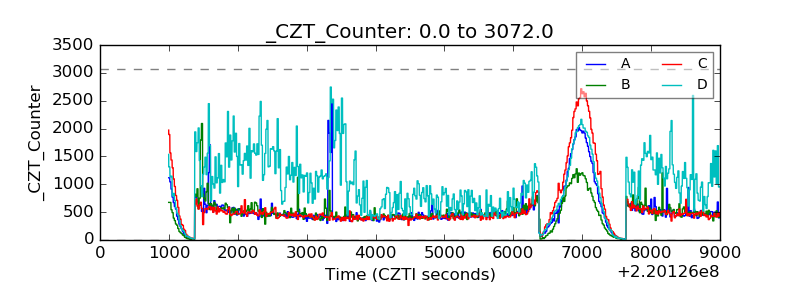 |
| +2.5 Volts monitor |  |
| +5 Volts monitor |  |
| _ROLL_ROT | 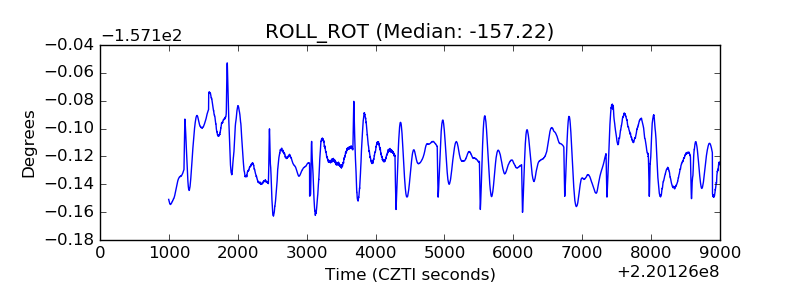 |
| _Roll_DEC | 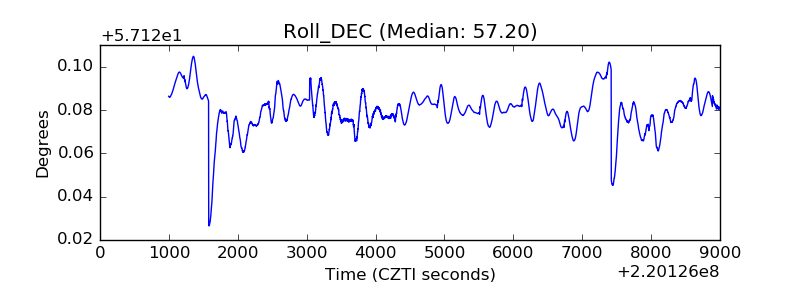 |
| _Roll_RA | 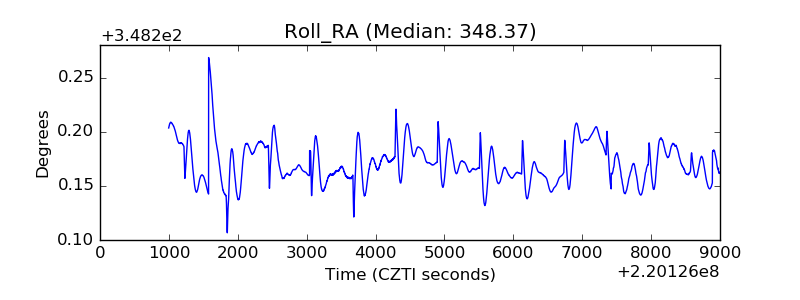 |
| Veto Counter | 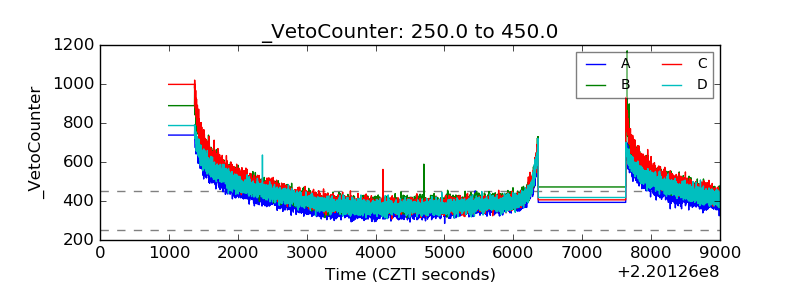 |