| Param | Original file | Final file |
|---|---|---|
| Filename | modeM0/AS1G06_145T01_9000000914_06687cztM0_level2.evt | modeM0/AS1G06_145T01_9000000914_06687cztM0_level2_quad_clean.evt |
| Size (bytes) | 551,543,040 | 95,662,080 |
| Size | 526.0 MB | 91.2 MB |
| Events in quadrant A | 2,920,982 | 630,017 |
| Events in quadrant B | 3,181,207 | 645,002 |
| Events in quadrant C | 2,839,673 | 640,493 |
| Events in quadrant D | 7,340,019 | 546,855 |
| Mode SS | |||
|---|---|---|---|
| Quadrant | BADHDUFLAG | Total packets | Discarded packets |
| A | 0 | 126 | 0 |
| B | 0 | 126 | 0 |
| C | 0 | 126 | 0 |
| D | 0 | 126 | 0 |
| Mode M9 | |||
|---|---|---|---|
| Quadrant | BADHDUFLAG | Total packets | Discarded packets |
| A | 0 | 17 | 0 |
| B | 0 | 17 | 0 |
| C | 0 | 17 | 0 |
| D | 0 | 18 | 0 |
| Mode M0 | |||
|---|---|---|---|
| Quadrant | BADHDUFLAG | Total packets | Discarded packets |
| A | 0 | 12929 | 3 |
| B | 0 | 13642 | 2 |
| C | 0 | 12717 | 2 |
| D | 0 | 26112 | 2 |
| Quadrant | Total seconds | Saturated seconds | Saturation percentage |
|---|---|---|---|
| A | 6226 | 22 | 0.353357% |
| B | 6226 | 75 | 1.204626% |
| C | 6226 | 20 | 0.321234% |
| D | 6226 | 798 | 12.817218% |
Noise dominated data is calculated using 1-second bins in cleaned event files. If a bin has >2000 counts, and if more than 50% of those come from <1% of pixels, then it is considered to be noise-dominated and hence unusable.
| Quadrant | # 1 sec bins | Bins with >0 counts | Bins with >2000 counts | High rate bins dominated by noise | Noise dominated (total time) | Noise dominated (detector-on time) | Marked lightcurve |
|---|---|---|---|---|---|---|---|
| A | 7531 | 6227 | 2 | 2 | 0.03% | 0.03% | 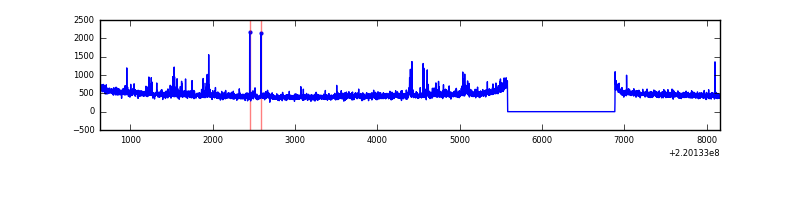 |
| B | 7531 | 6227 | 17 | 17 | 0.23% | 0.27% |  |
| C | 7531 | 6227 | 0 | 0 | 0.00% | 0.00% | 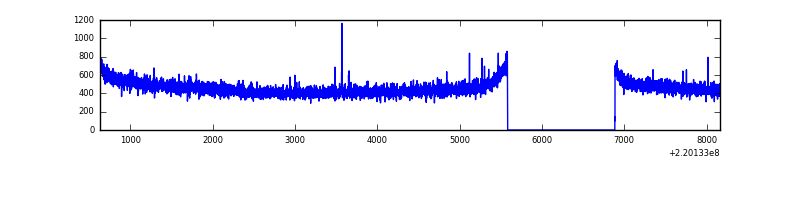 |
| D | 7531 | 6227 | 616 | 616 | 8.18% | 9.89% | 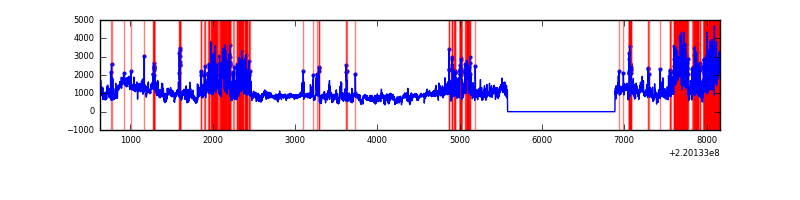 |
Top three noisy pixels from each quadrant. If the there are fewer than three noisy pixels in the level2.evt file, extra rows are filled as -1
| Pixel properties | Quadrant properties | ||||||
|---|---|---|---|---|---|---|---|
| Quadrant | DetID | PixID | Counts | Sigma | Mean | Median | Sigma |
| A | 8 | 15 | 58174 | 397.1 | 720 | 704 | 144.7 |
| A | 14 | 111 | 40909 | 277.81 | 720 | 704 | 144.7 |
| A | 4 | 2 | 23811 | 159.66 | 720 | 704 | 144.7 |
| B | 0 | 219 | 106146 | 770.09 | 733 | 714 | 136.9 |
| B | 4 | 81 | 85446 | 618.89 | 733 | 714 | 136.9 |
| B | 4 | 170 | 40126 | 287.87 | 733 | 714 | 136.9 |
| C | 8 | 128 | 12206 | 69.27 | 720 | 725 | 165.7 |
| C | 8 | 112 | 6491 | 34.79 | 720 | 725 | 165.7 |
| C | 13 | 61 | 5677 | 29.88 | 720 | 725 | 165.7 |
| D | 8 | 195 | 2187806 | 13398.96 | 673 | 652 | 163.2 |
| D | 2 | 33 | 1511818 | 9257.72 | 673 | 652 | 163.2 |
| D | 2 | 152 | 376453 | 2302.23 | 673 | 652 | 163.2 |
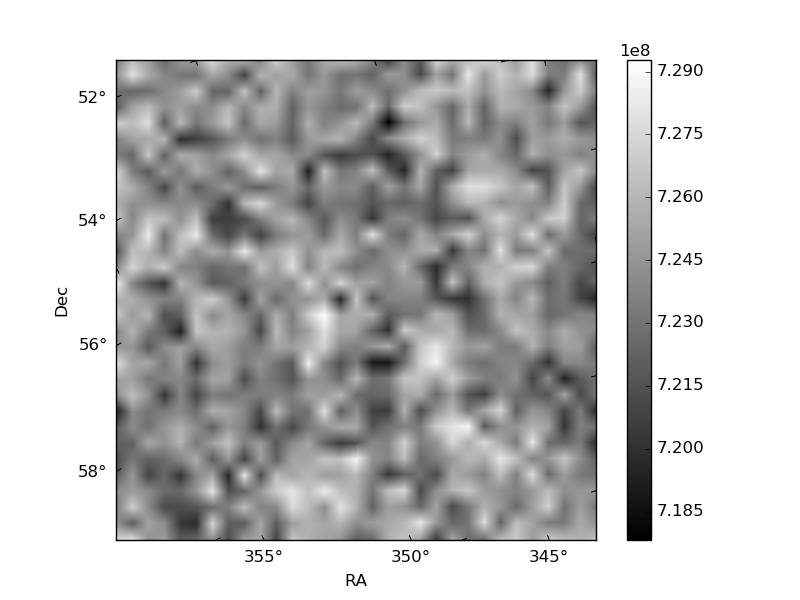
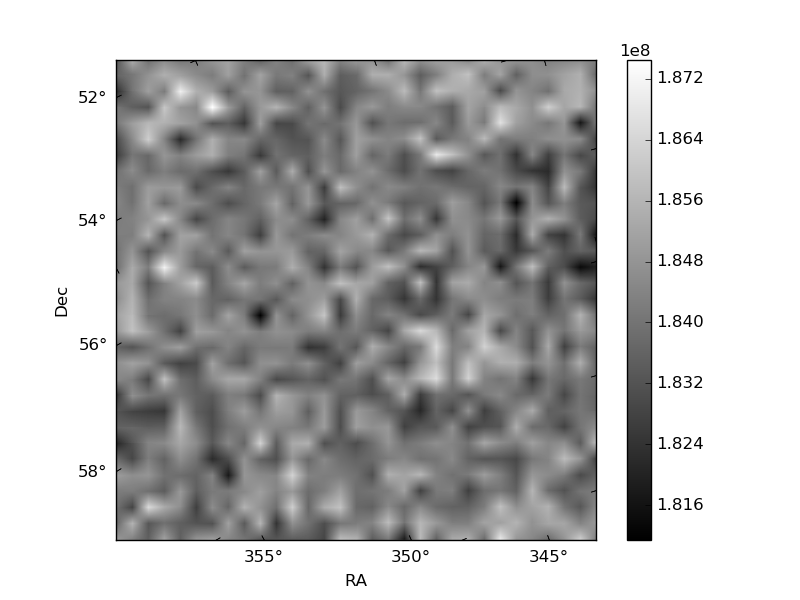
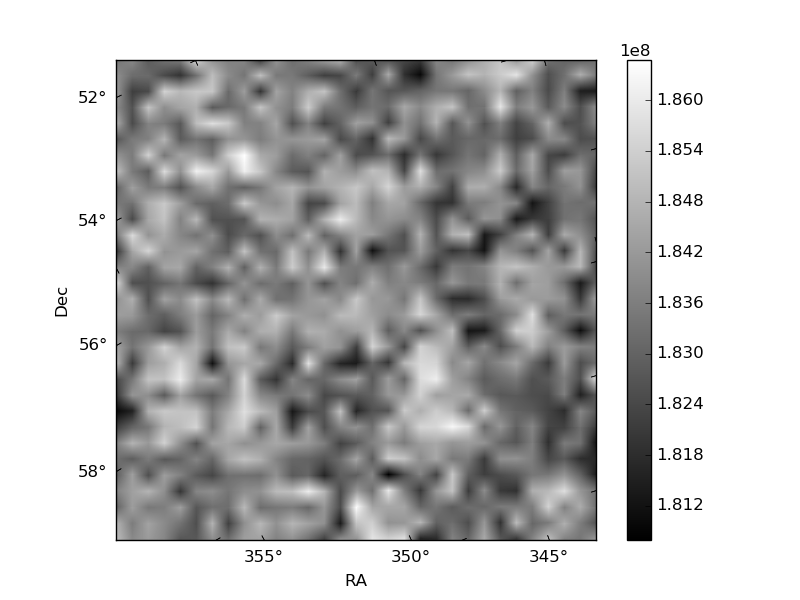
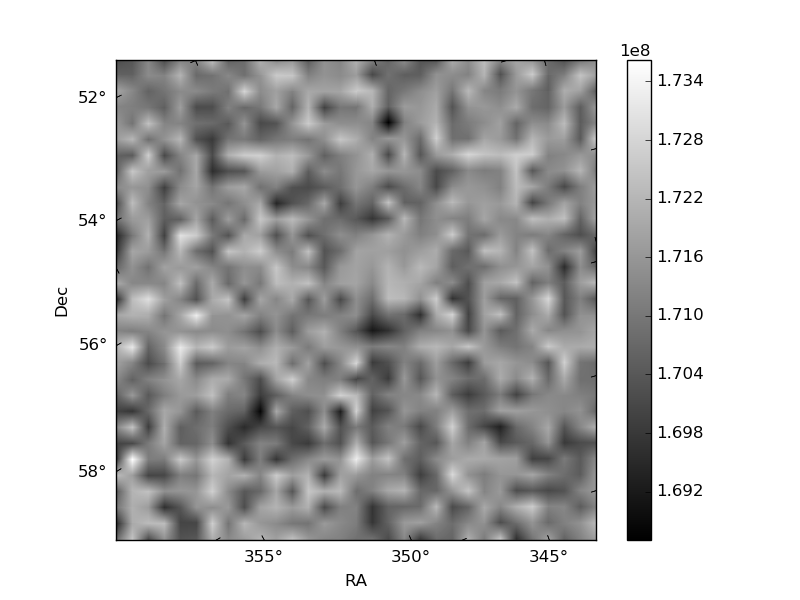
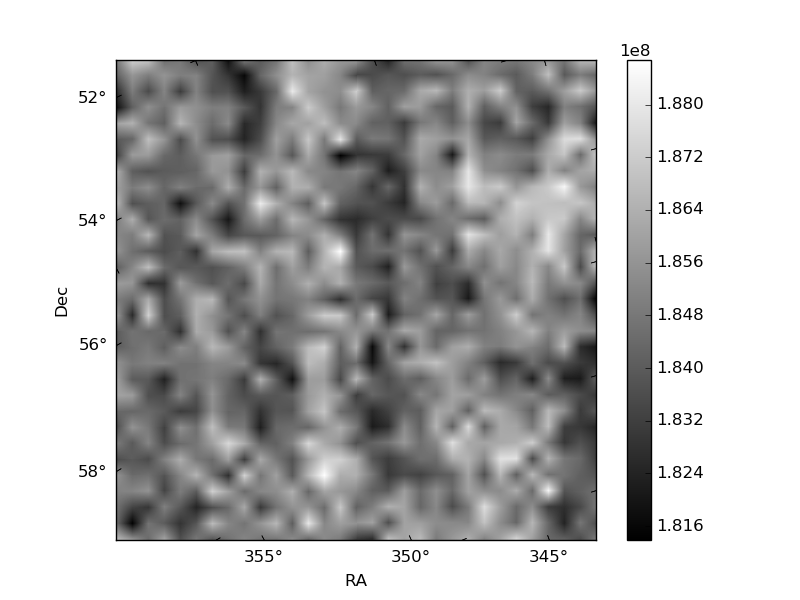
Histogram calculated using DETX and DETY for each event in the final _common_clean file
| Quadrant A |  |
 |
Quadrant B |
|---|---|---|---|
| Quadrant D | 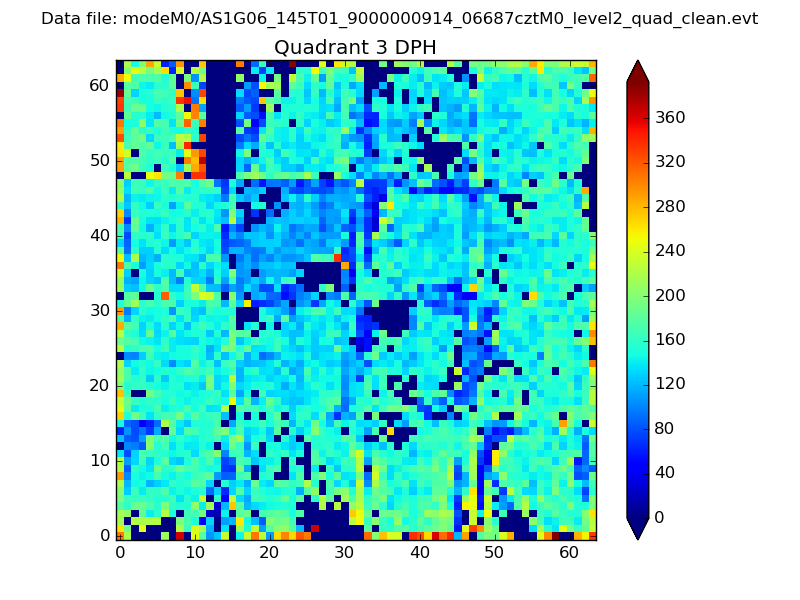 |
 |
Quadrant C |
| Plot type | Count rate plots | Images |
|---|---|---|
| Comparison with Poisson distribution Blue bars denote a histogram of data divided into 1 sec bins. Red curve is a Poisson curve with rate = median count rate of data. |
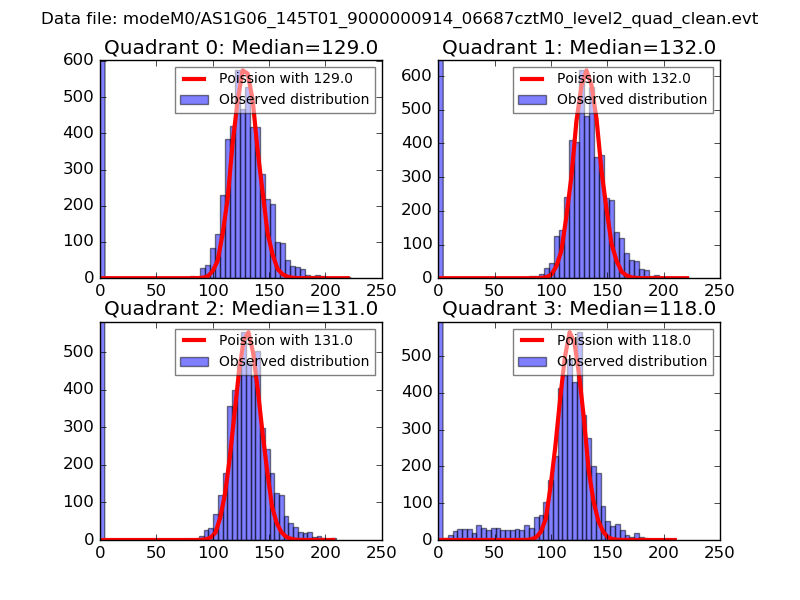 |
 |
| Quadrant-wise count rates Data is divided into 100 sec bins |
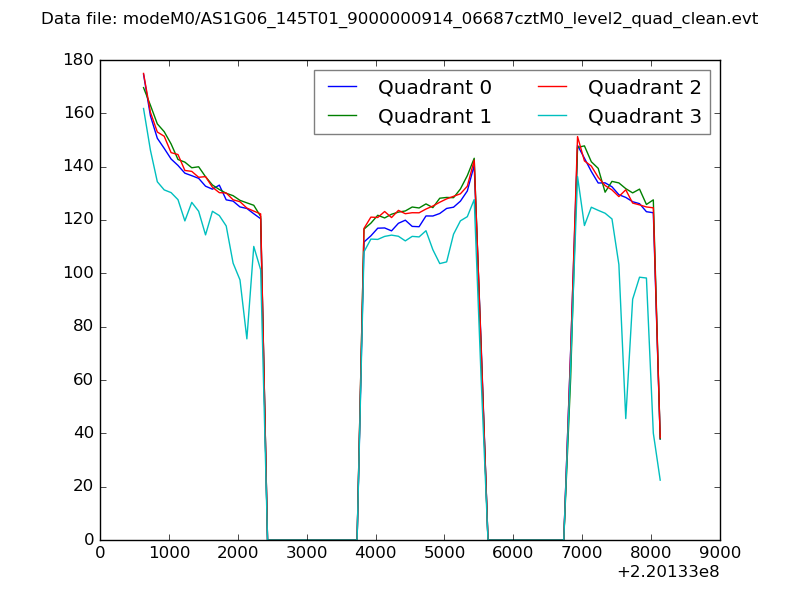 |
|
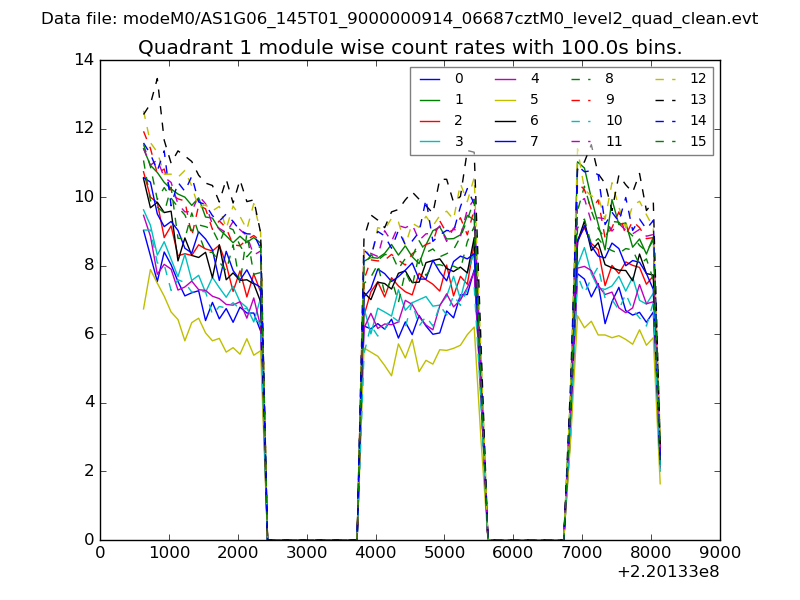
| Module-wise count rates for Quadrant A Data is divided into 100 sec bins |
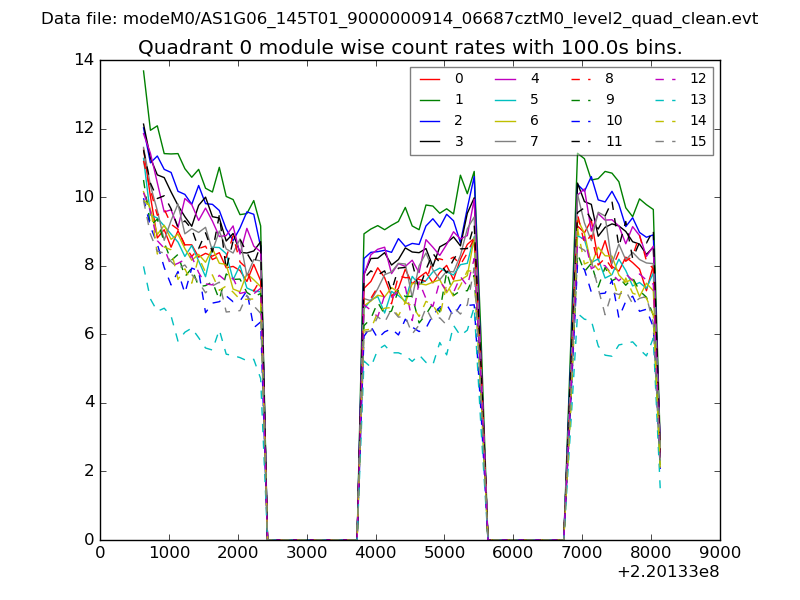 |
 |
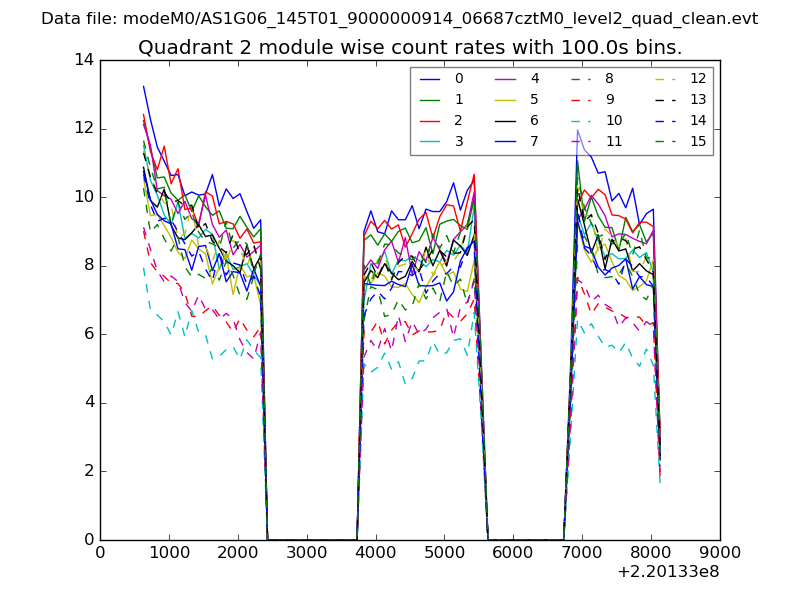
| Module-wise count rates for Quadrant B Data is divided into 100 sec bins |
 |
 |
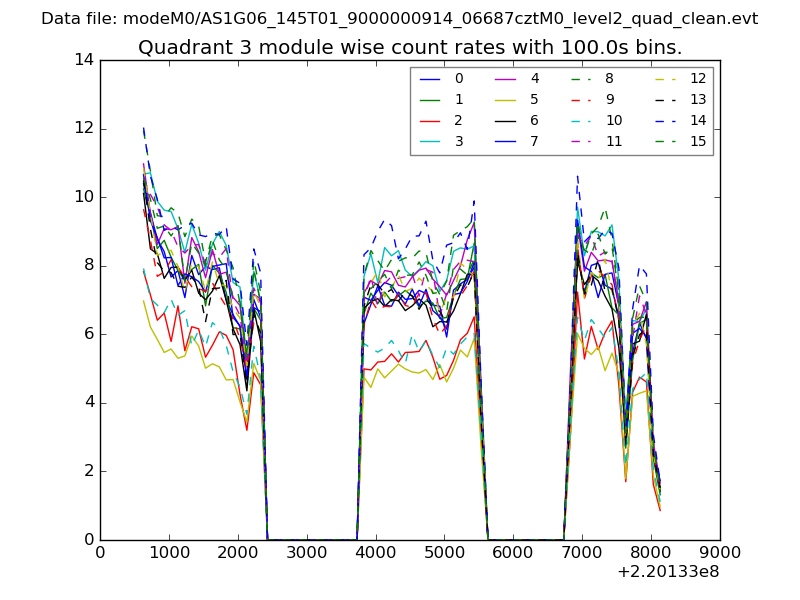
| Module-wise count rates for Quadrant C Data is divided into 100 sec bins |
 |
 |
| Module-wise count rates for Quadrant D Data is divided into 100 sec bins |
 |
 |
| Parameter | Plot |
|---|---|
| CZT HV Monitor | 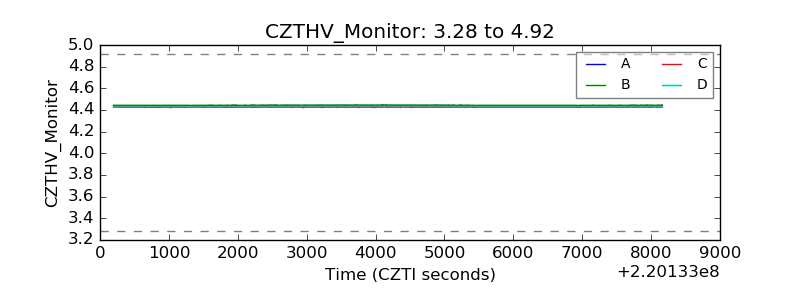 |
| D_VDD | 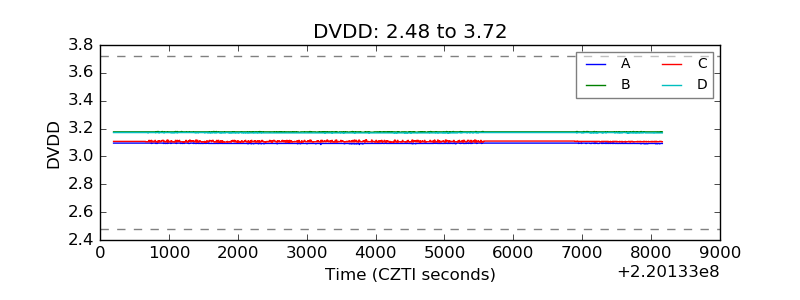 |
| Temperature 1 | 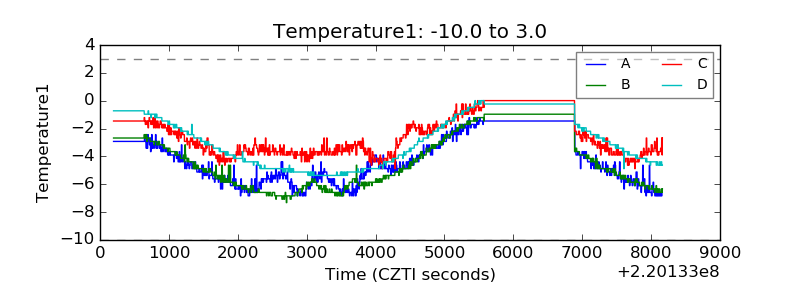 |
| Veto HV Monitor | 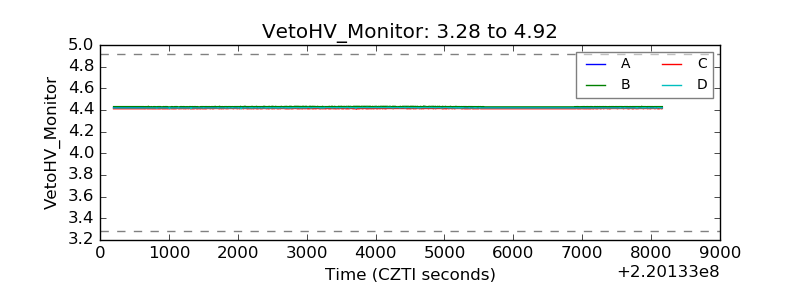 |
| Veto LLD | 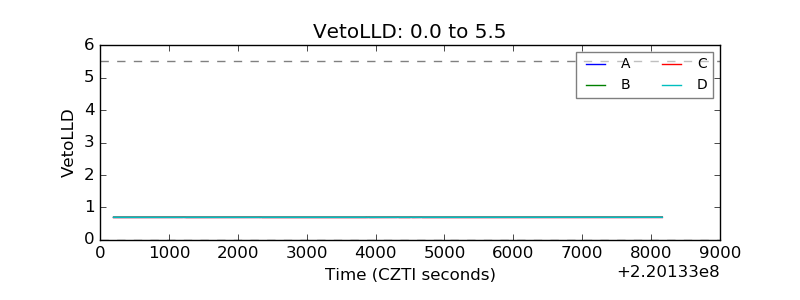 |
| Alpha Counter | 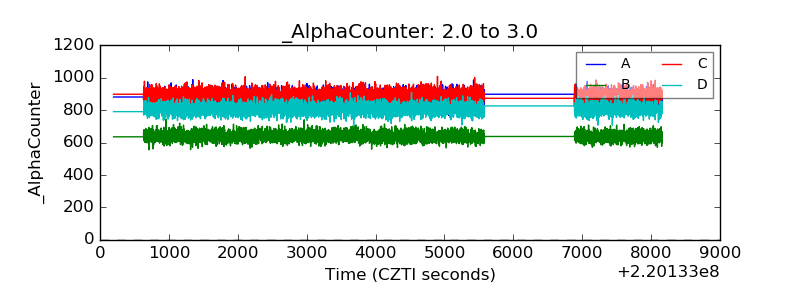 |
| _CPM_Rate | 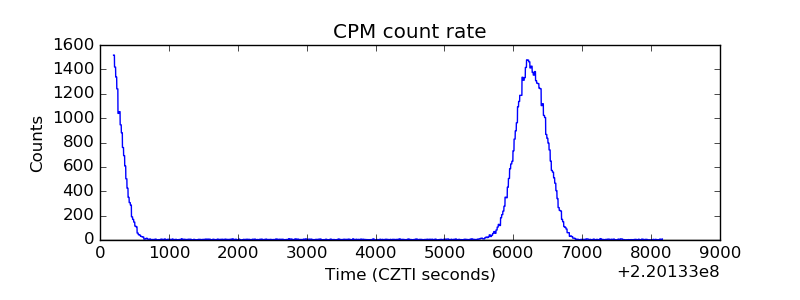 |
| CZT Counter | 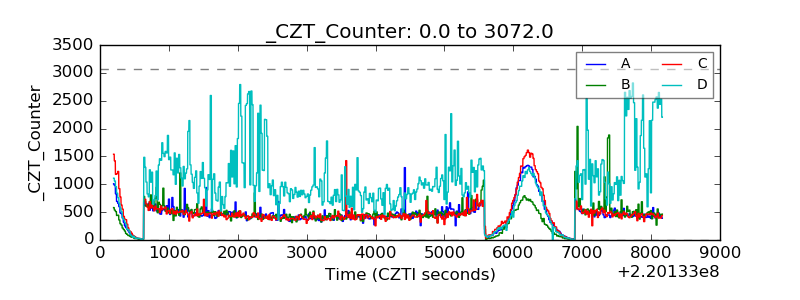 |
| +2.5 Volts monitor |  |
| +5 Volts monitor |  |
| _ROLL_ROT | 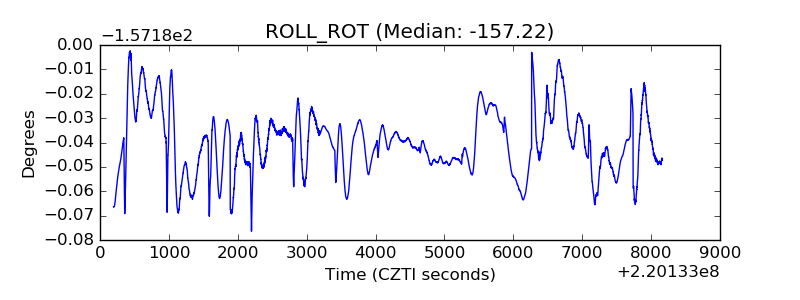 |
| _Roll_DEC | 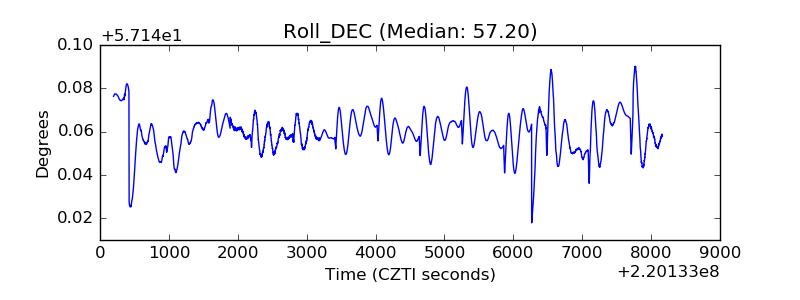 |
| _Roll_RA | 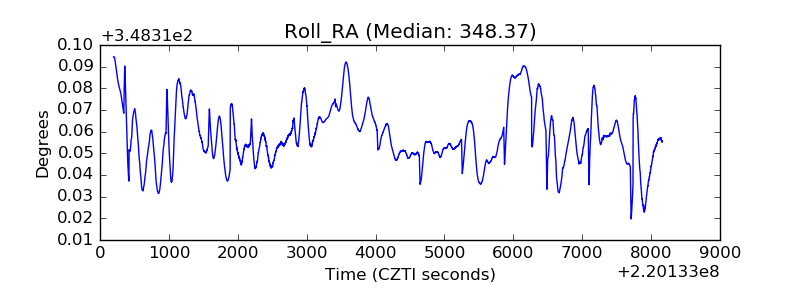 |
| Veto Counter | 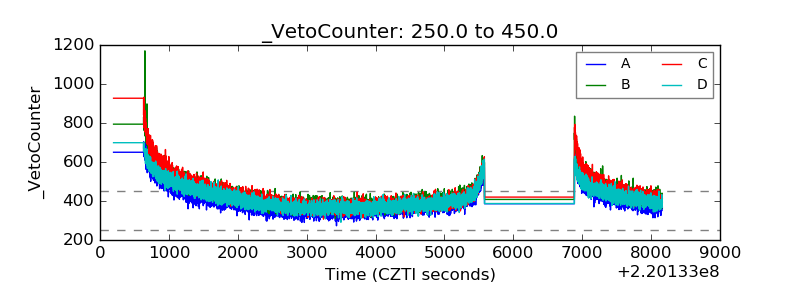 |