| Param | Original file | Final file |
|---|---|---|
| Filename | modeM0/AS1G06_145T01_9000000914_06688cztM0_level2.evt | modeM0/AS1G06_145T01_9000000914_06688cztM0_level2_quad_clean.evt |
| Size (bytes) | 433,825,920 | 69,575,040 |
| Size | 413.7 MB | 66.4 MB |
| Events in quadrant A | 2,253,234 | 452,283 |
| Events in quadrant B | 2,549,501 | 460,963 |
| Events in quadrant C | 2,189,398 | 460,662 |
| Events in quadrant D | 5,804,671 | 380,080 |
| Mode SS | |||
|---|---|---|---|
| Quadrant | BADHDUFLAG | Total packets | Discarded packets |
| A | 0 | 104 | 0 |
| B | 0 | 104 | 0 |
| C | 0 | 104 | 0 |
| D | 0 | 104 | 0 |
| Mode M9 | |||
|---|---|---|---|
| Quadrant | BADHDUFLAG | Total packets | Discarded packets |
| A | 0 | 4 | 0 |
| B | 0 | 4 | 0 |
| C | 0 | 4 | 0 |
| D | 0 | 5 | 0 |
| Mode M0 | |||
|---|---|---|---|
| Quadrant | BADHDUFLAG | Total packets | Discarded packets |
| A | 0 | 10301 | 1 |
| B | 0 | 10987 | 1 |
| C | 0 | 10196 | 1 |
| D | 0 | 20802 | 1 |
| Quadrant | Total seconds | Saturated seconds | Saturation percentage |
|---|---|---|---|
| A | 5020 | 13 | 0.258964% |
| B | 5020 | 65 | 1.294821% |
| C | 5020 | 5 | 0.099602% |
| D | 5020 | 968 | 19.282869% |
Noise dominated data is calculated using 1-second bins in cleaned event files. If a bin has >2000 counts, and if more than 50% of those come from <1% of pixels, then it is considered to be noise-dominated and hence unusable.
| Quadrant | # 1 sec bins | Bins with >0 counts | Bins with >2000 counts | High rate bins dominated by noise | Noise dominated (total time) | Noise dominated (detector-on time) | Marked lightcurve |
|---|---|---|---|---|---|---|---|
| A | 5020 | 5020 | 1 | 1 | 0.02% | 0.02% | 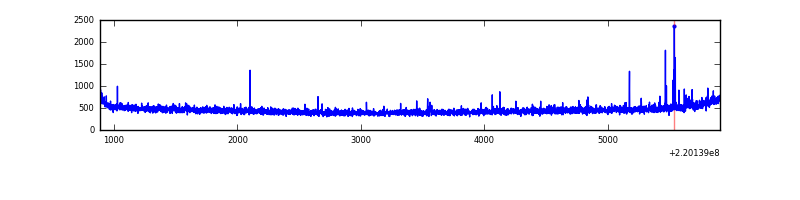 |
| B | 5020 | 5020 | 16 | 16 | 0.32% | 0.32% | 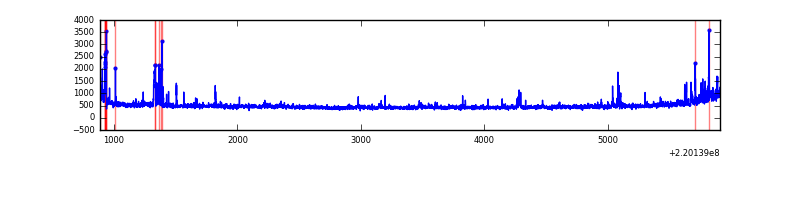 |
| C | 5020 | 5020 | 0 | 0 | 0.00% | 0.00% | 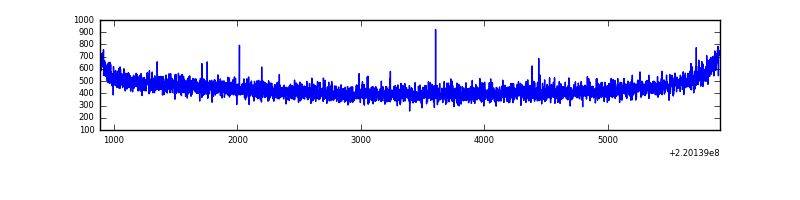 |
| D | 5020 | 5020 | 786 | 786 | 15.66% | 15.66% | 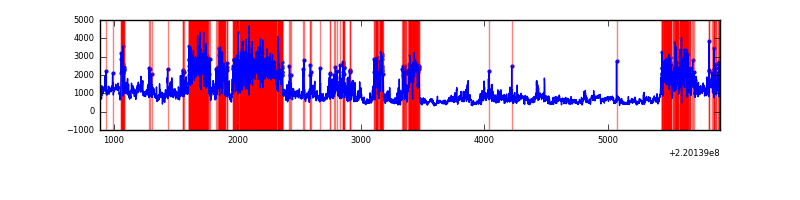 |
Top three noisy pixels from each quadrant. If the there are fewer than three noisy pixels in the level2.evt file, extra rows are filled as -1
| Pixel properties | Quadrant properties | ||||||
|---|---|---|---|---|---|---|---|
| Quadrant | DetID | PixID | Counts | Sigma | Mean | Median | Sigma |
| A | 8 | 15 | 43671 | 369.26 | 569 | 556 | 116.8 |
| A | 4 | 2 | 7306 | 57.81 | 569 | 556 | 116.8 |
| A | 12 | 194 | 5950 | 46.2 | 569 | 556 | 116.8 |
| B | 4 | 81 | 72017 | 663.72 | 573 | 560 | 107.7 |
| B | 0 | 219 | 70954 | 653.84 | 573 | 560 | 107.7 |
| B | 4 | 48 | 69046 | 636.12 | 573 | 560 | 107.7 |
| C | 13 | 61 | 4553 | 30.98 | 560 | 563 | 128.8 |
| C | 12 | 4 | 2376 | 14.07 | 560 | 563 | 128.8 |
| C | 3 | 202 | 1482 | 7.13 | 560 | 563 | 128.8 |
| D | 2 | 33 | 1901996 | 15421.82 | 506 | 489 | 123.3 |
| D | 8 | 195 | 1020249 | 8270.58 | 506 | 489 | 123.3 |
| D | 2 | 152 | 634615 | 5142.96 | 506 | 489 | 123.3 |
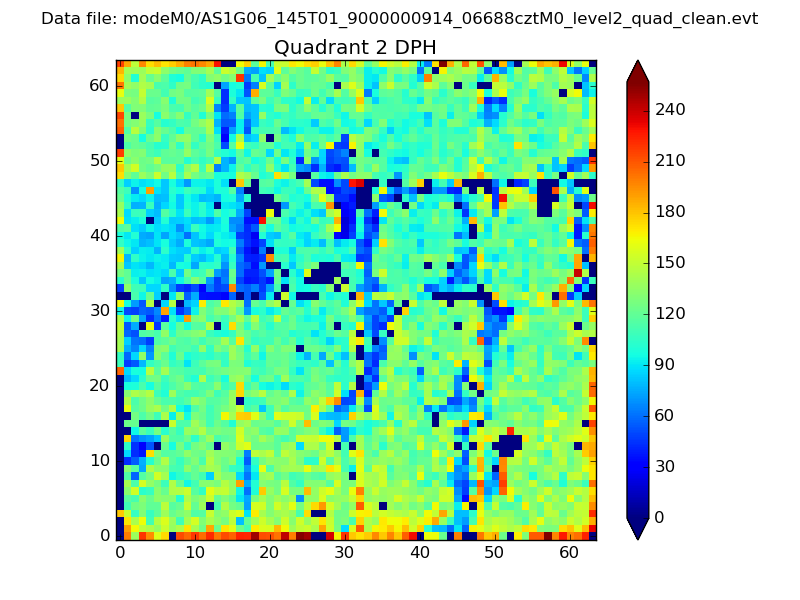
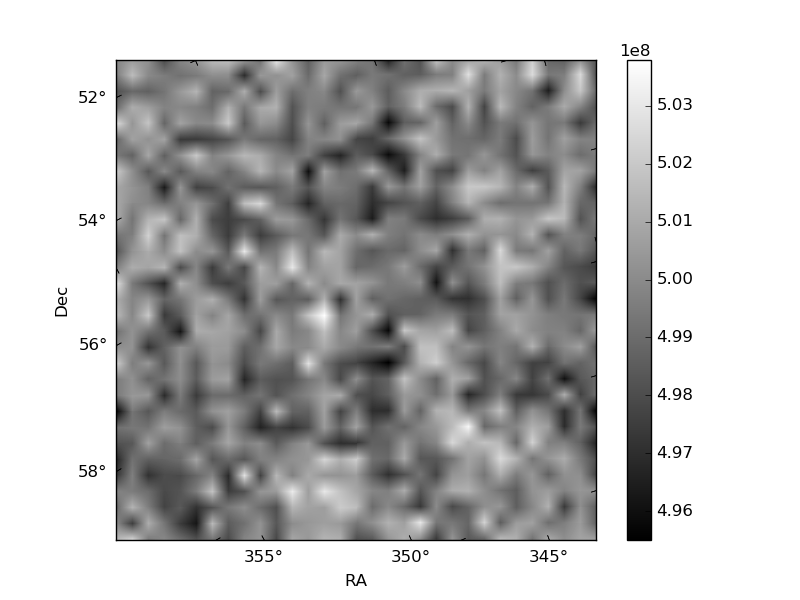
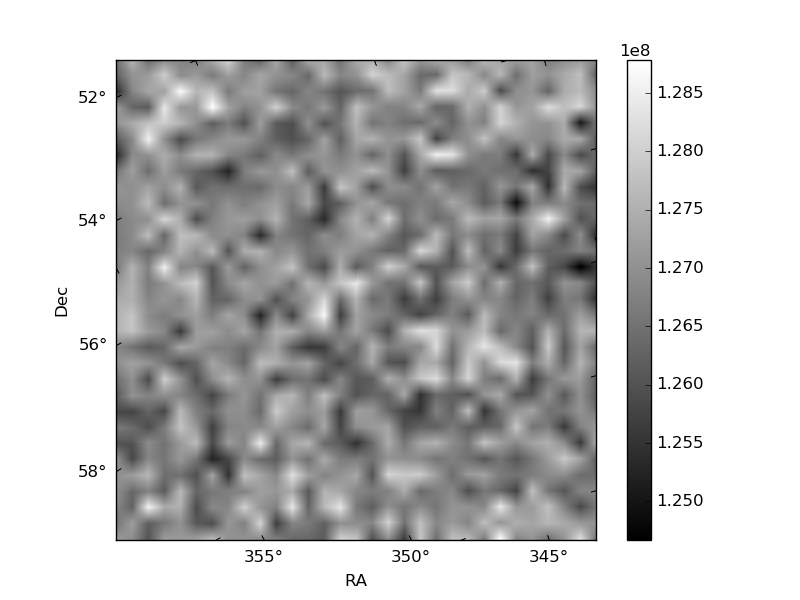
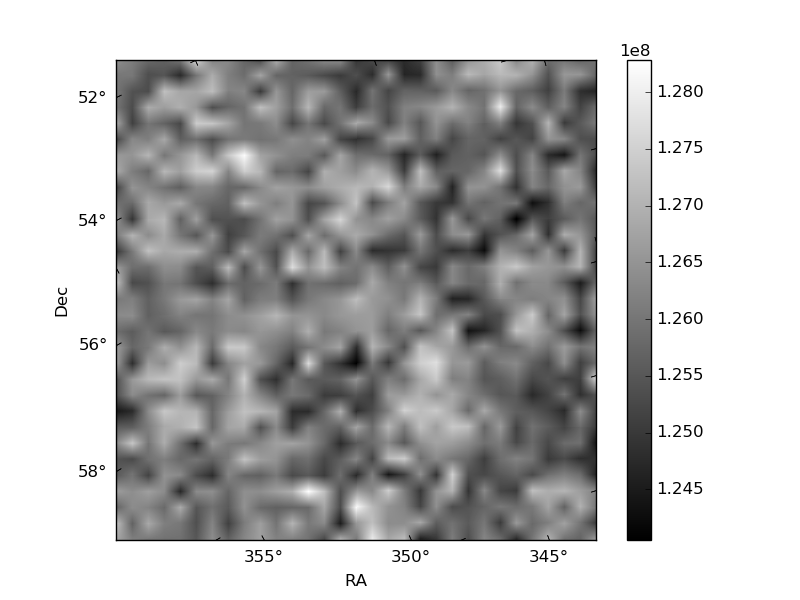
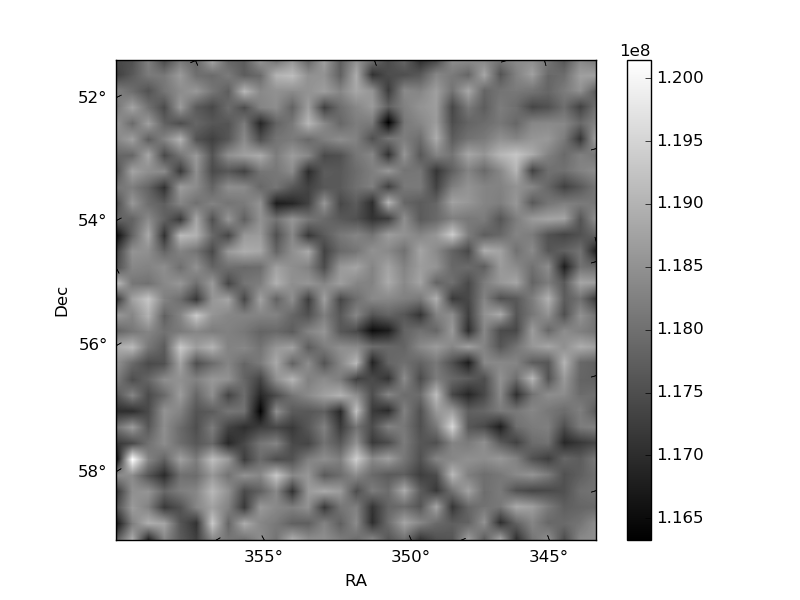
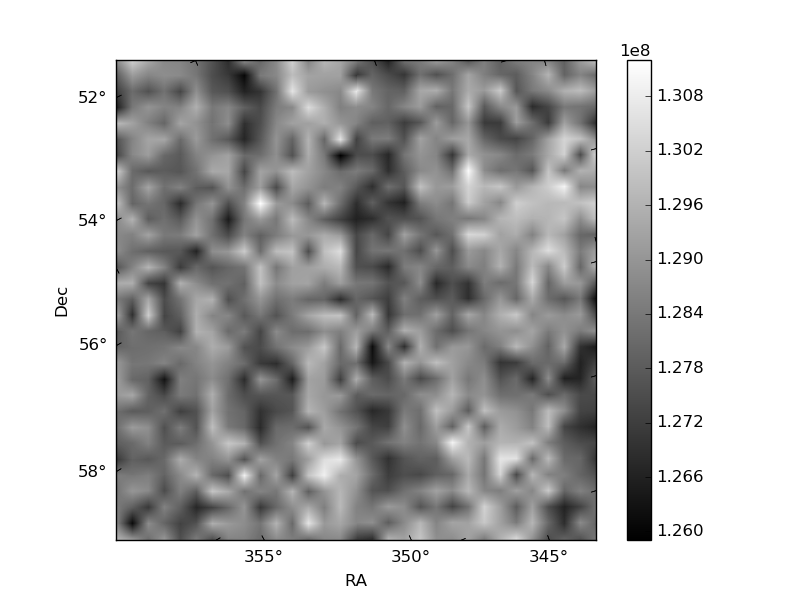
Histogram calculated using DETX and DETY for each event in the final _common_clean file
| Quadrant A | 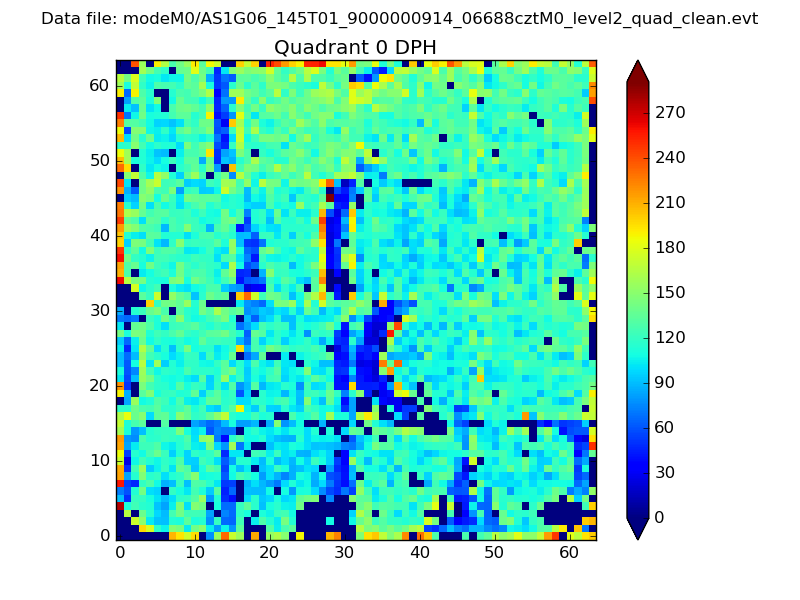 |
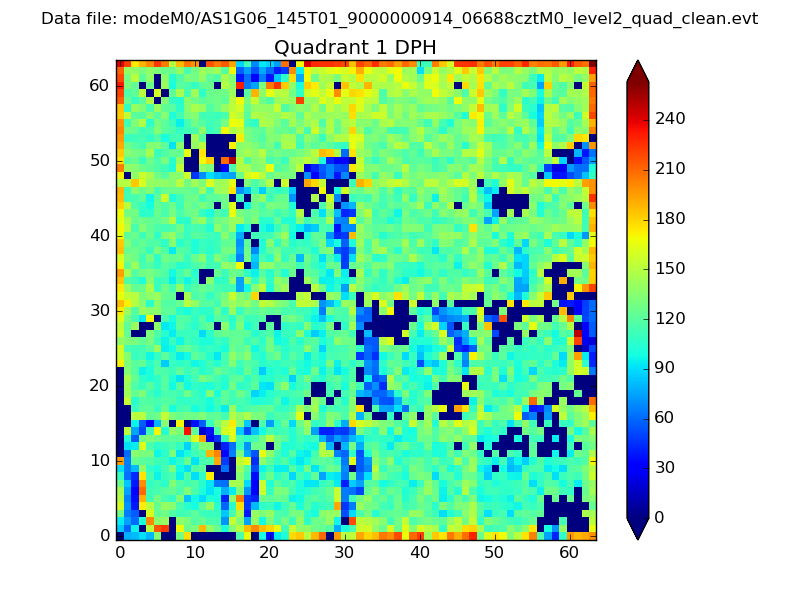 |
Quadrant B |
|---|---|---|---|
| Quadrant D | 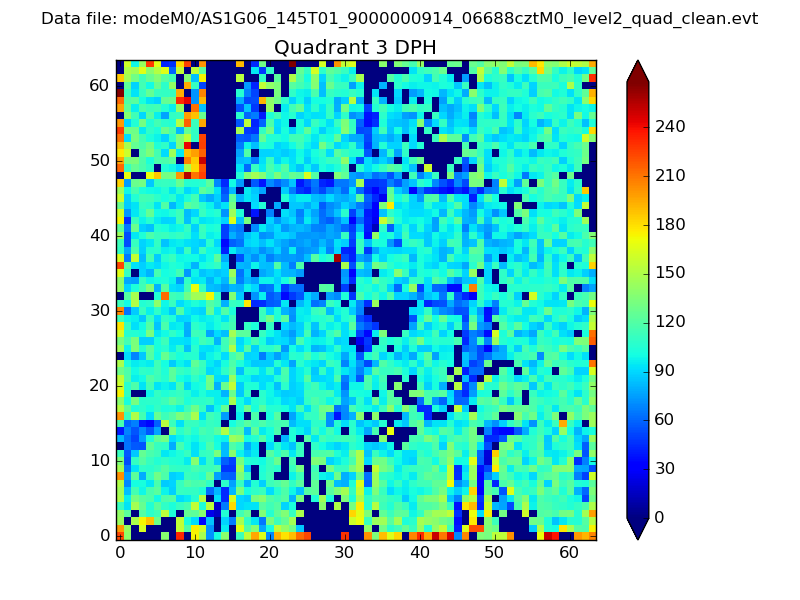 |
 |
Quadrant C |
| Plot type | Count rate plots | Images |
|---|---|---|
| Comparison with Poisson distribution Blue bars denote a histogram of data divided into 1 sec bins. Red curve is a Poisson curve with rate = median count rate of data. |
 |
 |
| Quadrant-wise count rates Data is divided into 100 sec bins |
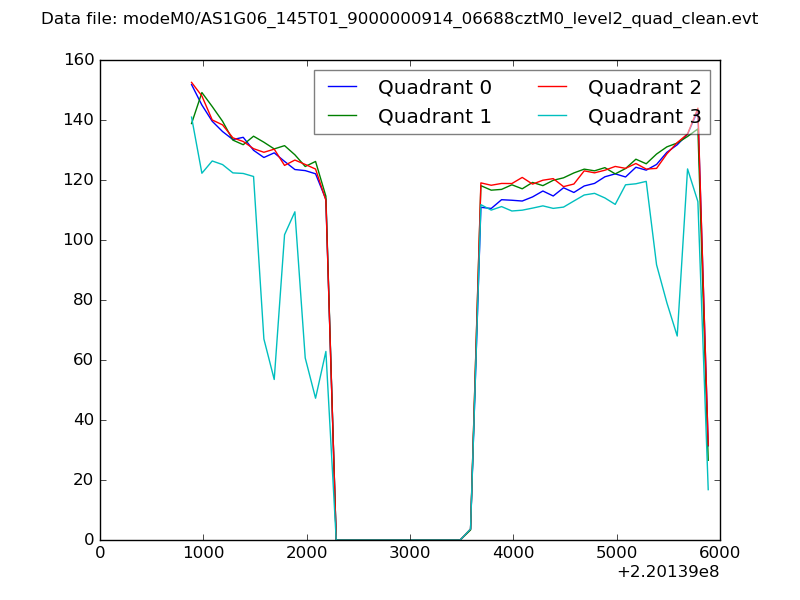 |
|
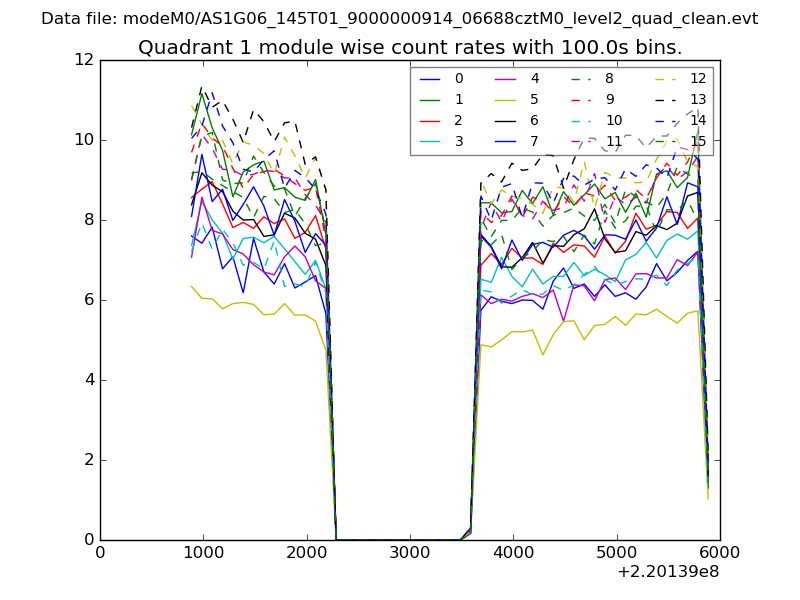
| Module-wise count rates for Quadrant A Data is divided into 100 sec bins |
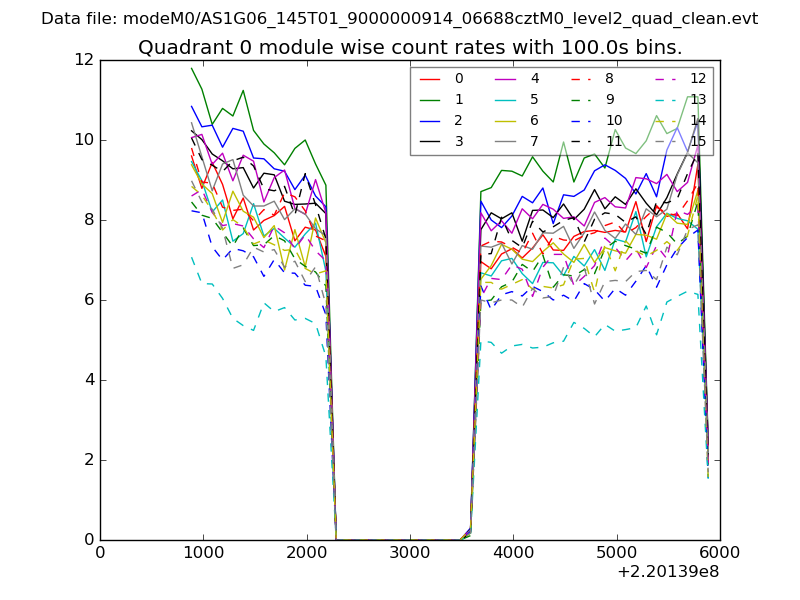 |
 |
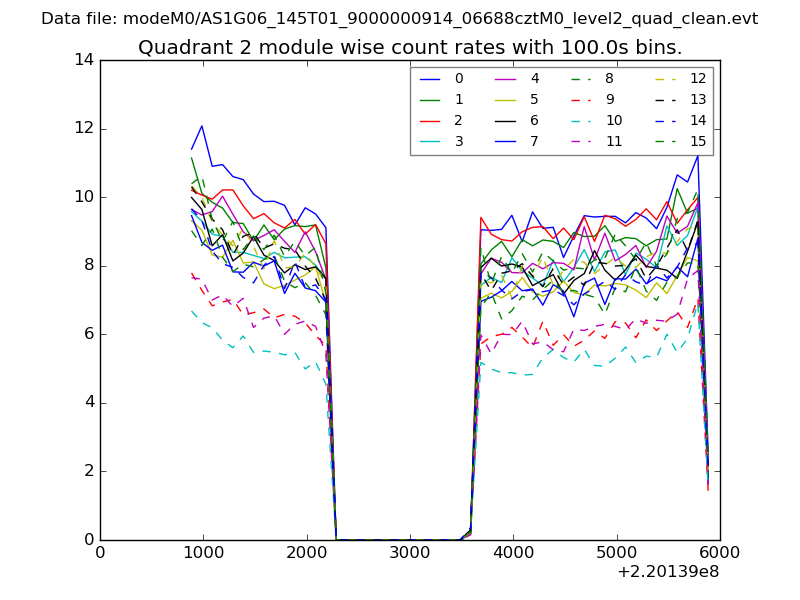
| Module-wise count rates for Quadrant B Data is divided into 100 sec bins |
 |
 |
| Module-wise count rates for Quadrant C Data is divided into 100 sec bins |
 |
 |
| Module-wise count rates for Quadrant D Data is divided into 100 sec bins |
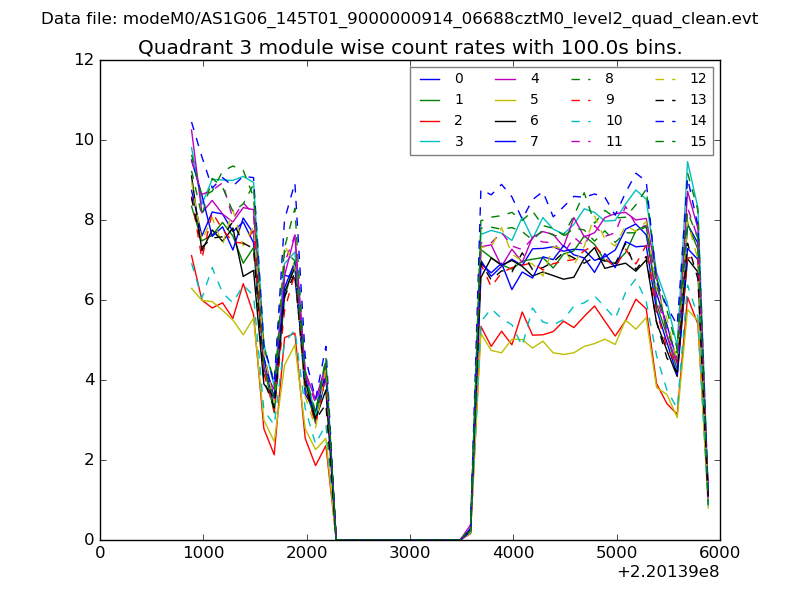 |
 |
| Parameter | Plot |
|---|---|
| CZT HV Monitor | 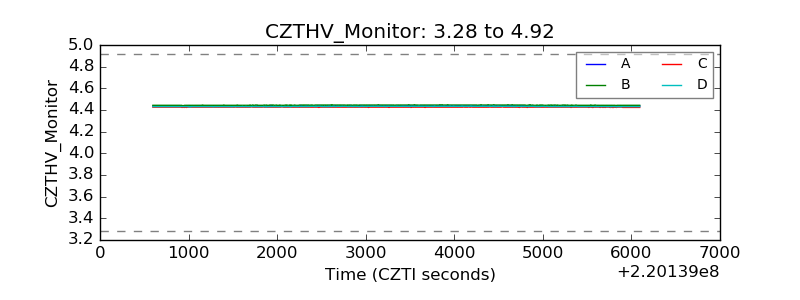 |
| D_VDD | 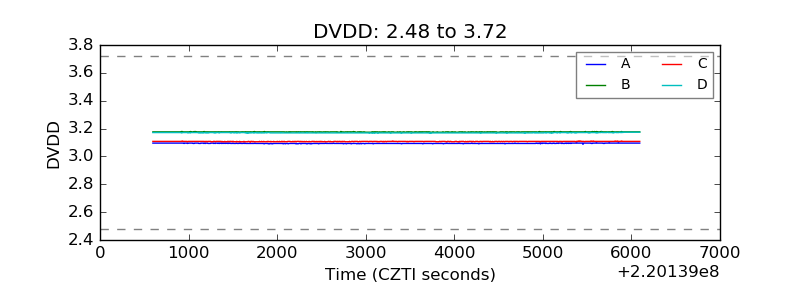 |
| Temperature 1 | 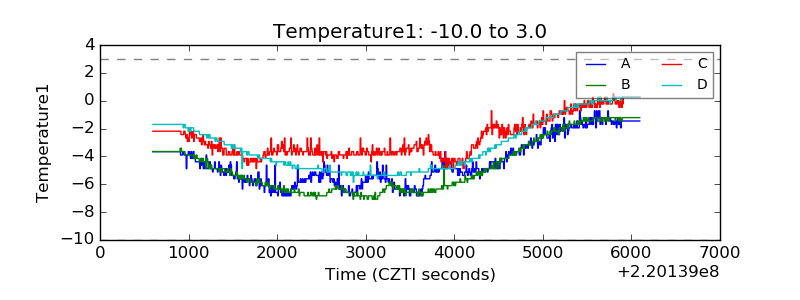 |
| Veto HV Monitor | 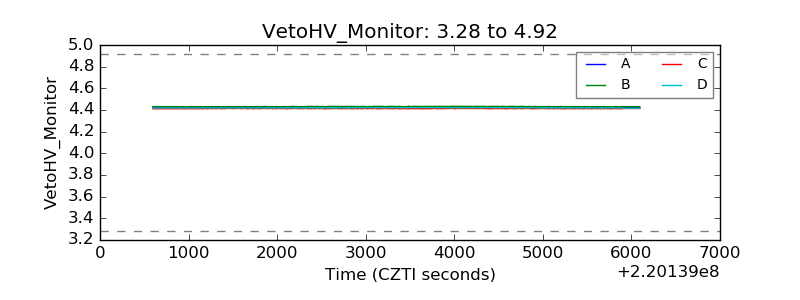 |
| Veto LLD | 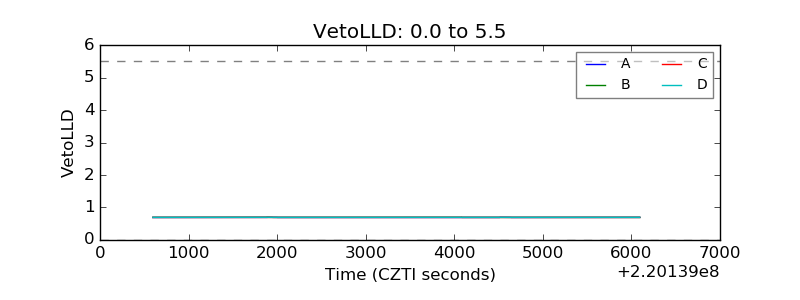 |
| Alpha Counter | 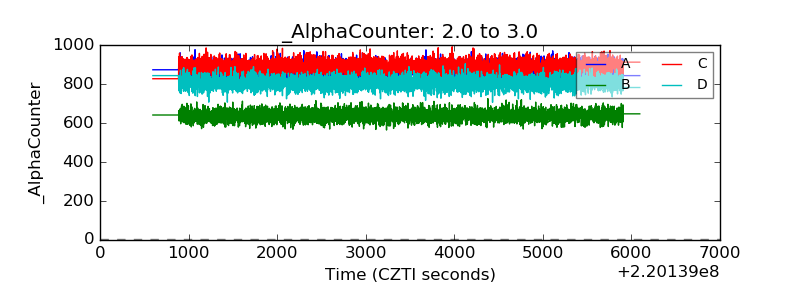 |
| _CPM_Rate | 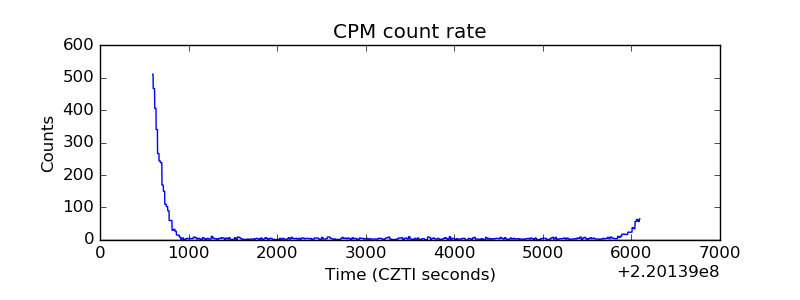 |
| CZT Counter | 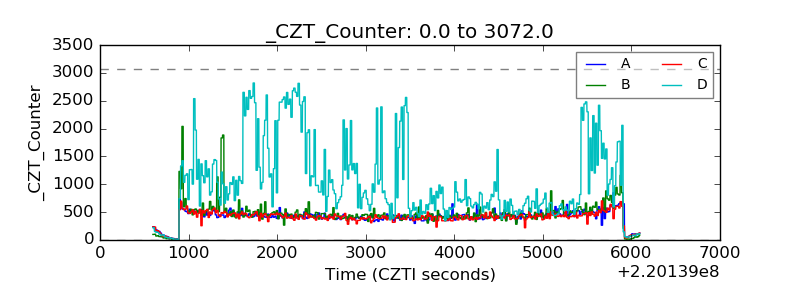 |
| +2.5 Volts monitor | 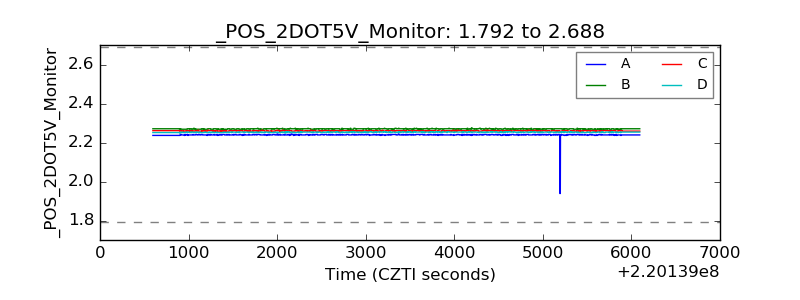 |
| +5 Volts monitor | 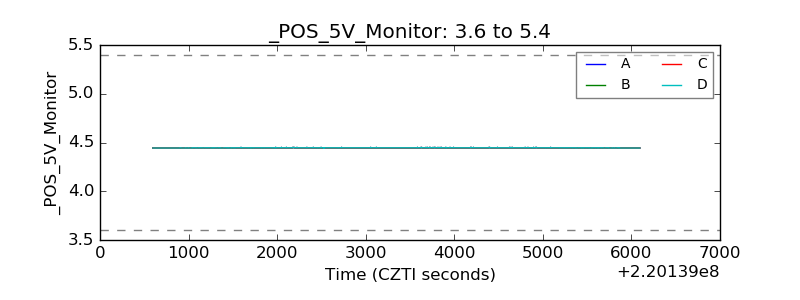 |
| _ROLL_ROT | 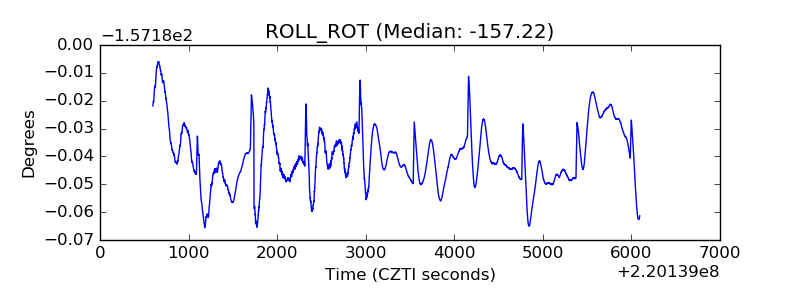 |
| _Roll_DEC | 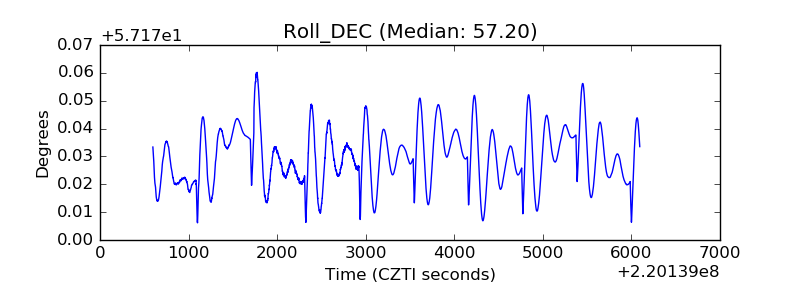 |
| _Roll_RA | 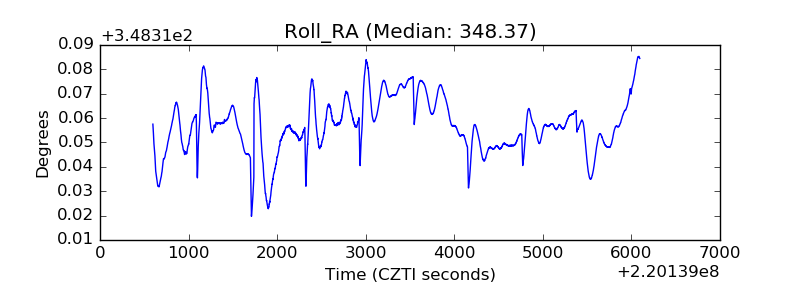 |
| Veto Counter | 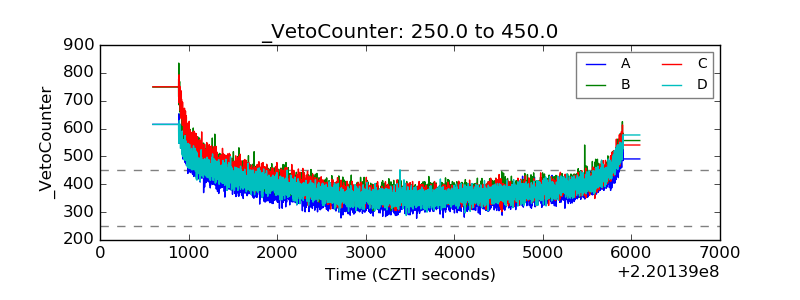 |