| Param | Original file | Final file |
|---|---|---|
| Filename | modeM0/AS1T01_145T01_9000000916cztM0_level2.fits | modeM0/AS1T01_145T01_9000000916cztM0_level2_quad_clean.evt |
| Size (bytes) | 620,691,840 | 894,214,080 |
| Size | 591.9 MB | 852.8 MB |
| Events in quadrant A | 3,742,682 | 6,018,380 |
| Events in quadrant B | 3,651,036 | 6,025,518 |
| Events in quadrant C | 3,735,732 | 5,750,150 |
| Events in quadrant D | 2,797,982 | 4,427,639 |
| Mode M0 | |||
|---|---|---|---|
| Quadrant | BADHDUFLAG | Total packets | Discarded packets |
| A | 0 | 147815 | 0 |
| B | 0 | 152254 | 0 |
| C | 0 | 144685 | 0 |
| D | 0 | 256690 | 0 |
| Mode M9 | |||
|---|---|---|---|
| Quadrant | BADHDUFLAG | Total packets | Discarded packets |
| A | 0 | 104 | 0 |
| B | 0 | 104 | 0 |
| C | 0 | 104 | 0 |
| D | 0 | 104 | 0 |
| Mode SS | |||
|---|---|---|---|
| Quadrant | BADHDUFLAG | Total packets | Discarded packets |
| A | 0 | 1448 | 0 |
| B | 0 | 1448 | 0 |
| C | 0 | 1448 | 0 |
| D | 0 | 1448 | 0 |
| Quadrant | Total seconds | Saturated seconds | Saturation percentage |
|---|---|---|---|
| A | 70918 | 1092 | 1.539807% |
| B | 70918 | 1335 | 1.882456% |
| C | 70918 | 825 | 1.163315% |
| D | 70918 | 12744 | 17.970050% |
Noise dominated data is calculated using 1-second bins in cleaned event files. If a bin has >2000 counts, and if more than 50% of those come from <1% of pixels, then it is considered to be noise-dominated and hence unusable.
| Quadrant | # 1 sec bins | Bins with >0 counts | Bins with >2000 counts | High rate bins dominated by noise | Noise dominated (total time) | Noise dominated (detector-on time) | Marked lightcurve |
|---|---|---|---|---|---|---|---|
| A | 81388 | 70922 | 0 | 0 | 0.00% | 0.00% |  |
| B | 81388 | 70917 | 0 | 0 | 0.00% | 0.00% |  |
| C | 81388 | 70918 | 0 | 0 | 0.00% | 0.00% |  |
| D | 81388 | 70147 | 0 | 0 | 0.00% | 0.00% |  |
Top three noisy pixels from each quadrant. If the there are fewer than three noisy pixels in the level2.evt file, extra rows are filled as -1
| Pixel properties | Quadrant properties | ||||||
|---|---|---|---|---|---|---|---|
| Quadrant | DetID | PixID | Counts | Sigma | Mean | Median | Sigma |
| A | 0 | 29 | 3795 | 11.56 | 974 | 910 | 249.7 |
| A | 7 | 110 | 3263 | 9.42 | 974 | 910 | 249.7 |
| A | 0 | 30 | 2943 | 8.14 | 974 | 910 | 249.7 |
| B | 2 | 9 | 3214 | 11.89 | 966 | 921 | 192.8 |
| B | 12 | 226 | 2627 | 8.85 | 966 | 921 | 192.8 |
| B | 14 | 254 | 2550 | 8.45 | 966 | 921 | 192.8 |
| C | 1 | 80 | 2746 | 7.02 | 985 | 908 | 261.7 |
| C | 1 | 81 | 2692 | 6.82 | 985 | 908 | 261.7 |
| C | 12 | 241 | 2674 | 6.75 | 985 | 908 | 261.7 |
| D | 3 | 14 | 2166 | 6.8 | 798 | 724 | 212.0 |
| D | 11 | 82 | 2107 | 6.52 | 798 | 724 | 212.0 |
| D | 4 | 160 | 2039 | 6.2 | 798 | 724 | 212.0 |
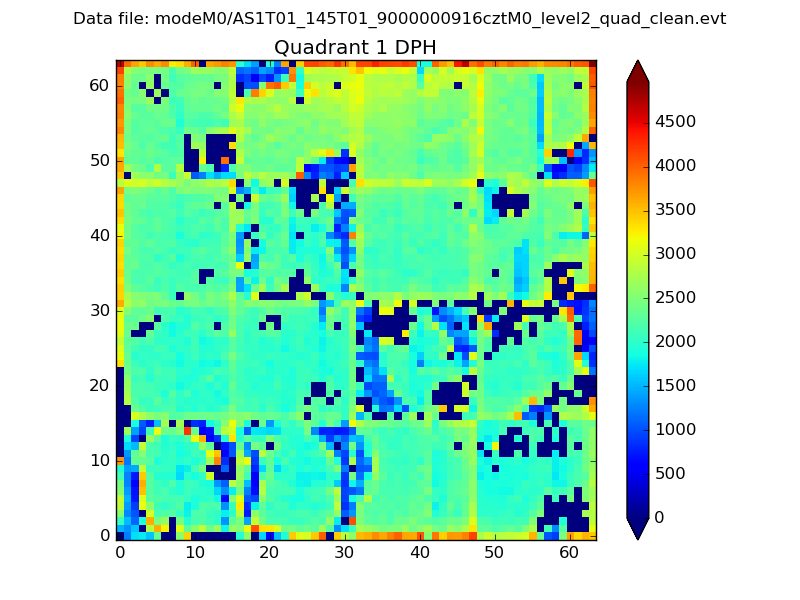
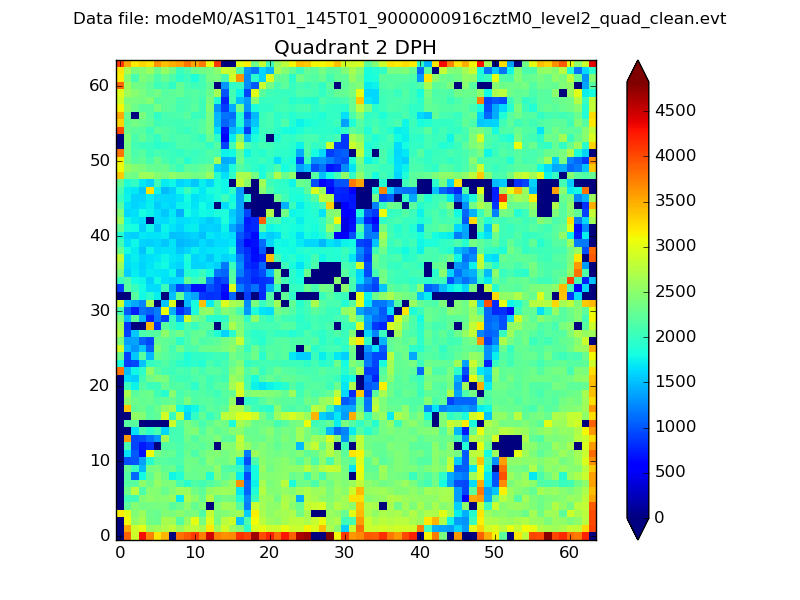
Histogram calculated using DETX and DETY for each event in the final _common_clean file
| Quadrant A |  |
 |
Quadrant B |
|---|---|---|---|
| Quadrant D |  |
 |
Quadrant C |
| Plot type | Count rate plots | Images |
|---|---|---|
| Comparison with Poisson distribution Blue bars denote a histogram of data divided into 1 sec bins. Red curve is a Poisson curve with rate = median count rate of data. |
 |
 |
| Quadrant-wise count rates Data is divided into 100 sec bins |
 |
|
| Module-wise count rates for Quadrant A Data is divided into 100 sec bins |
 |
 |
| Module-wise count rates for Quadrant B Data is divided into 100 sec bins |
 |
 |
| Module-wise count rates for Quadrant C Data is divided into 100 sec bins |
 |
 |
| Module-wise count rates for Quadrant D Data is divided into 100 sec bins |
 |
 |
| Parameter | Plot |
|---|---|
| CZT HV Monitor |  |
| D_VDD | 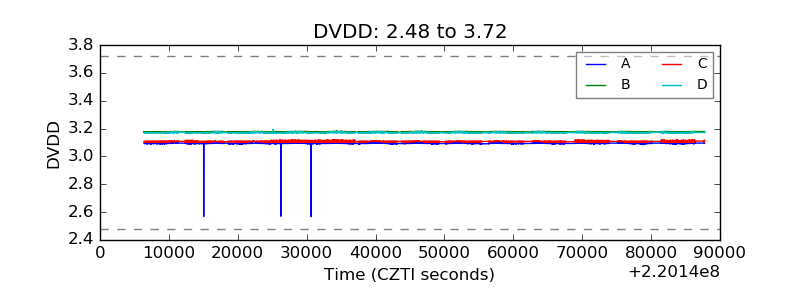 |
| Temperature 1 |  |
| Veto HV Monitor |  |
| Veto LLD |  |
| Alpha Counter |  |
| _CPM_Rate | 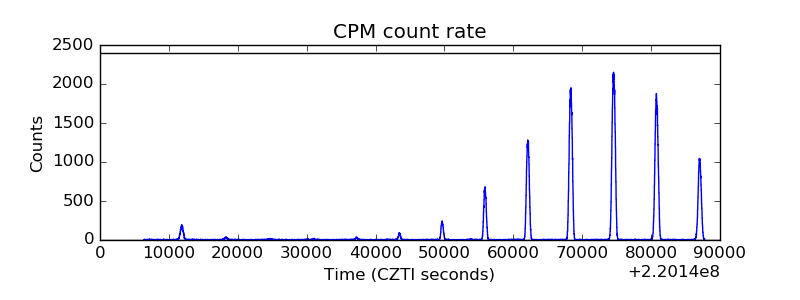 |
| CZT Counter |  |
| +2.5 Volts monitor |  |
| +5 Volts monitor |  |
| _ROLL_ROT |  |
| _Roll_DEC |  |
| _Roll_RA |  |
| Veto Counter |  |