| Param | Original file | Final file |
|---|---|---|
| Filename | modeM0/AS1T01_145T01_9000000916_06688cztM0_level2.evt | modeM0/AS1T01_145T01_9000000916_06688cztM0_level2_quad_clean.evt |
| Size (bytes) | 96,356,160 | 20,073,600 |
| Size | 91.9 MB | 19.1 MB |
| Events in quadrant A | 478,926 | 136,676 |
| Events in quadrant B | 524,443 | 139,018 |
| Events in quadrant C | 461,165 | 133,811 |
| Events in quadrant D | 1,373,751 | 111,710 |
| Mode M0 | |||
|---|---|---|---|
| Quadrant | BADHDUFLAG | Total packets | Discarded packets |
| A | 0 | 2276 | 1 |
| B | 0 | 2331 | 0 |
| C | 0 | 2260 | 0 |
| D | 0 | 4871 | 0 |
| Mode SS | |||
|---|---|---|---|
| Quadrant | BADHDUFLAG | Total packets | Discarded packets |
| A | 0 | 24 | 0 |
| B | 0 | 24 | 0 |
| C | 0 | 24 | 0 |
| D | 0 | 24 | 0 |
| Quadrant | Total seconds | Saturated seconds | Saturation percentage |
|---|---|---|---|
| A | 1128 | 2 | 0.177305% |
| B | 1128 | 2 | 0.177305% |
| C | 1128 | 0 | 0.000000% |
| D | 1128 | 158 | 14.007092% |
Noise dominated data is calculated using 1-second bins in cleaned event files. If a bin has >2000 counts, and if more than 50% of those come from <1% of pixels, then it is considered to be noise-dominated and hence unusable.
| Quadrant | # 1 sec bins | Bins with >0 counts | Bins with >2000 counts | High rate bins dominated by noise | Noise dominated (total time) | Noise dominated (detector-on time) | Marked lightcurve |
|---|---|---|---|---|---|---|---|
| A | 1128 | 1128 | 1 | 1 | 0.09% | 0.09% | 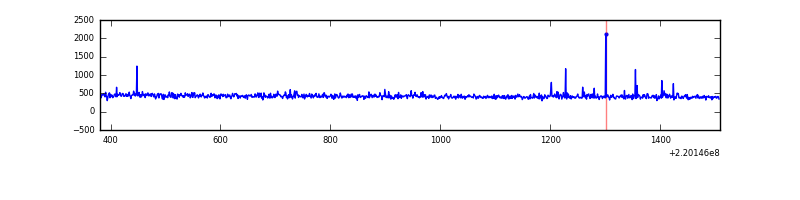 |
| B | 1128 | 1128 | 1 | 1 | 0.09% | 0.09% | 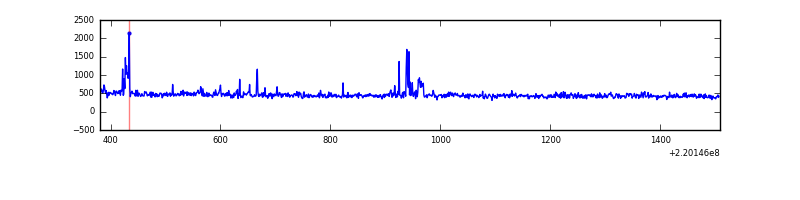 |
| C | 1128 | 1128 | 0 | 0 | 0.00% | 0.00% | 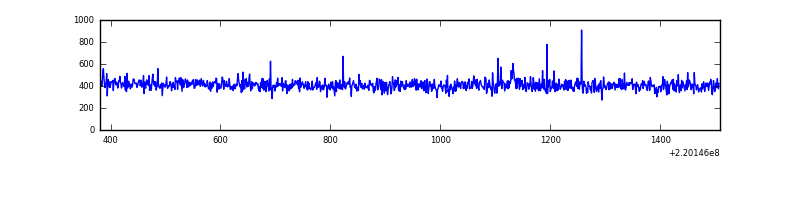 |
| D | 1128 | 1128 | 134 | 134 | 11.88% | 11.88% | 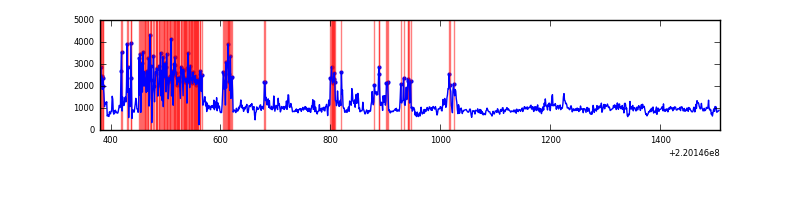 |
Top three noisy pixels from each quadrant. If the there are fewer than three noisy pixels in the level2.evt file, extra rows are filled as -1
| Pixel properties | Quadrant properties | ||||||
|---|---|---|---|---|---|---|---|
| Quadrant | DetID | PixID | Counts | Sigma | Mean | Median | Sigma |
| A | 8 | 15 | 13561 | 501.45 | 120 | 117 | 26.8 |
| A | 4 | 2 | 1265 | 42.82 | 120 | 117 | 26.8 |
| A | 12 | 194 | 1190 | 40.02 | 120 | 117 | 26.8 |
| B | 4 | 173 | 10912 | 420.61 | 124 | 121 | 25.7 |
| B | 4 | 172 | 10679 | 411.52 | 124 | 121 | 25.7 |
| B | 15 | 204 | 4951 | 188.26 | 124 | 121 | 25.7 |
| C | 9 | 54 | 2736 | 90.49 | 117 | 117 | 28.9 |
| C | 13 | 61 | 969 | 29.44 | 117 | 117 | 28.9 |
| C | 7 | 247 | 295 | 6.15 | 117 | 117 | 28.9 |
| D | 8 | 195 | 504073 | 18854.55 | 103 | 99 | 26.7 |
| D | 2 | 33 | 396445 | 14828.0 | 103 | 99 | 26.7 |
| D | 2 | 152 | 70161 | 2621.14 | 103 | 99 | 26.7 |
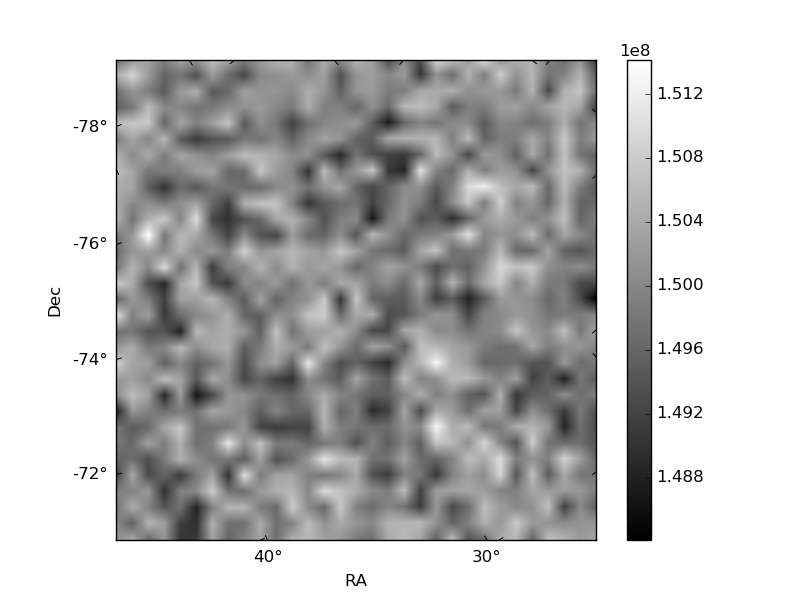
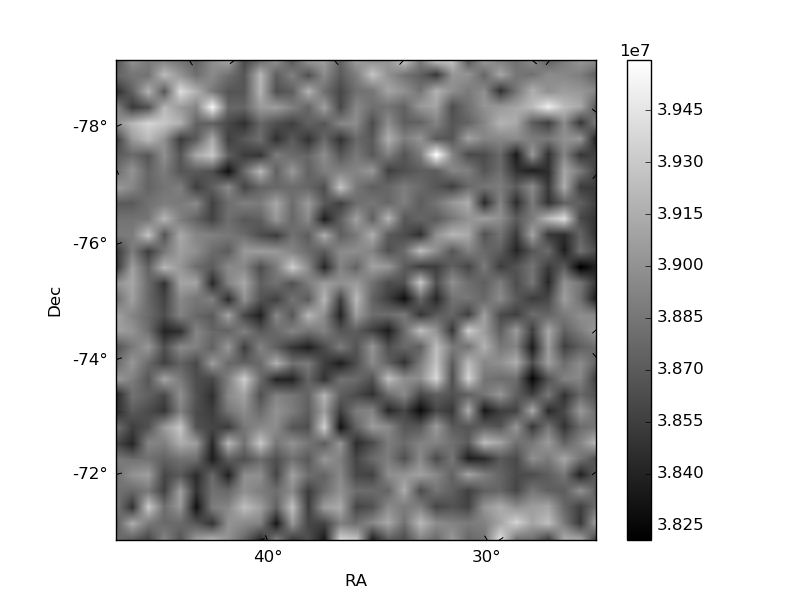
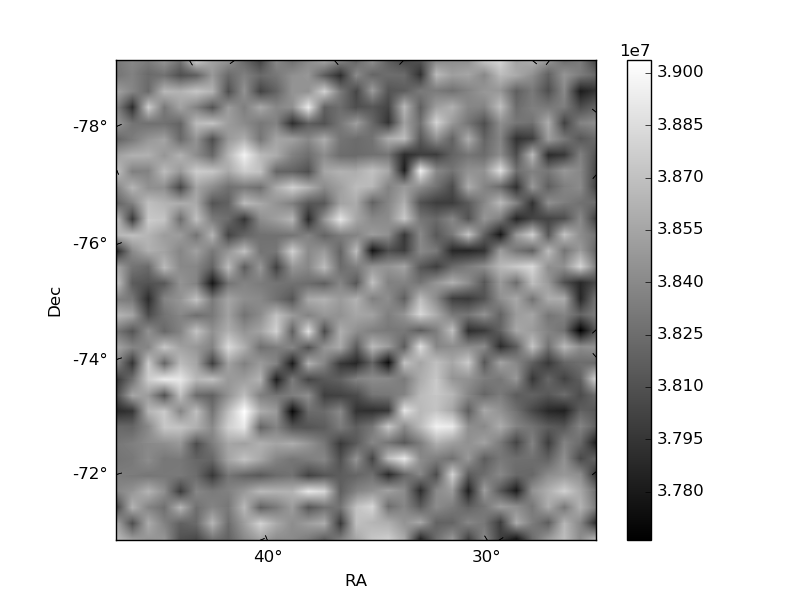
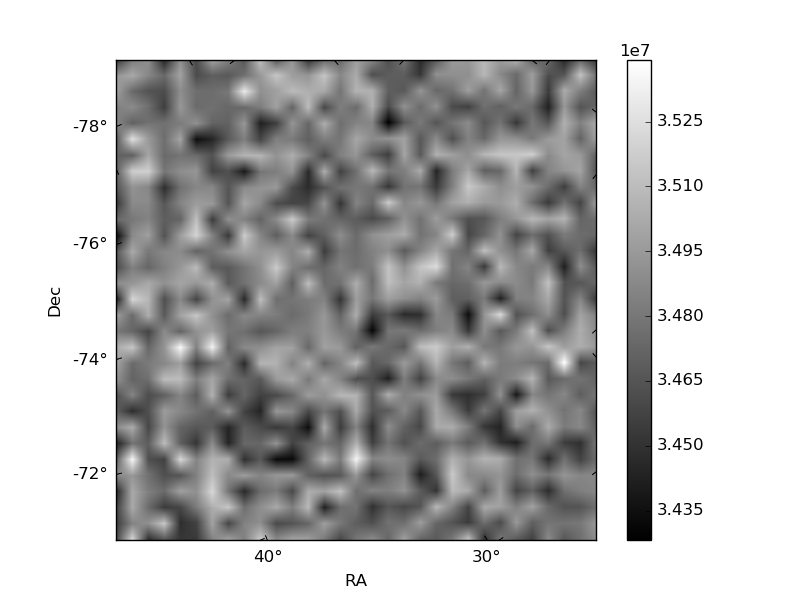
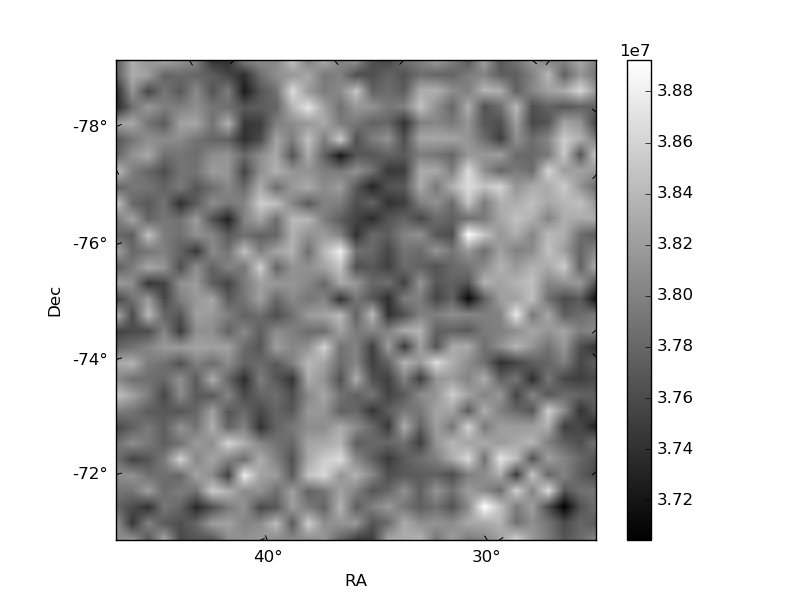
Histogram calculated using DETX and DETY for each event in the final _common_clean file
| Quadrant A | 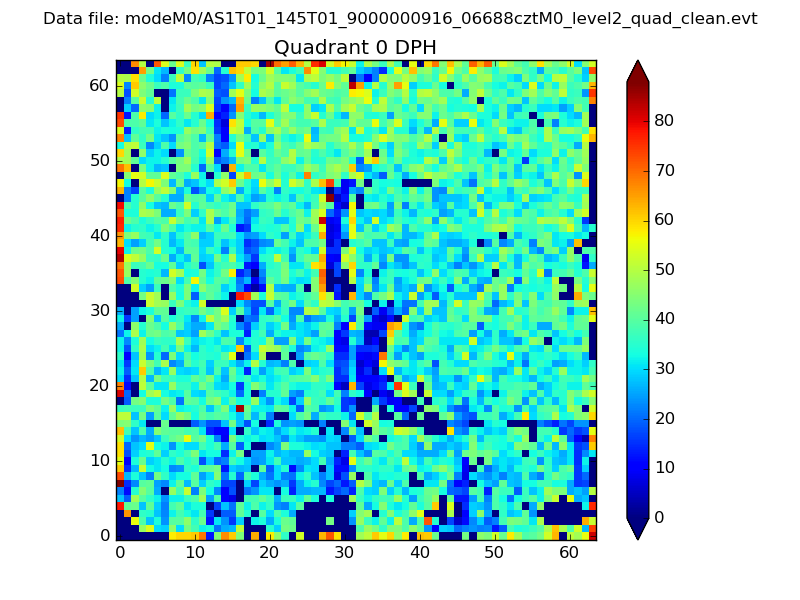 |
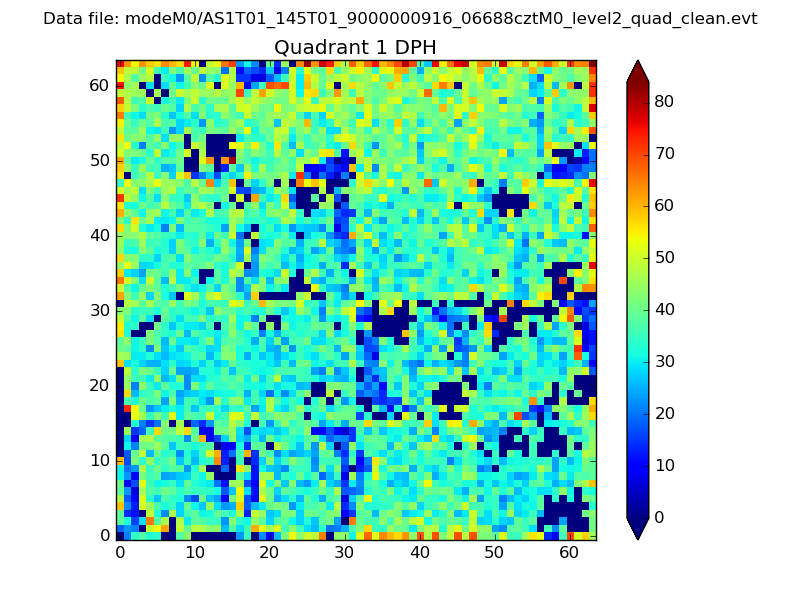 |
Quadrant B |
|---|---|---|---|
| Quadrant D | 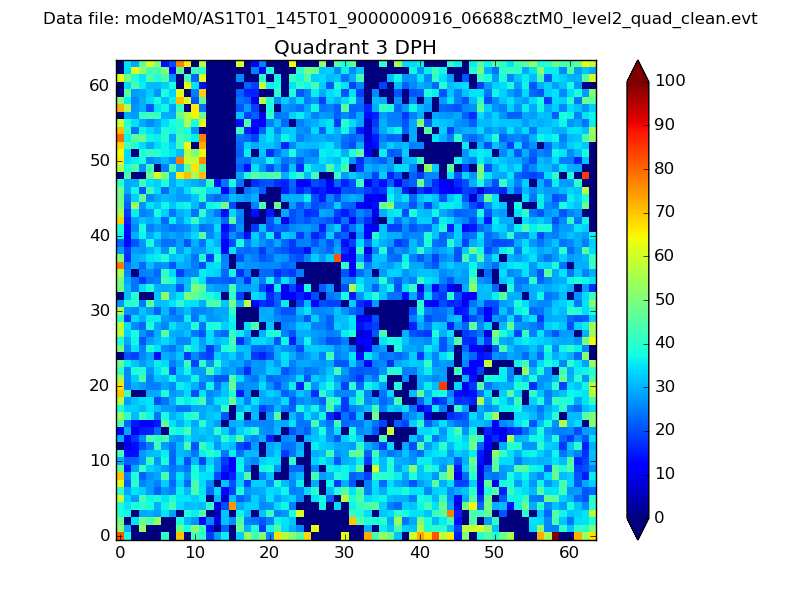 |
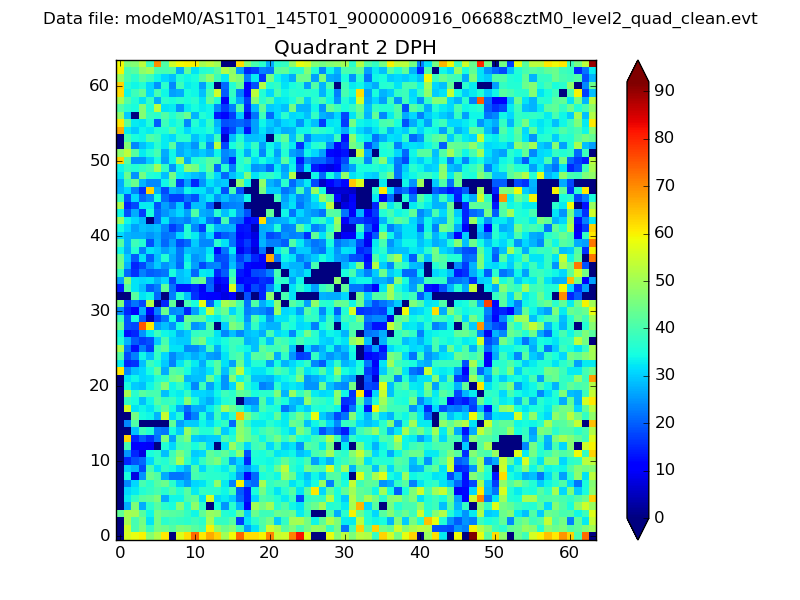 |
Quadrant C |
| Plot type | Count rate plots | Images |
|---|---|---|
| Comparison with Poisson distribution Blue bars denote a histogram of data divided into 1 sec bins. Red curve is a Poisson curve with rate = median count rate of data. |
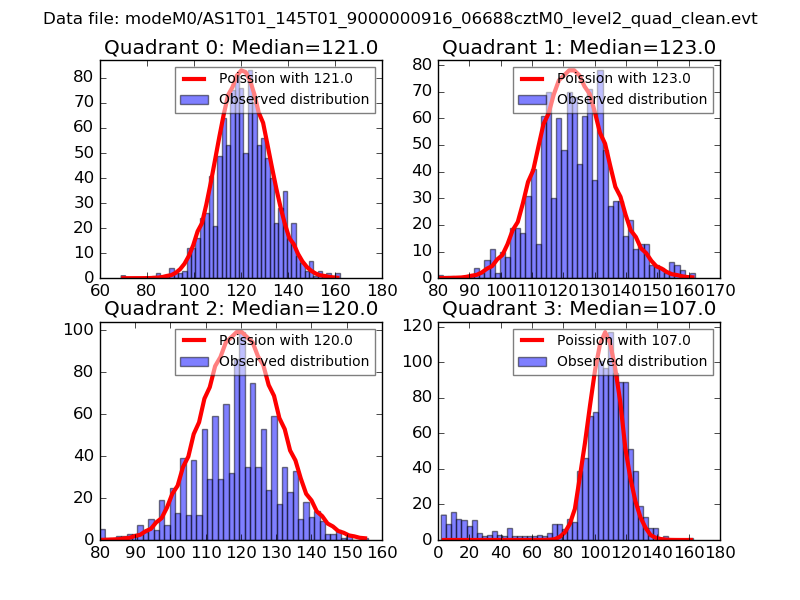 |
 |
| Quadrant-wise count rates Data is divided into 100 sec bins |
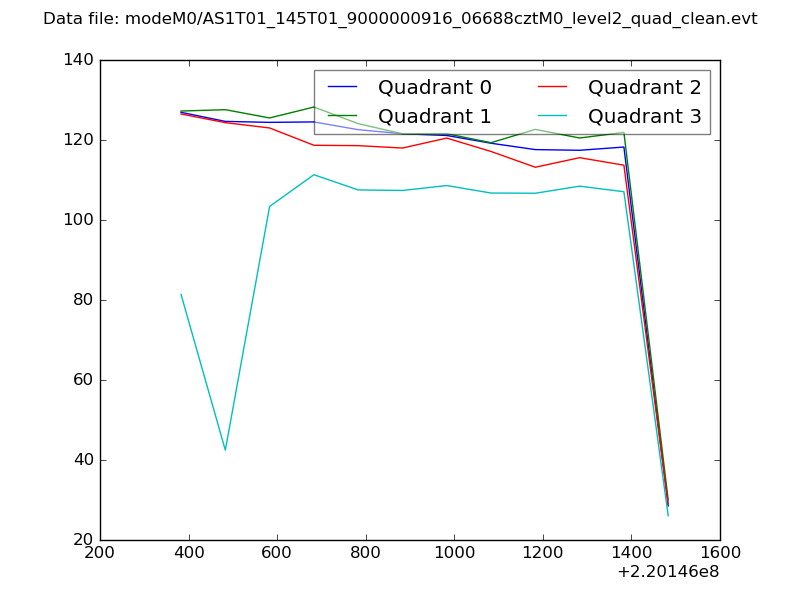 |
|
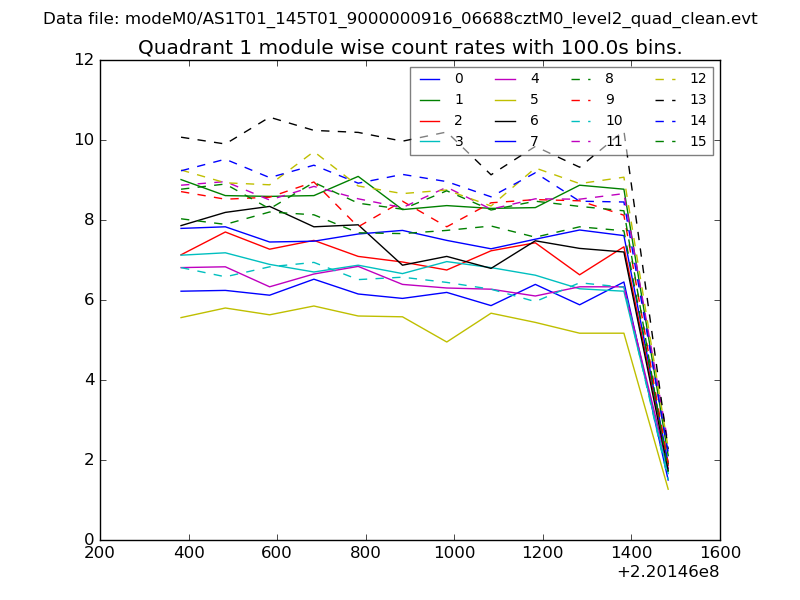
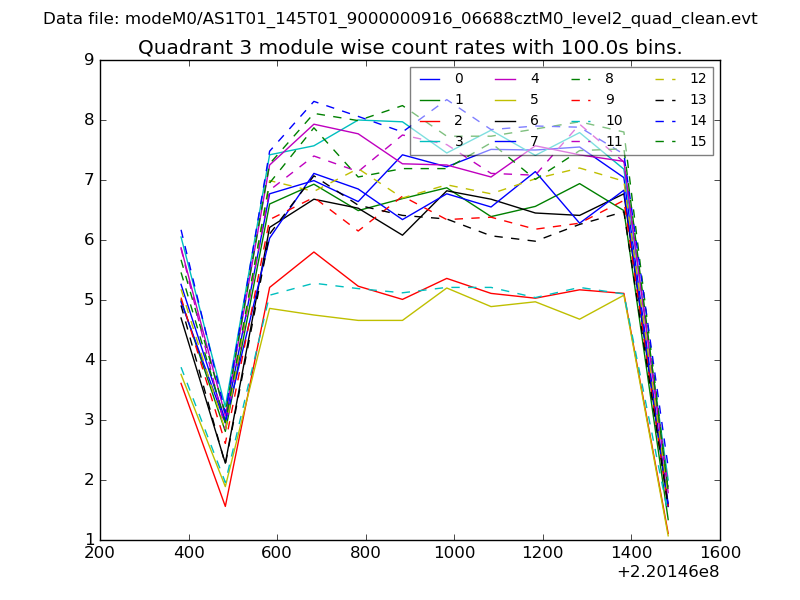
| Module-wise count rates for Quadrant A Data is divided into 100 sec bins |
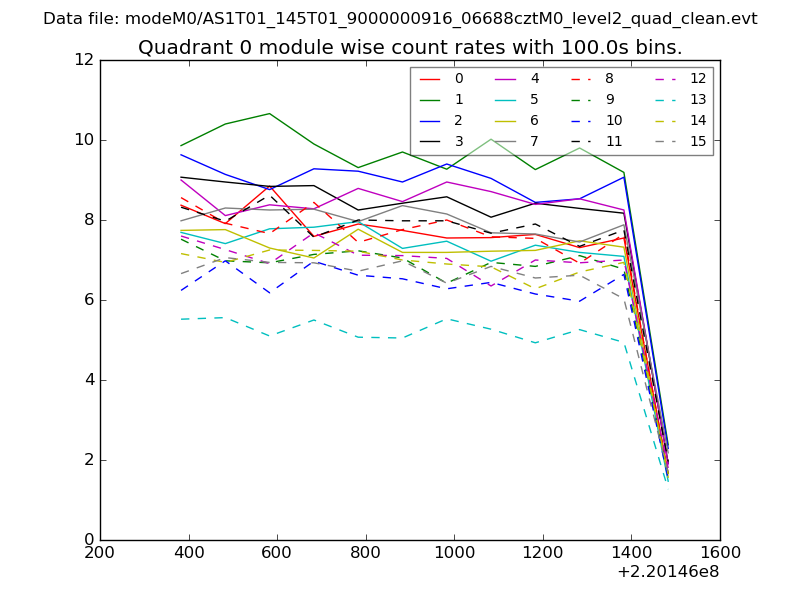 |
 |
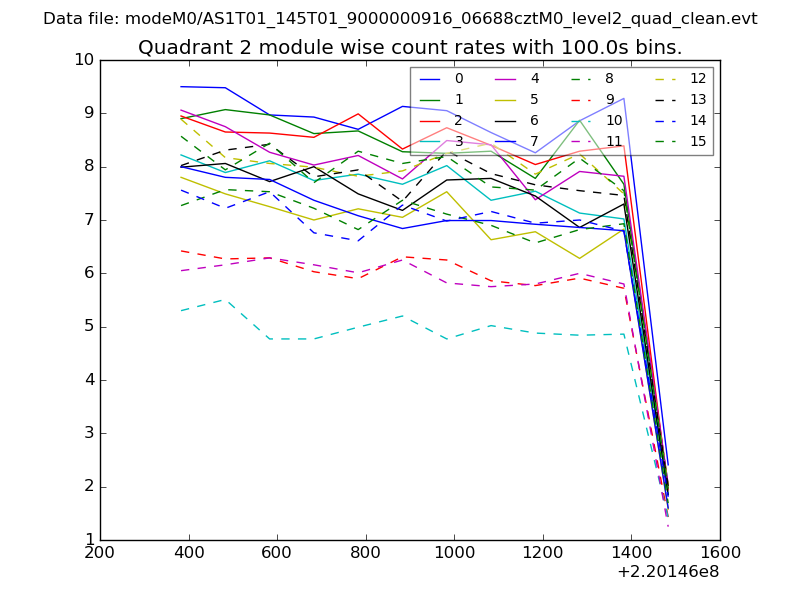
| Module-wise count rates for Quadrant B Data is divided into 100 sec bins |
 |
 |
| Module-wise count rates for Quadrant C Data is divided into 100 sec bins |
 |
 |
| Module-wise count rates for Quadrant D Data is divided into 100 sec bins |
 |
 |
| Parameter | Plot |
|---|---|
| CZT HV Monitor | 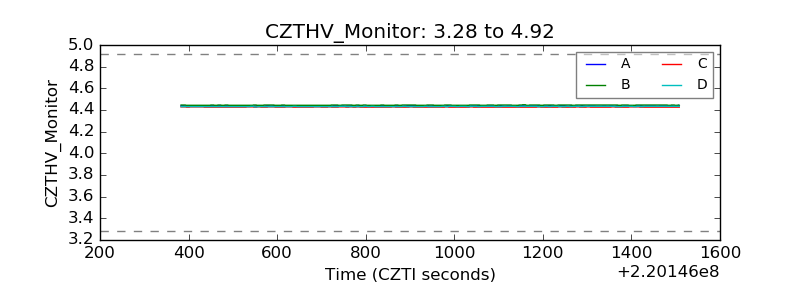 |
| D_VDD | 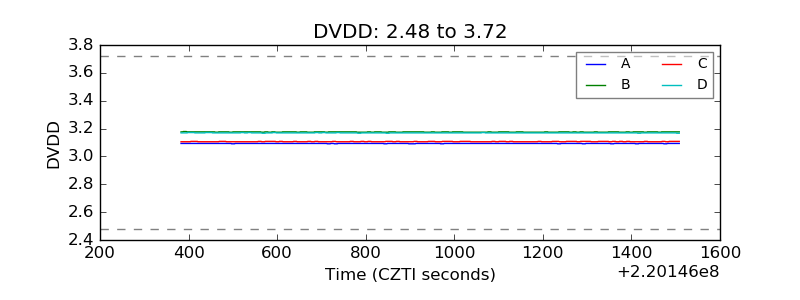 |
| Temperature 1 | 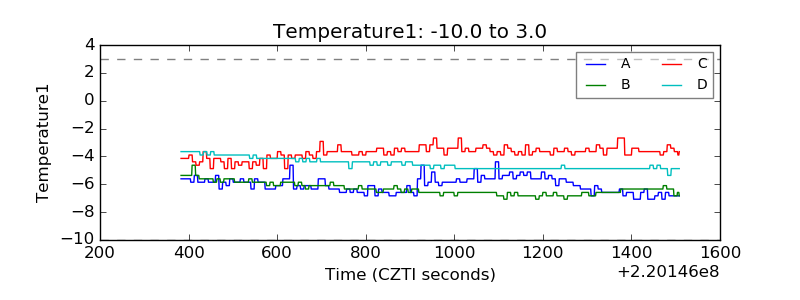 |
| Veto HV Monitor | 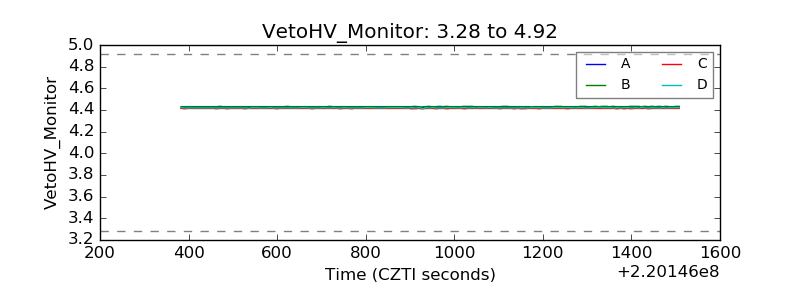 |
| Veto LLD | 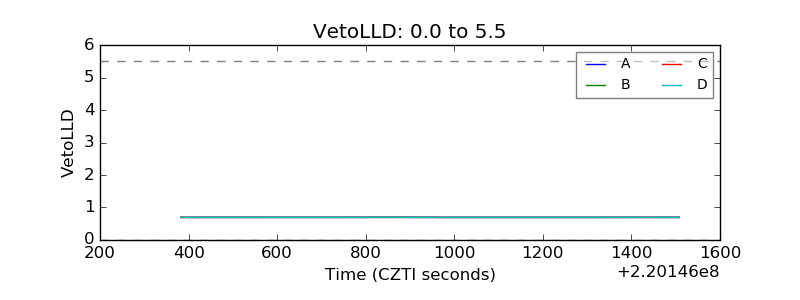 |
| Alpha Counter | 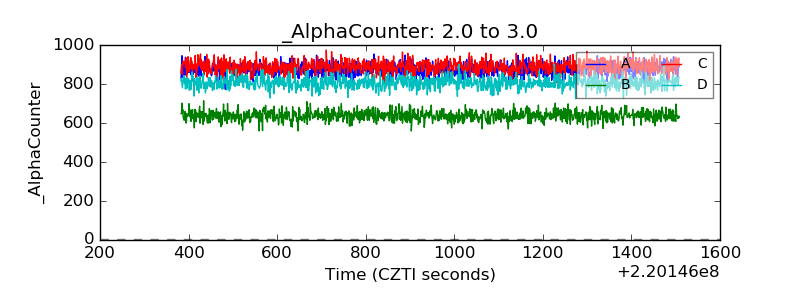 |
| _CPM_Rate | 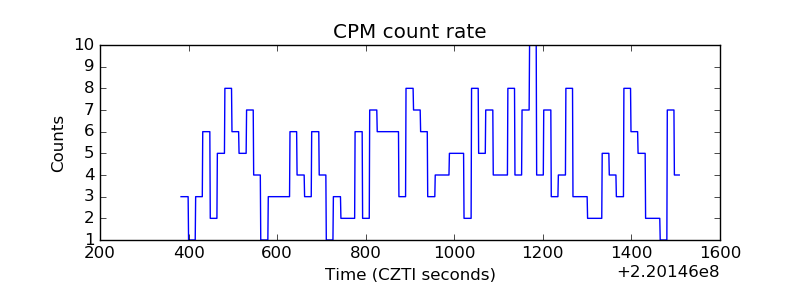 |
| CZT Counter | 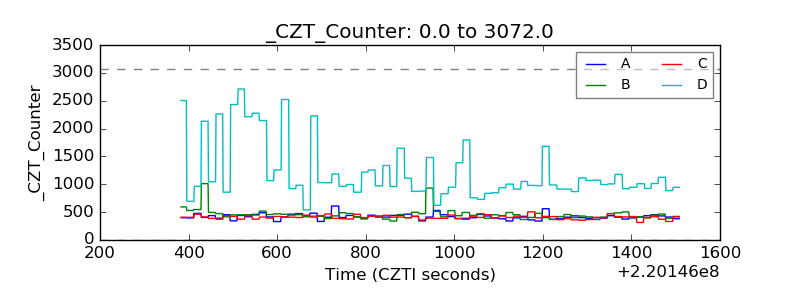 |
| +2.5 Volts monitor |  |
| +5 Volts monitor |  |
| _ROLL_ROT | 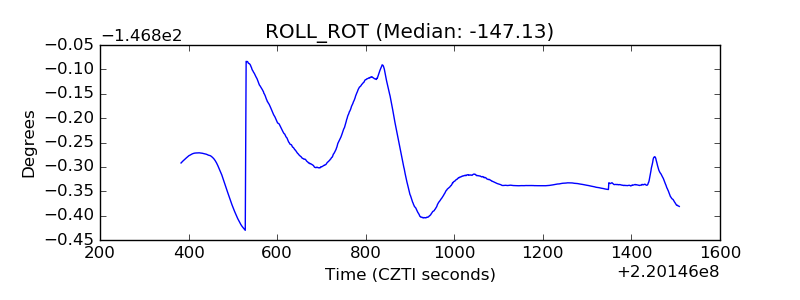 |
| _Roll_DEC | 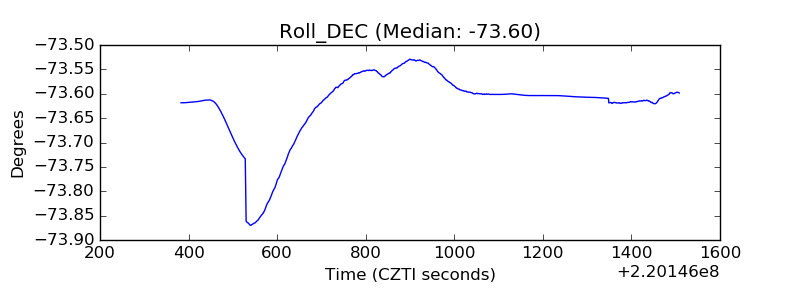 |
| _Roll_RA | 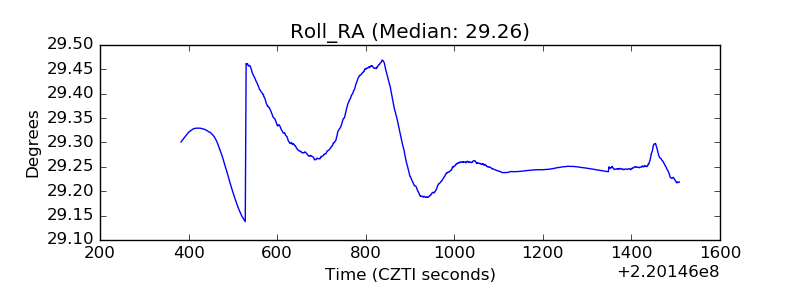 |
| Veto Counter | 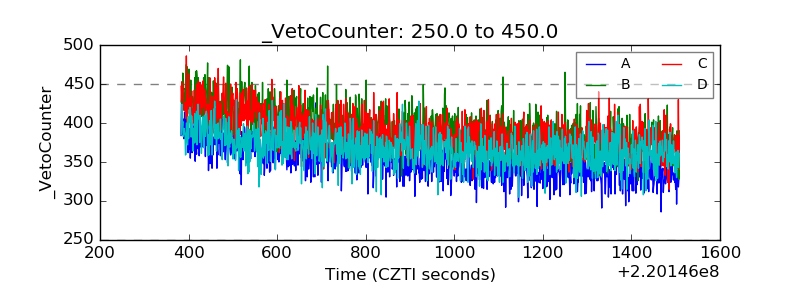 |