| Param | Original file | Final file |
|---|---|---|
| Filename | modeM0/AS1T01_145T01_9000000916_06689cztM0_level2.evt | modeM0/AS1T01_145T01_9000000916_06689cztM0_level2_quad_clean.evt |
| Size (bytes) | 570,490,560 | 117,728,640 |
| Size | 544.1 MB | 112.3 MB |
| Events in quadrant A | 2,940,121 | 803,116 |
| Events in quadrant B | 3,241,984 | 817,394 |
| Events in quadrant C | 2,876,769 | 799,359 |
| Events in quadrant D | 7,763,057 | 677,041 |
| Mode M0 | |||
|---|---|---|---|
| Quadrant | BADHDUFLAG | Total packets | Discarded packets |
| A | 0 | 13697 | 2 |
| B | 0 | 14317 | 1 |
| C | 0 | 13606 | 1 |
| D | 0 | 27776 | 1 |
| Mode M9 | |||
|---|---|---|---|
| Quadrant | BADHDUFLAG | Total packets | Discarded packets |
| A | 0 | 9 | 0 |
| B | 0 | 9 | 0 |
| C | 0 | 9 | 0 |
| D | 0 | 9 | 0 |
| Mode SS | |||
|---|---|---|---|
| Quadrant | BADHDUFLAG | Total packets | Discarded packets |
| A | 0 | 138 | 0 |
| B | 0 | 138 | 0 |
| C | 0 | 138 | 0 |
| D | 0 | 138 | 0 |
| Quadrant | Total seconds | Saturated seconds | Saturation percentage |
|---|---|---|---|
| A | 6714 | 37 | 0.551087% |
| B | 6714 | 85 | 1.266011% |
| C | 6714 | 39 | 0.580876% |
| D | 6714 | 1112 | 16.562407% |
Noise dominated data is calculated using 1-second bins in cleaned event files. If a bin has >2000 counts, and if more than 50% of those come from <1% of pixels, then it is considered to be noise-dominated and hence unusable.
| Quadrant | # 1 sec bins | Bins with >0 counts | Bins with >2000 counts | High rate bins dominated by noise | Noise dominated (total time) | Noise dominated (detector-on time) | Marked lightcurve |
|---|---|---|---|---|---|---|---|
| A | 7634 | 6715 | 1 | 1 | 0.01% | 0.01% | 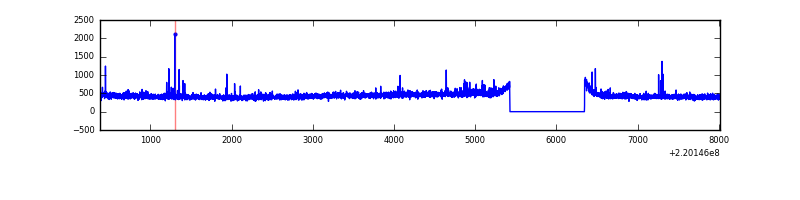 |
| B | 7634 | 6715 | 16 | 16 | 0.21% | 0.24% | 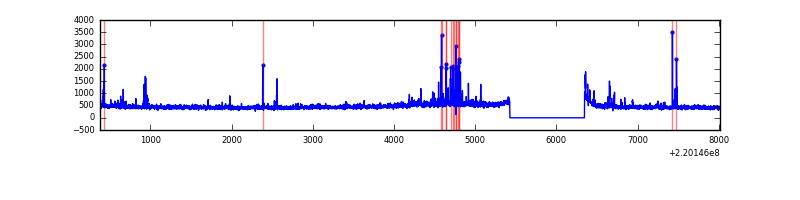 |
| C | 7634 | 6715 | 0 | 0 | 0.00% | 0.00% | 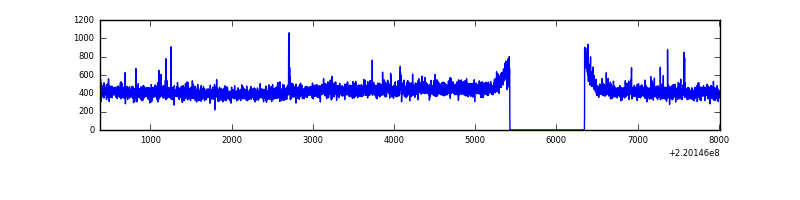 |
| D | 7634 | 6715 | 817 | 817 | 10.70% | 12.17% | 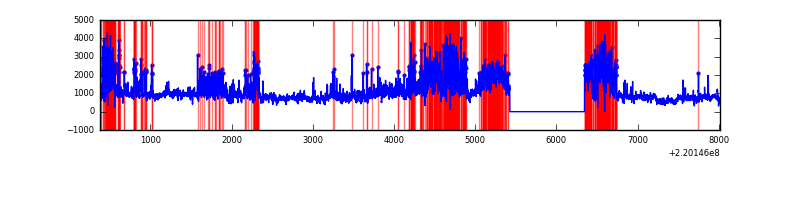 |
Top three noisy pixels from each quadrant. If the there are fewer than three noisy pixels in the level2.evt file, extra rows are filled as -1
| Pixel properties | Quadrant properties | ||||||
|---|---|---|---|---|---|---|---|
| Quadrant | DetID | PixID | Counts | Sigma | Mean | Median | Sigma |
| A | 8 | 15 | 54179 | 351.53 | 745 | 730 | 152.0 |
| A | 12 | 194 | 7515 | 44.62 | 745 | 730 | 152.0 |
| A | 0 | 226 | 7083 | 41.78 | 745 | 730 | 152.0 |
| B | 0 | 214 | 75060 | 517.25 | 758 | 739 | 143.7 |
| B | 4 | 170 | 52406 | 359.58 | 758 | 739 | 143.7 |
| B | 0 | 198 | 35155 | 239.52 | 758 | 739 | 143.7 |
| C | 12 | 4 | 12197 | 68.24 | 729 | 729 | 168.0 |
| C | 9 | 54 | 9339 | 51.24 | 729 | 729 | 168.0 |
| C | 13 | 61 | 5730 | 29.76 | 729 | 729 | 168.0 |
| D | 8 | 195 | 2430176 | 15024.18 | 660 | 638 | 161.7 |
| D | 2 | 33 | 2228634 | 13777.85 | 660 | 638 | 161.7 |
| D | 2 | 152 | 338396 | 2088.68 | 660 | 638 | 161.7 |
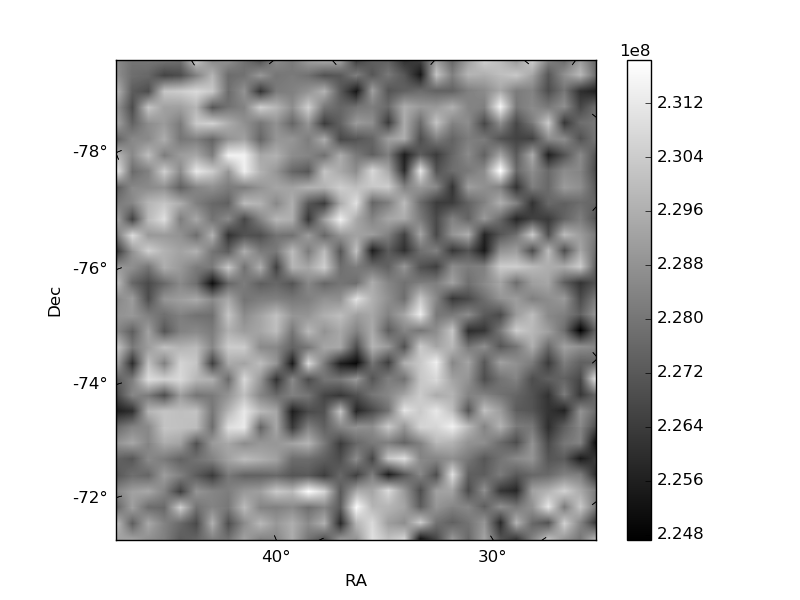
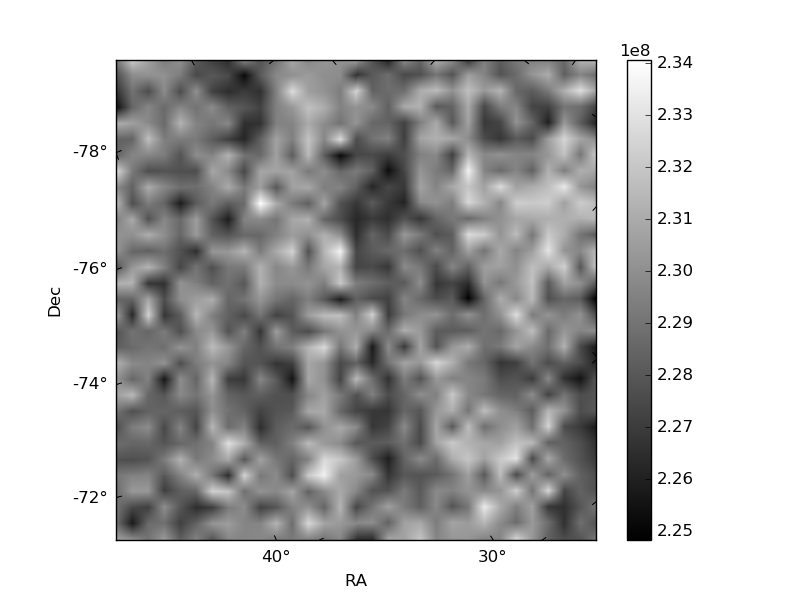
Histogram calculated using DETX and DETY for each event in the final _common_clean file
| Quadrant A | 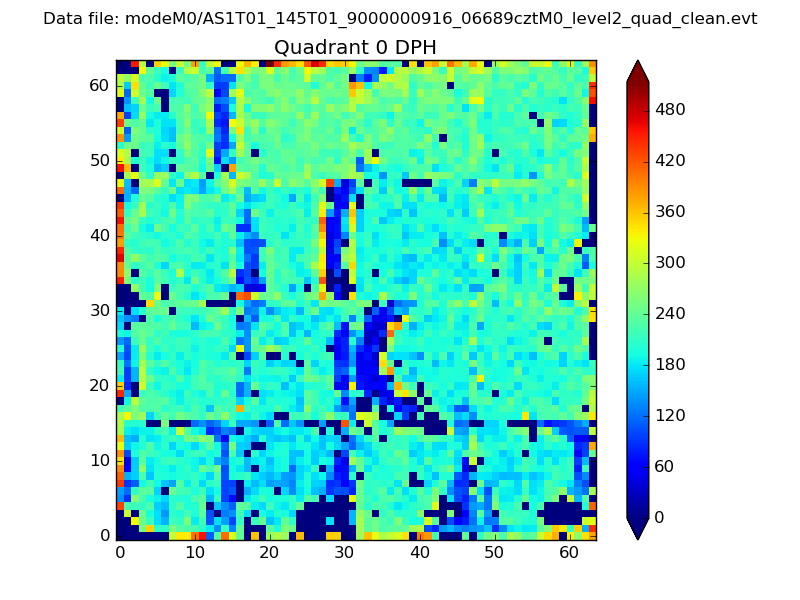 |
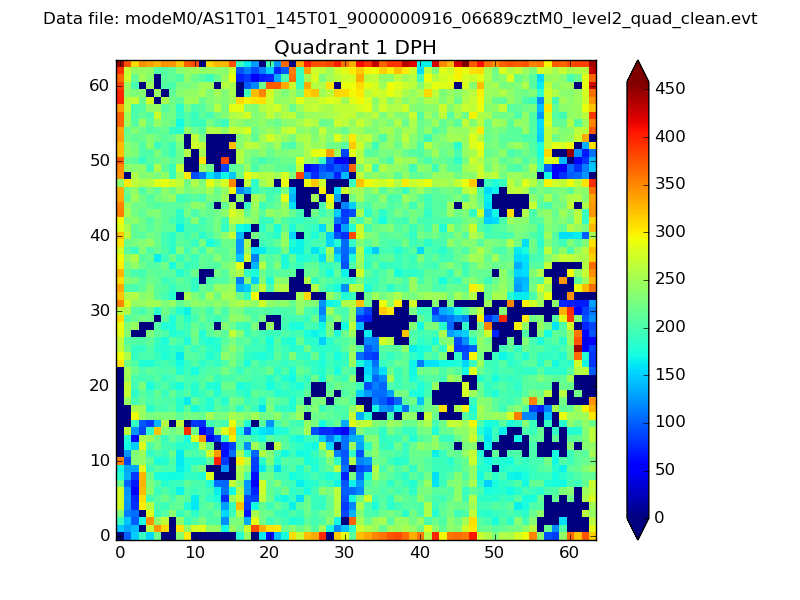 |
Quadrant B |
|---|---|---|---|
| Quadrant D | 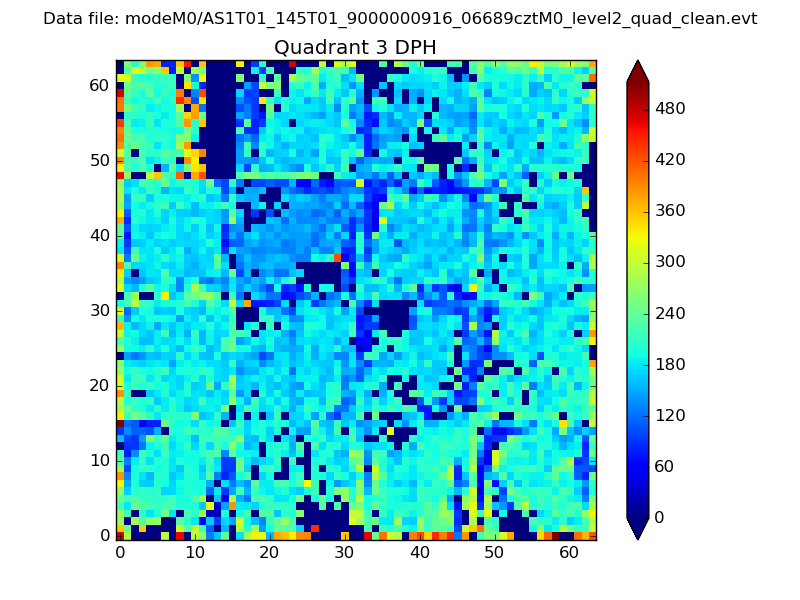 |
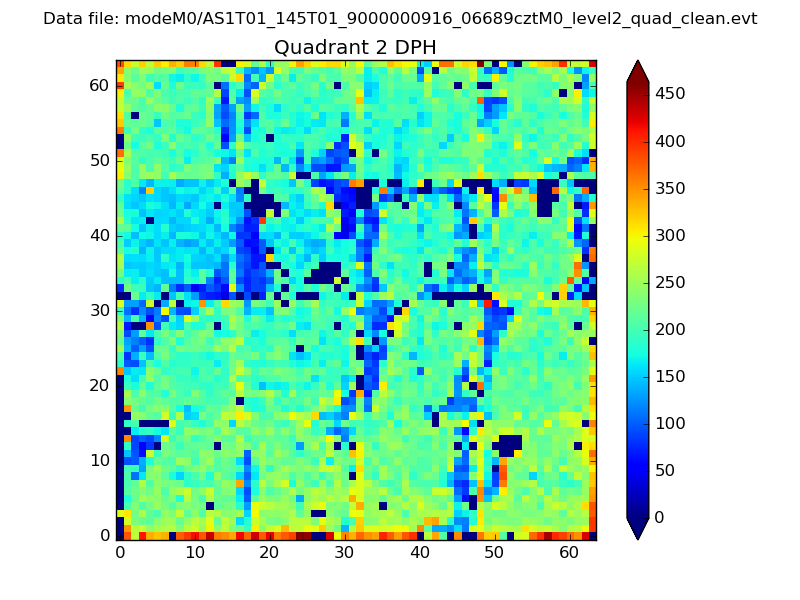 |
Quadrant C |
| Plot type | Count rate plots | Images |
|---|---|---|
| Comparison with Poisson distribution Blue bars denote a histogram of data divided into 1 sec bins. Red curve is a Poisson curve with rate = median count rate of data. |
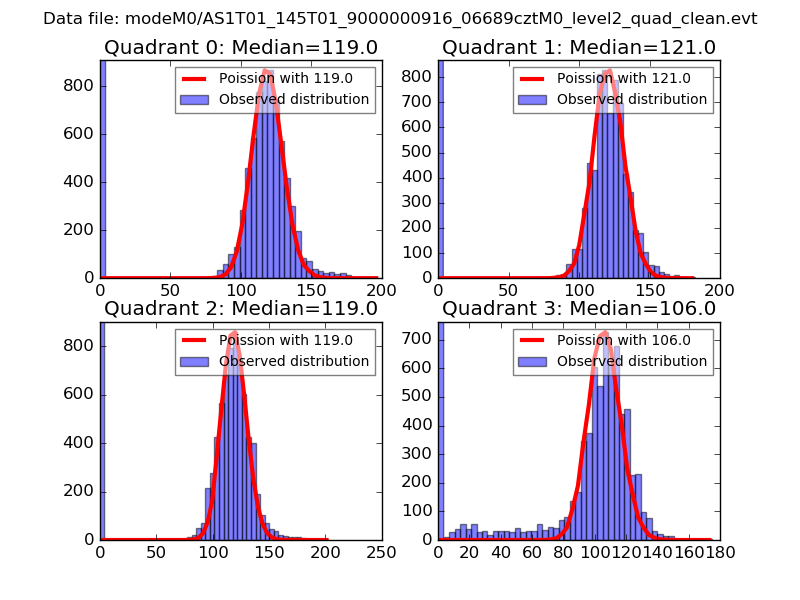 |
 |
| Quadrant-wise count rates Data is divided into 100 sec bins |
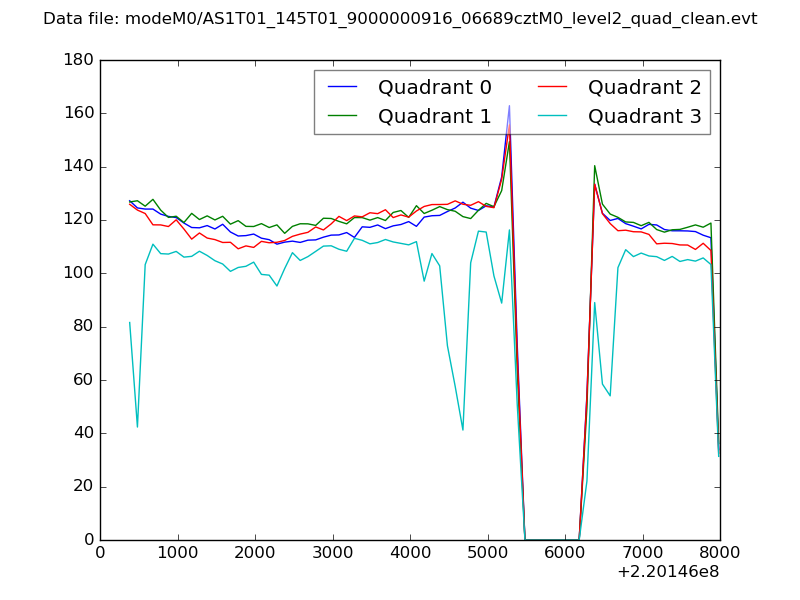 |
|
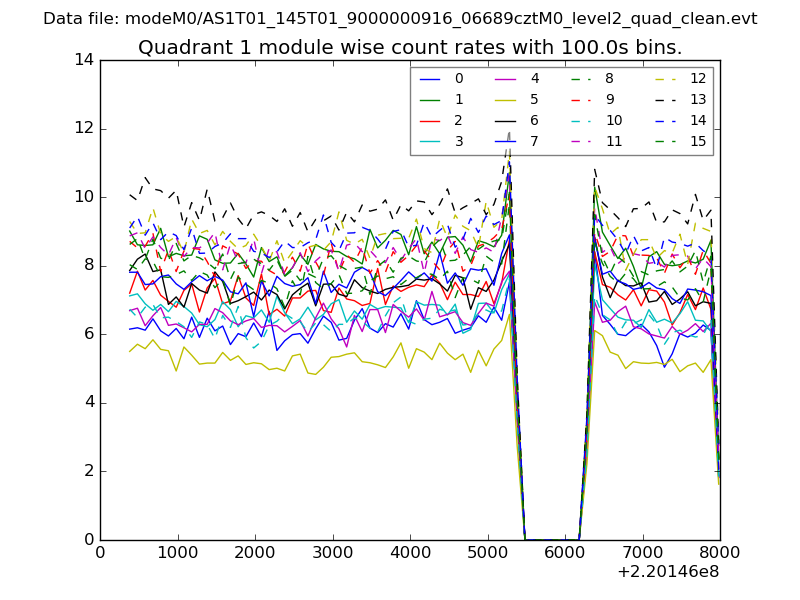
| Module-wise count rates for Quadrant A Data is divided into 100 sec bins |
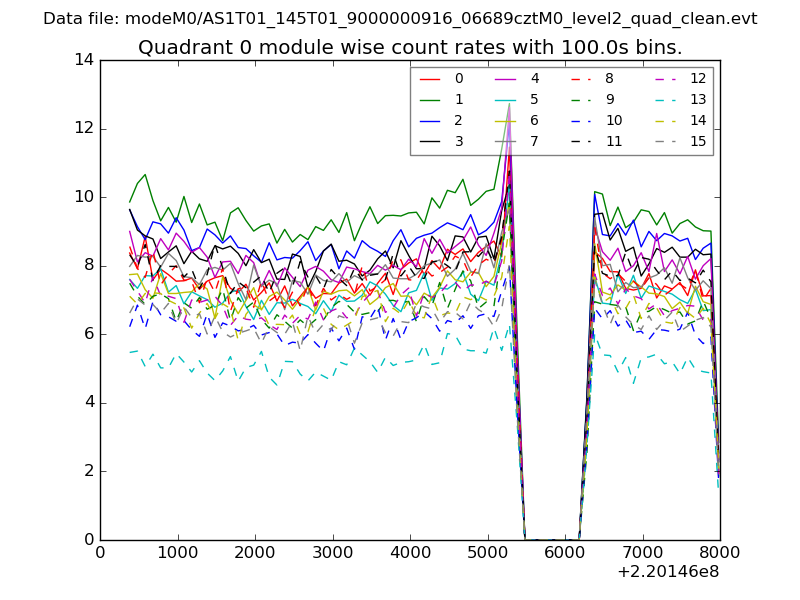 |
 |
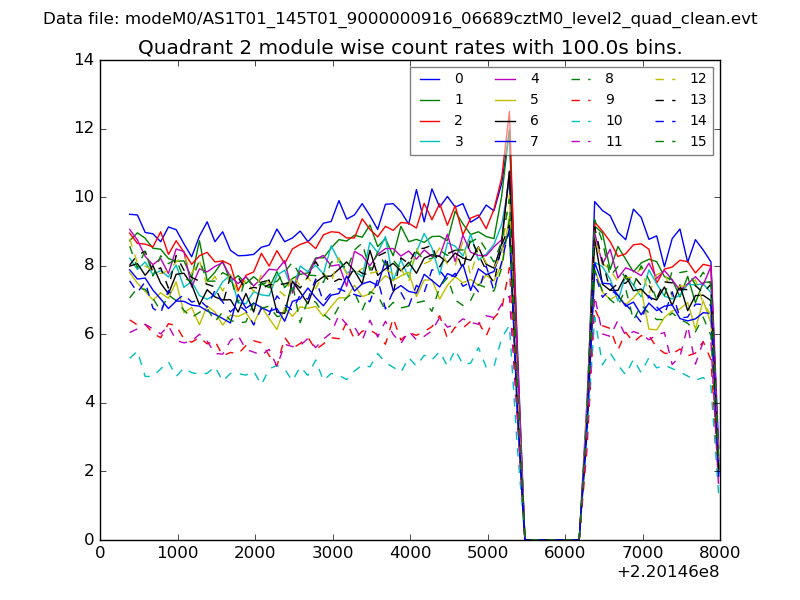
| Module-wise count rates for Quadrant B Data is divided into 100 sec bins |
 |
 |
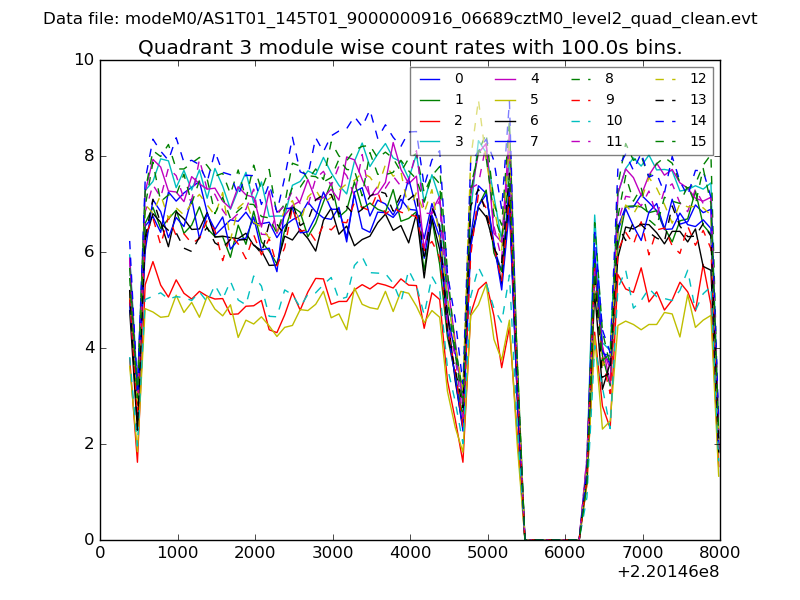
| Module-wise count rates for Quadrant C Data is divided into 100 sec bins |
 |
 |
| Module-wise count rates for Quadrant D Data is divided into 100 sec bins |
 |
 |
| Parameter | Plot |
|---|---|
| CZT HV Monitor | 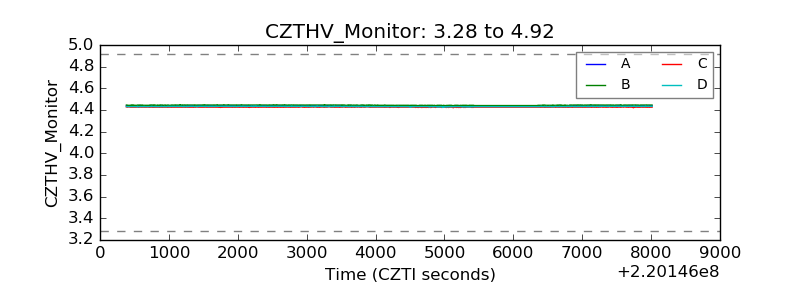 |
| D_VDD | 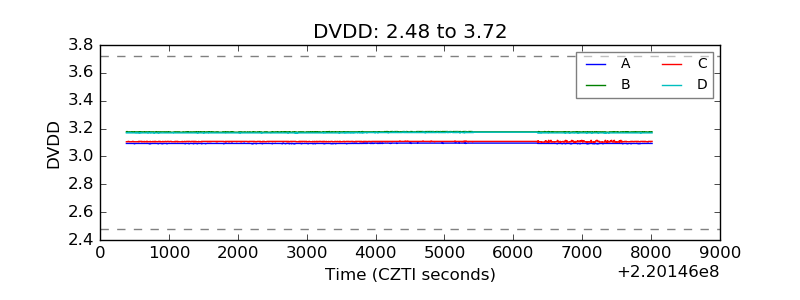 |
| Temperature 1 | 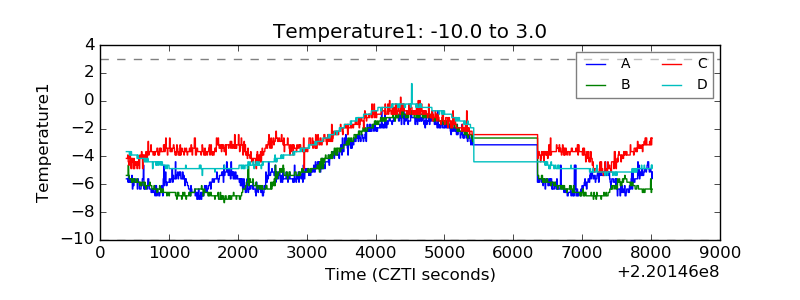 |
| Veto HV Monitor |  |
| Veto LLD | 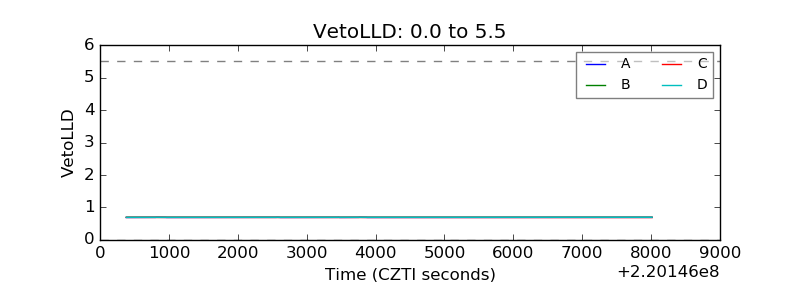 |
| Alpha Counter | 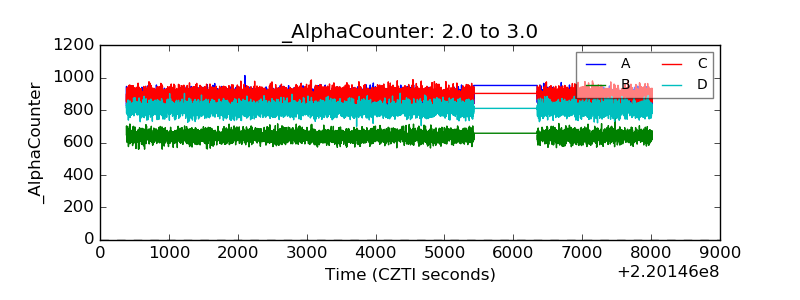 |
| _CPM_Rate | 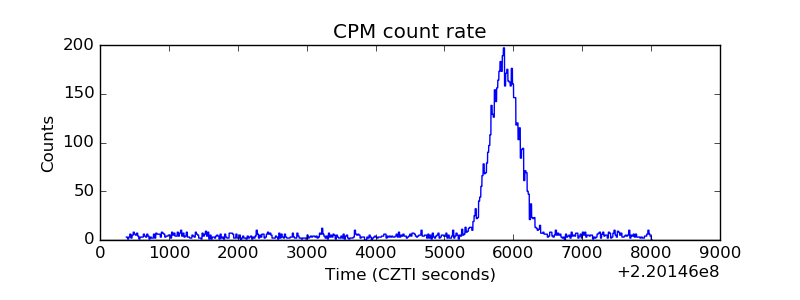 |
| CZT Counter | 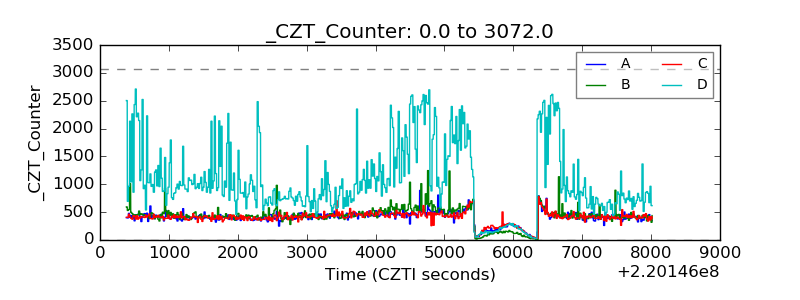 |
| +2.5 Volts monitor |  |
| +5 Volts monitor | 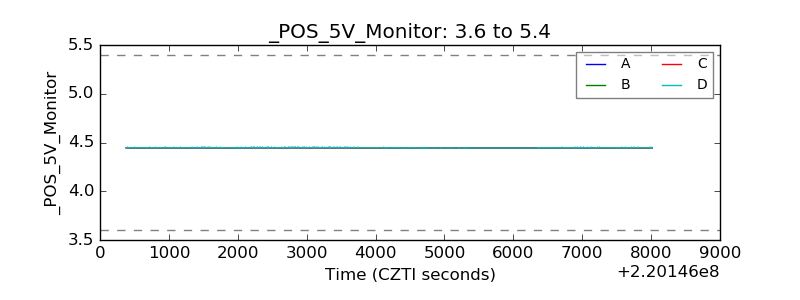 |
| _ROLL_ROT | 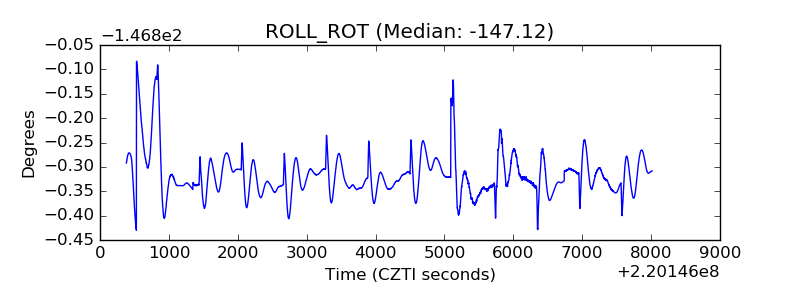 |
| _Roll_DEC | 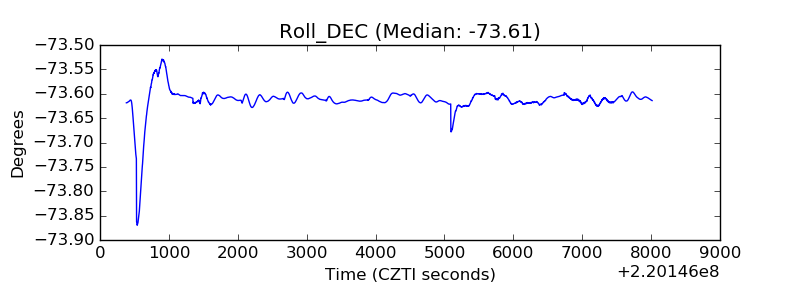 |
| _Roll_RA |  |
| Veto Counter | 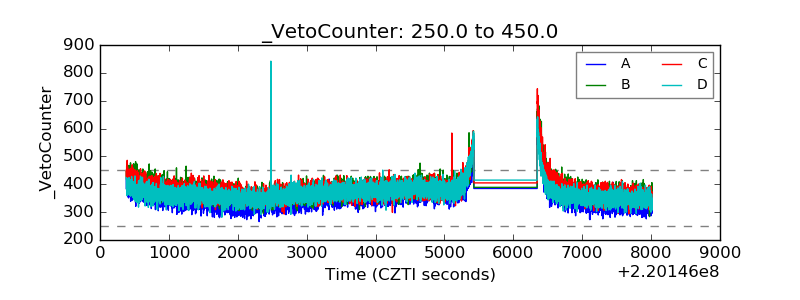 |