| Param | Original file | Final file |
|---|---|---|
| Filename | modeM0/AS1T01_145T01_9000000916_06691cztM0_level2.evt | modeM0/AS1T01_145T01_9000000916_06691cztM0_level2_quad_clean.evt |
| Size (bytes) | 629,749,440 | 123,500,160 |
| Size | 600.6 MB | 117.8 MB |
| Events in quadrant A | 3,349,499 | 853,889 |
| Events in quadrant B | 3,858,562 | 868,940 |
| Events in quadrant C | 3,340,654 | 854,071 |
| Events in quadrant D | 8,020,900 | 647,472 |
| Mode M0 | |||
|---|---|---|---|
| Quadrant | BADHDUFLAG | Total packets | Discarded packets |
| A | 0 | 15337 | 3 |
| B | 0 | 16661 | 2 |
| C | 0 | 15438 | 2 |
| D | 0 | 29013 | 2 |
| Mode M9 | |||
|---|---|---|---|
| Quadrant | BADHDUFLAG | Total packets | Discarded packets |
| A | 0 | 1 | 0 |
| B | 0 | 1 | 0 |
| C | 0 | 1 | 0 |
| D | 0 | 1 | 0 |
| Mode SS | |||
|---|---|---|---|
| Quadrant | BADHDUFLAG | Total packets | Discarded packets |
| A | 0 | 148 | 0 |
| B | 0 | 148 | 0 |
| C | 0 | 148 | 0 |
| D | 0 | 148 | 0 |
| Quadrant | Total seconds | Saturated seconds | Saturation percentage |
|---|---|---|---|
| A | 7403 | 284 | 3.836283% |
| B | 7403 | 294 | 3.971363% |
| C | 7403 | 271 | 3.660678% |
| D | 7403 | 2173 | 29.352965% |
Noise dominated data is calculated using 1-second bins in cleaned event files. If a bin has >2000 counts, and if more than 50% of those come from <1% of pixels, then it is considered to be noise-dominated and hence unusable.
| Quadrant | # 1 sec bins | Bins with >0 counts | Bins with >2000 counts | High rate bins dominated by noise | Noise dominated (total time) | Noise dominated (detector-on time) | Marked lightcurve |
|---|---|---|---|---|---|---|---|
| A | 7473 | 7406 | 0 | 0 | 0.00% | 0.00% | 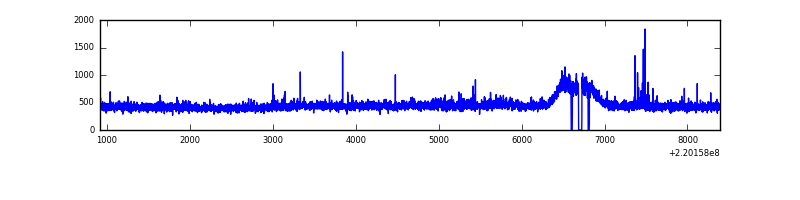 |
| B | 7473 | 7406 | 3 | 3 | 0.04% | 0.04% | 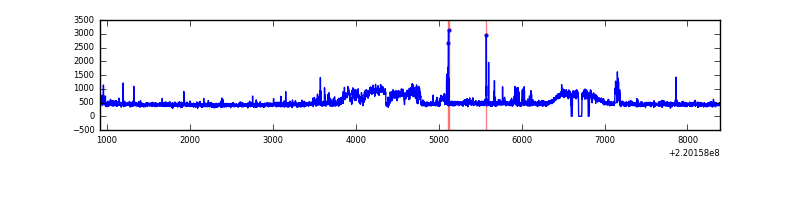 |
| C | 7473 | 7406 | 0 | 0 | 0.00% | 0.00% |  |
| D | 7473 | 7406 | 1448 | 1448 | 19.38% | 19.55% |  |
Top three noisy pixels from each quadrant. If the there are fewer than three noisy pixels in the level2.evt file, extra rows are filled as -1
| Pixel properties | Quadrant properties | ||||||
|---|---|---|---|---|---|---|---|
| Quadrant | DetID | PixID | Counts | Sigma | Mean | Median | Sigma |
| A | 8 | 15 | 53511 | 300.62 | 845 | 823 | 175.3 |
| A | 4 | 2 | 22185 | 121.88 | 845 | 823 | 175.3 |
| A | 0 | 23 | 9636 | 50.28 | 845 | 823 | 175.3 |
| B | 0 | 228 | 316086 | 1914.6 | 857 | 833 | 164.7 |
| B | 0 | 214 | 90173 | 542.58 | 857 | 833 | 164.7 |
| B | 4 | 81 | 54481 | 325.82 | 857 | 833 | 164.7 |
| C | 9 | 54 | 81888 | 417.73 | 833 | 834 | 194.0 |
| C | 13 | 61 | 6427 | 28.82 | 833 | 834 | 194.0 |
| C | 8 | 128 | 4807 | 20.48 | 833 | 834 | 194.0 |
| D | 2 | 33 | 4463441 | 26578.05 | 684 | 661 | 167.9 |
| D | 8 | 195 | 695648 | 4138.99 | 684 | 661 | 167.9 |
| D | 2 | 152 | 103326 | 611.42 | 684 | 661 | 167.9 |
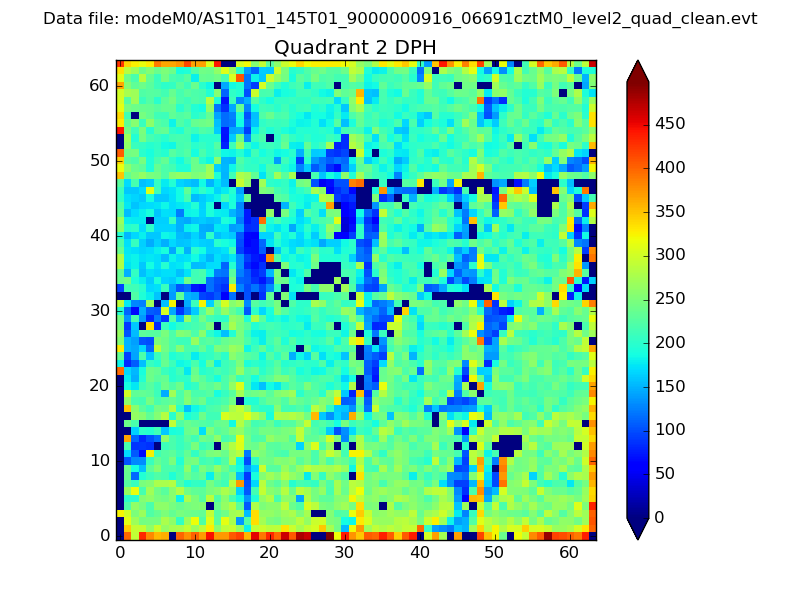
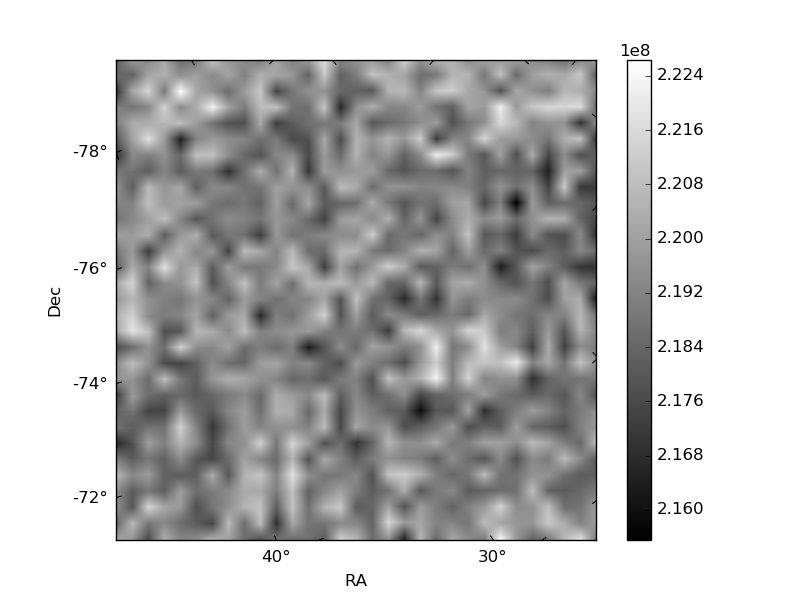
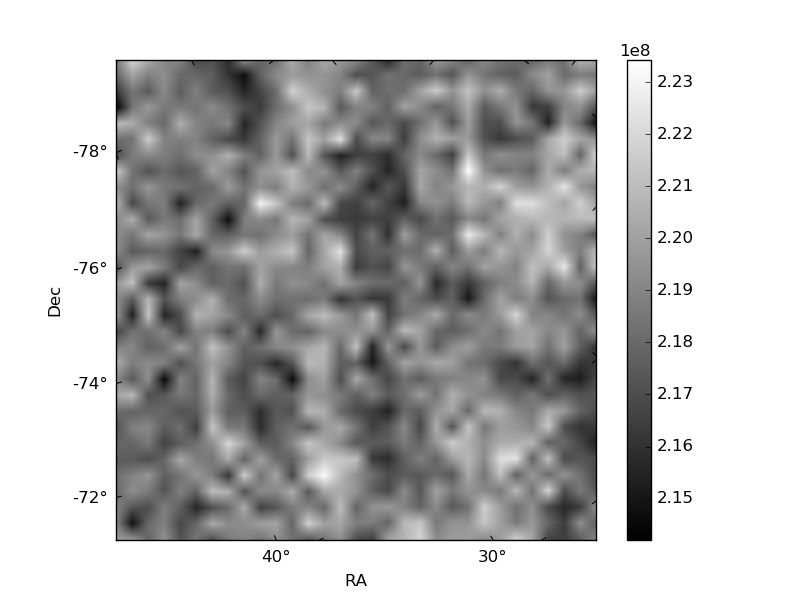
Histogram calculated using DETX and DETY for each event in the final _common_clean file
| Quadrant A | 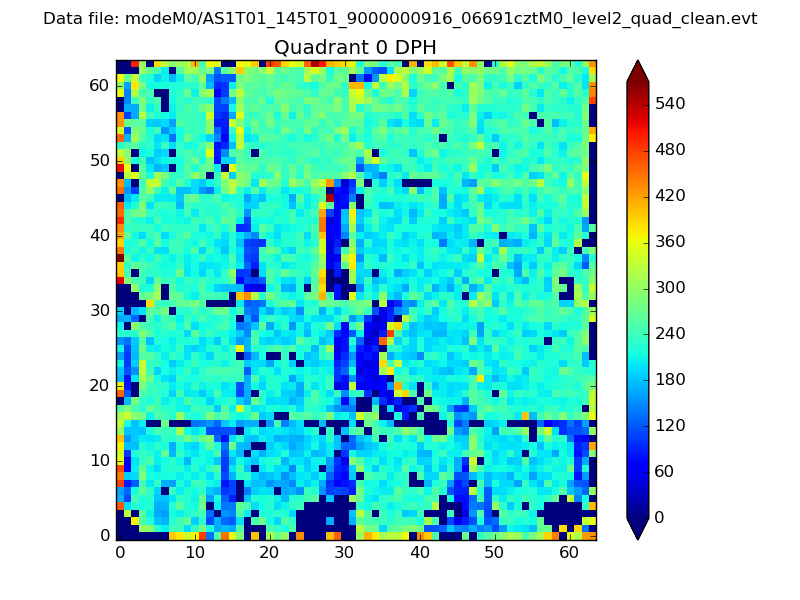 |
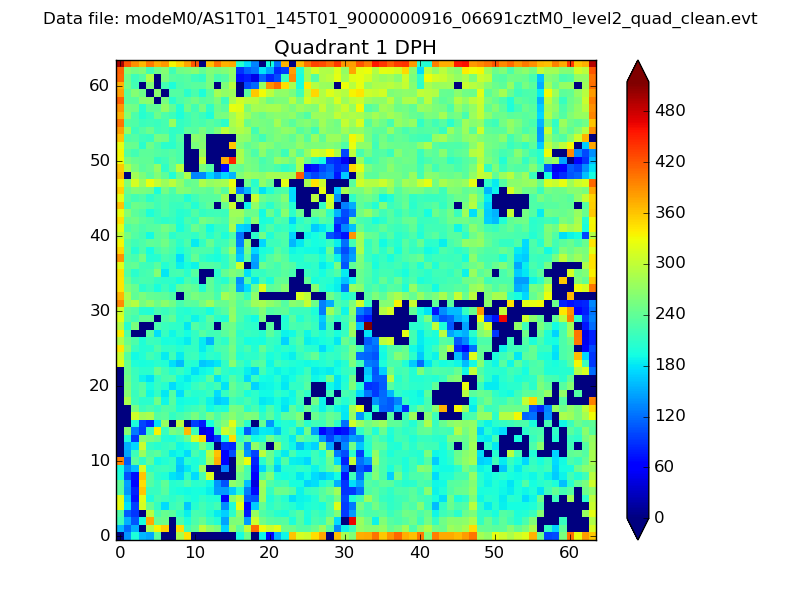 |
Quadrant B |
|---|---|---|---|
| Quadrant D | 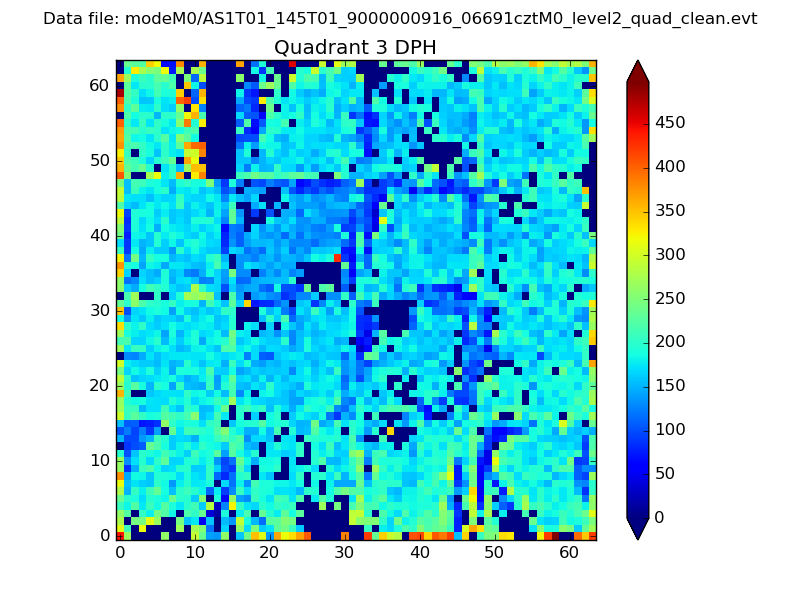 |
 |
Quadrant C |
| Plot type | Count rate plots | Images |
|---|---|---|
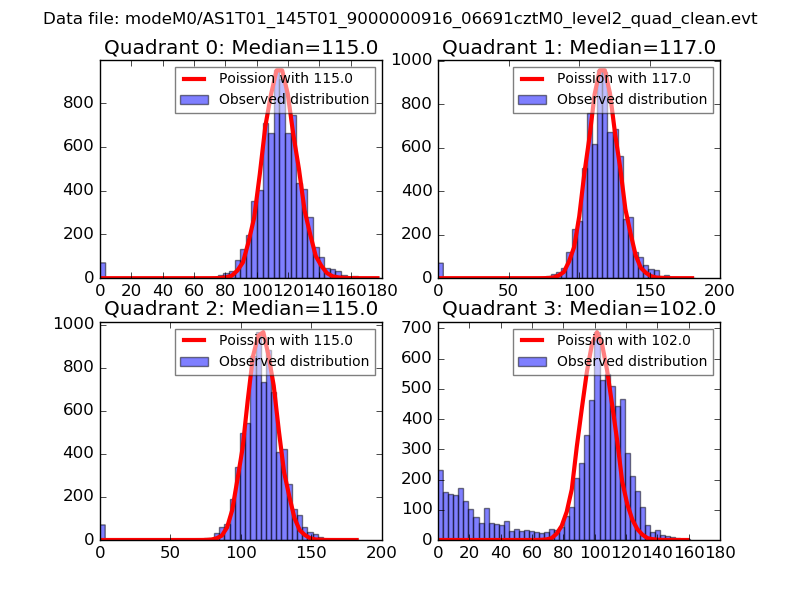
| Comparison with Poisson distribution Blue bars denote a histogram of data divided into 1 sec bins. Red curve is a Poisson curve with rate = median count rate of data. |
 |
 |
| Quadrant-wise count rates Data is divided into 100 sec bins |
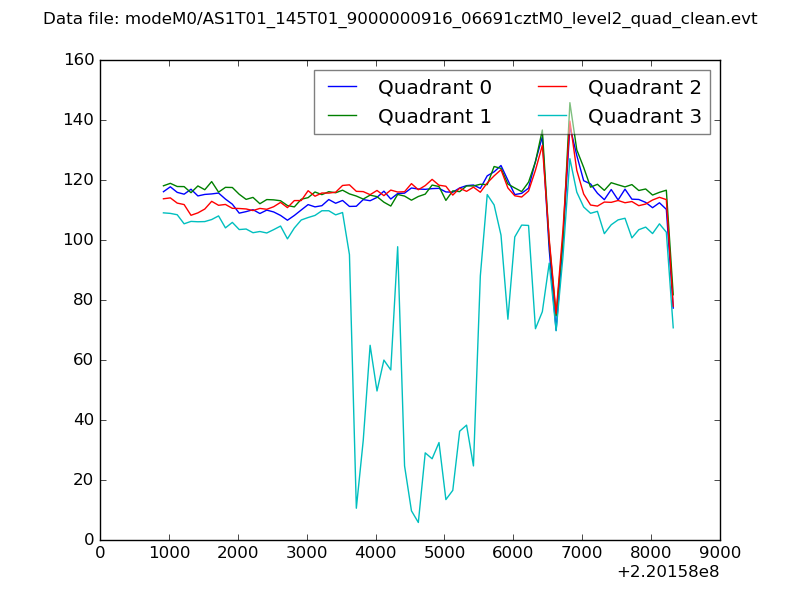 |
|
| Module-wise count rates for Quadrant A Data is divided into 100 sec bins |
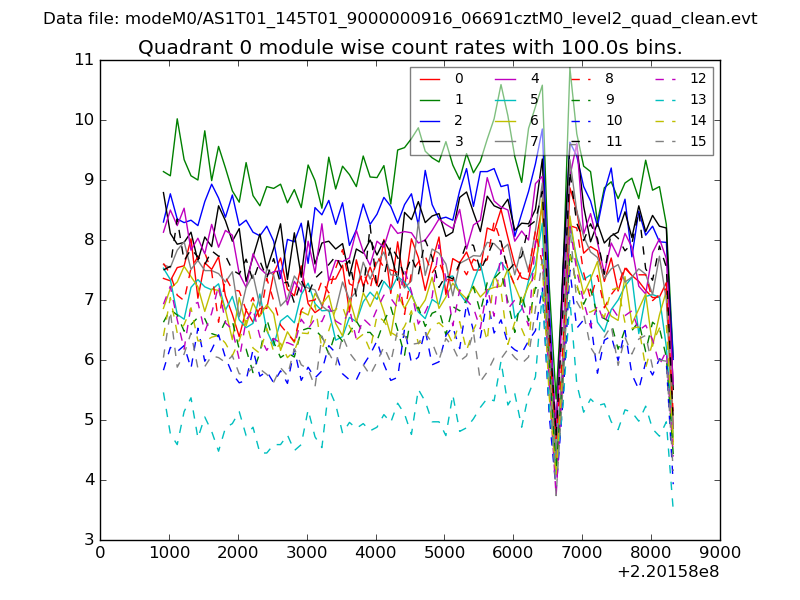 |
 |
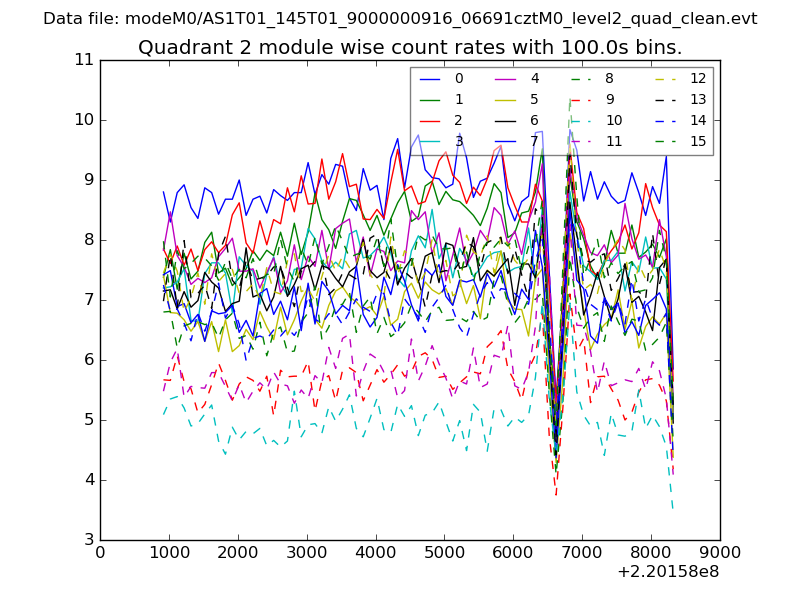
| Module-wise count rates for Quadrant B Data is divided into 100 sec bins |
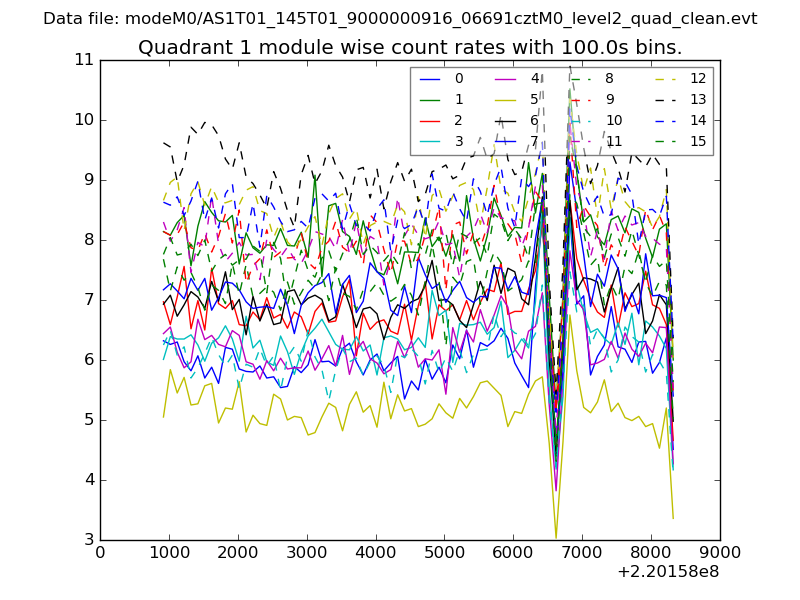 |
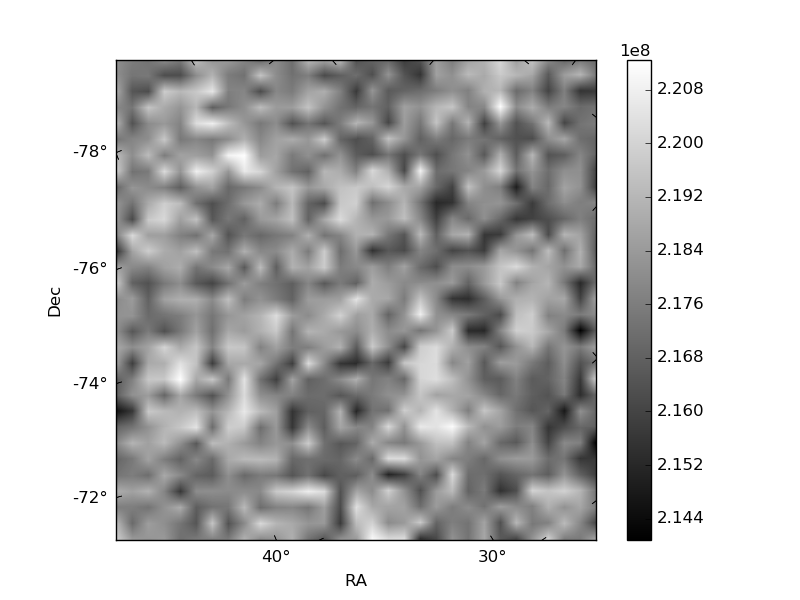 |
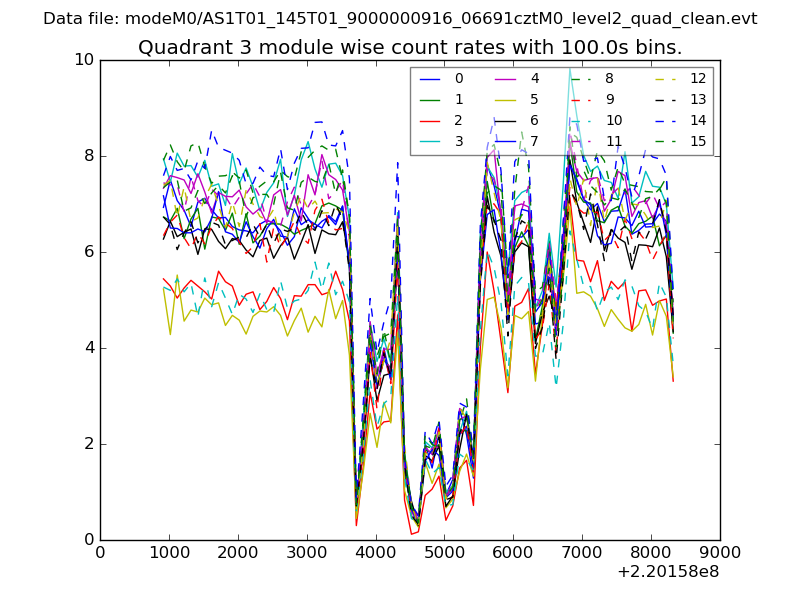
| Module-wise count rates for Quadrant C Data is divided into 100 sec bins |
 |
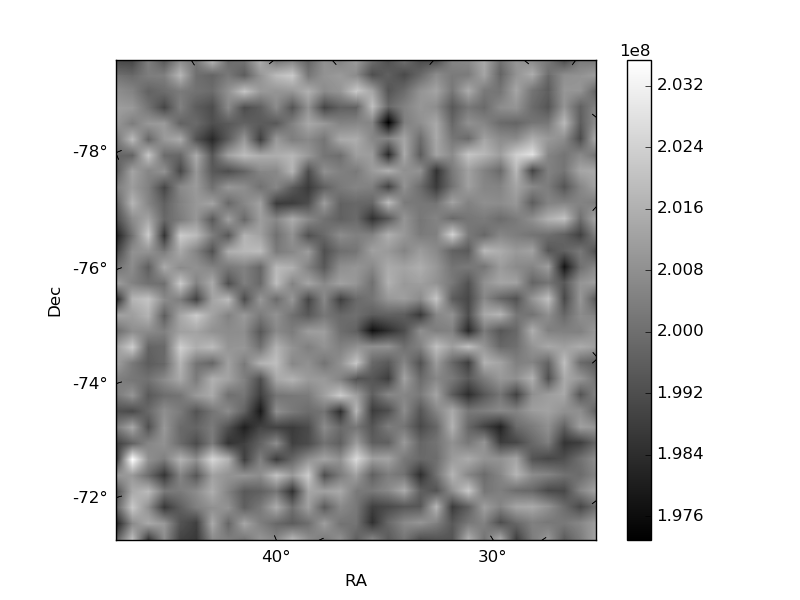 |
| Module-wise count rates for Quadrant D Data is divided into 100 sec bins |
 |
 |
| Parameter | Plot |
|---|---|
| CZT HV Monitor | 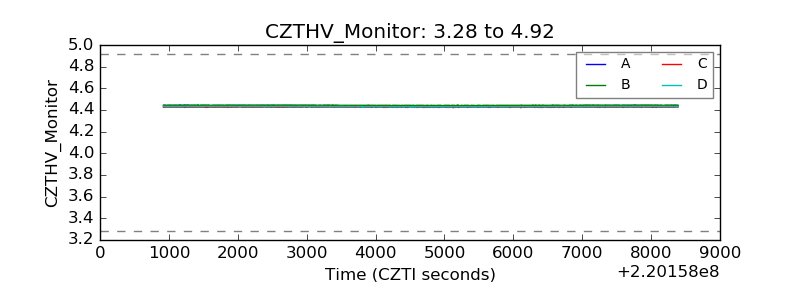 |
| D_VDD | 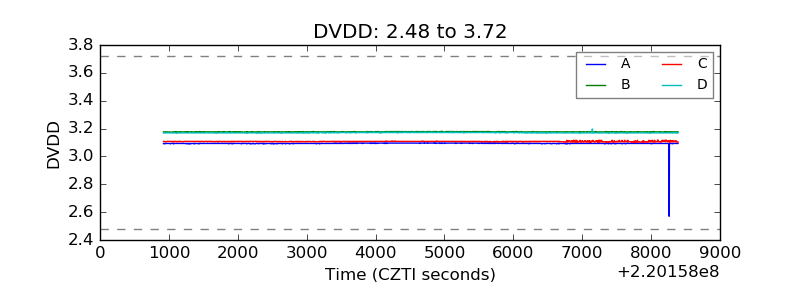 |
| Temperature 1 | 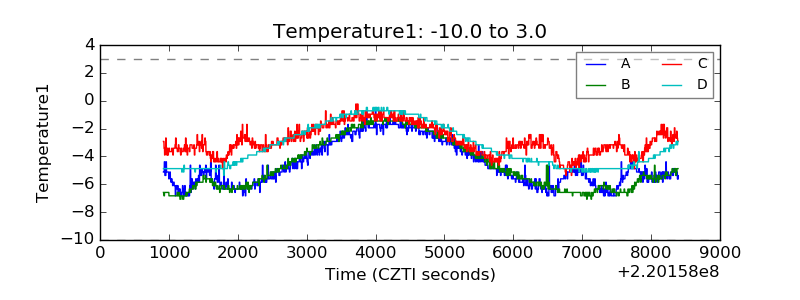 |
| Veto HV Monitor | 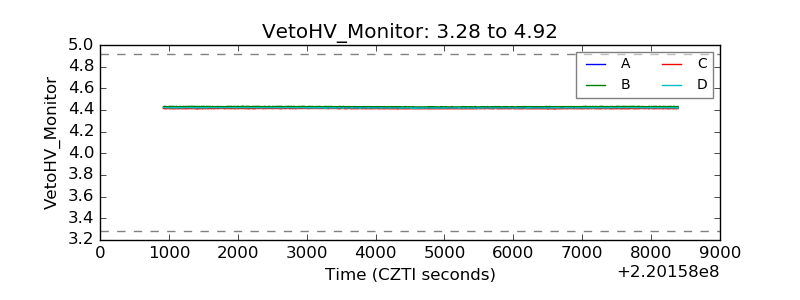 |
| Veto LLD | 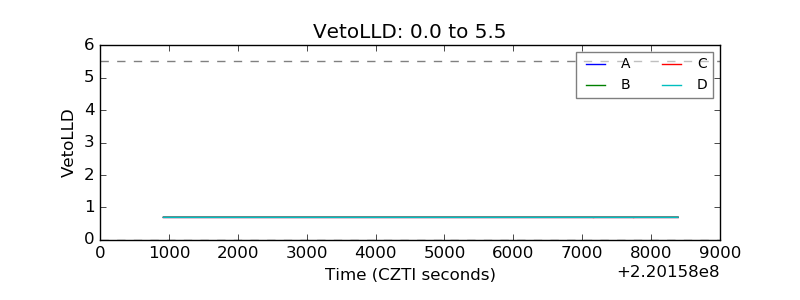 |
| Alpha Counter | 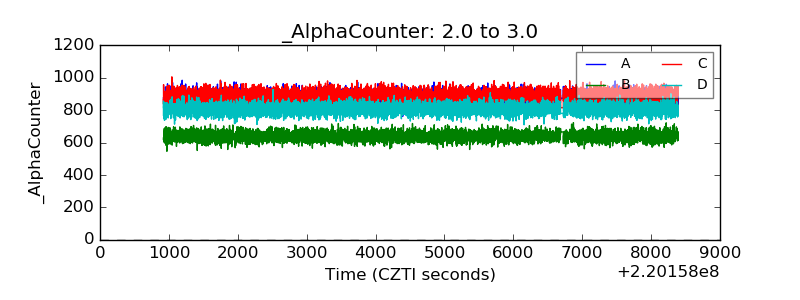 |
| _CPM_Rate | 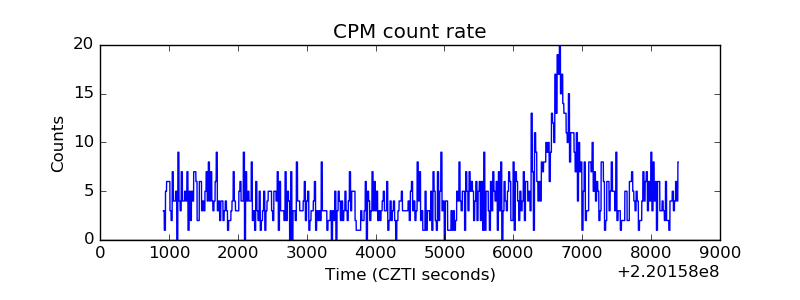 |
| CZT Counter | 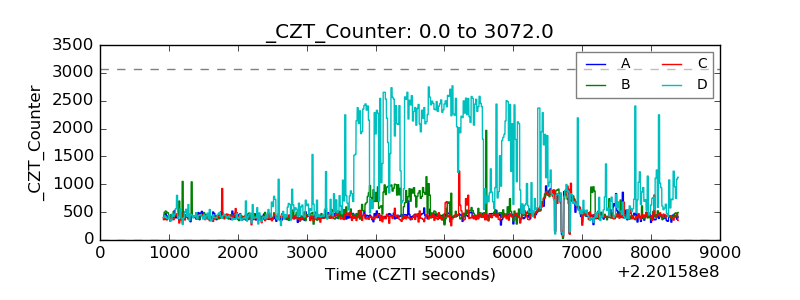 |
| +2.5 Volts monitor |  |
| +5 Volts monitor |  |
| _ROLL_ROT | 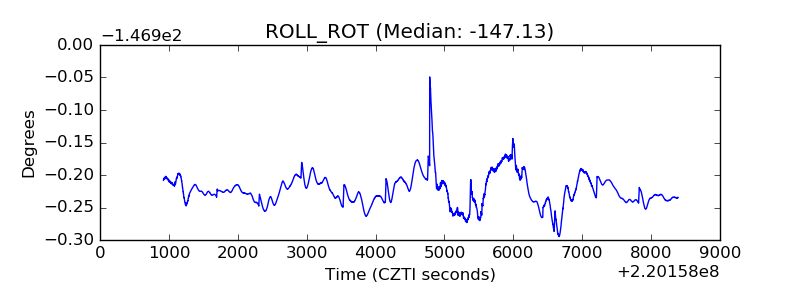 |
| _Roll_DEC | 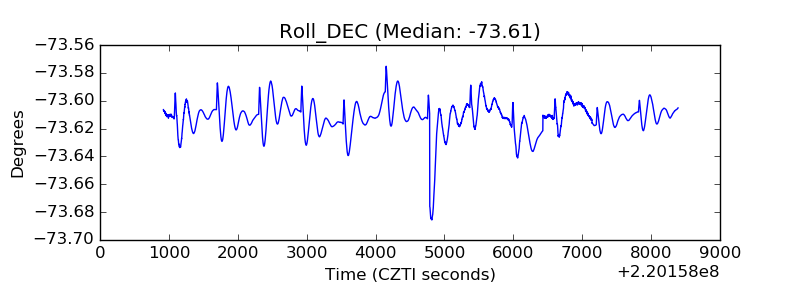 |
| _Roll_RA | 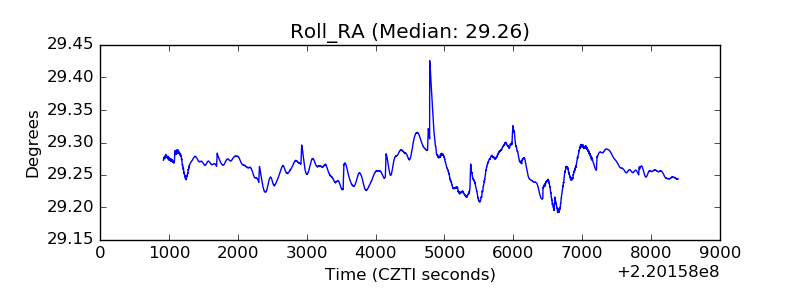 |
| Veto Counter | 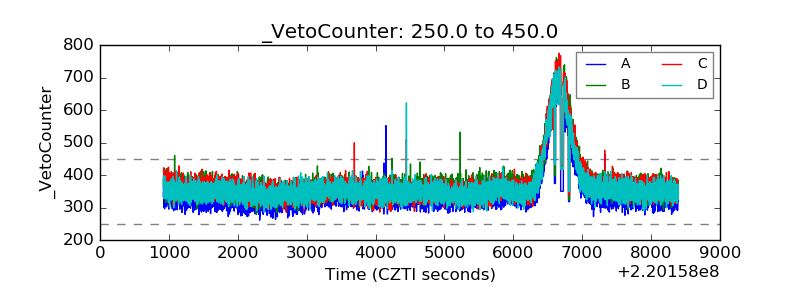 |