| Param | Original file | Final file |
|---|---|---|
| Filename | modeM0/AS1T01_145T01_9000000916_06692cztM0_level2.evt | modeM0/AS1T01_145T01_9000000916_06692cztM0_level2_quad_clean.evt |
| Size (bytes) | 577,123,200 | 123,742,080 |
| Size | 550.4 MB | 118.0 MB |
| Events in quadrant A | 3,343,763 | 831,225 |
| Events in quadrant B | 3,464,935 | 850,992 |
| Events in quadrant C | 3,205,520 | 836,572 |
| Events in quadrant D | 6,971,141 | 722,902 |
| Mode M0 | |||
|---|---|---|---|
| Quadrant | BADHDUFLAG | Total packets | Discarded packets |
| A | 0 | 15153 | 3 |
| B | 0 | 15312 | 2 |
| C | 0 | 14933 | 2 |
| D | 0 | 25743 | 2 |
| Mode M9 | |||
|---|---|---|---|
| Quadrant | BADHDUFLAG | Total packets | Discarded packets |
| A | 0 | 2 | 0 |
| B | 0 | 2 | 0 |
| C | 0 | 2 | 0 |
| D | 0 | 2 | 0 |
| Mode SS | |||
|---|---|---|---|
| Quadrant | BADHDUFLAG | Total packets | Discarded packets |
| A | 0 | 148 | 0 |
| B | 0 | 148 | 0 |
| C | 0 | 148 | 0 |
| D | 0 | 148 | 0 |
| Quadrant | Total seconds | Saturated seconds | Saturation percentage |
|---|---|---|---|
| A | 7265 | 257 | 3.537509% |
| B | 7265 | 271 | 3.730213% |
| C | 7265 | 226 | 3.110805% |
| D | 7265 | 1156 | 15.911906% |
Noise dominated data is calculated using 1-second bins in cleaned event files. If a bin has >2000 counts, and if more than 50% of those come from <1% of pixels, then it is considered to be noise-dominated and hence unusable.
| Quadrant | # 1 sec bins | Bins with >0 counts | Bins with >2000 counts | High rate bins dominated by noise | Noise dominated (total time) | Noise dominated (detector-on time) | Marked lightcurve |
|---|---|---|---|---|---|---|---|
| A | 7390 | 7267 | 5 | 5 | 0.07% | 0.07% | 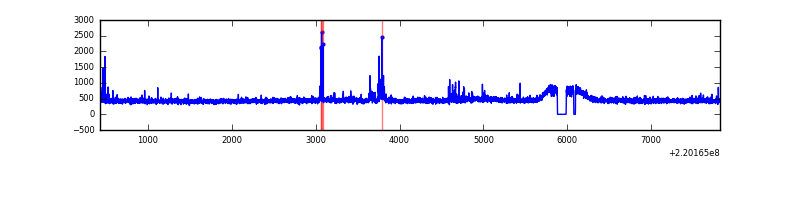 |
| B | 7390 | 7267 | 14 | 14 | 0.19% | 0.19% | 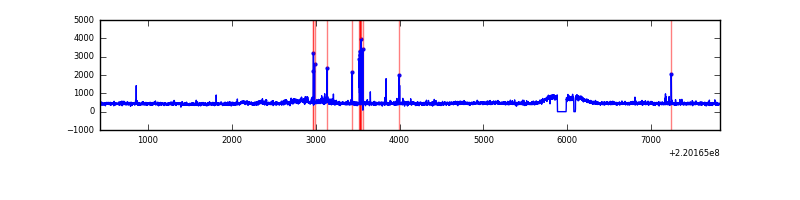 |
| C | 7390 | 7267 | 0 | 0 | 0.00% | 0.00% |  |
| D | 7390 | 7267 | 791 | 791 | 10.70% | 10.88% | 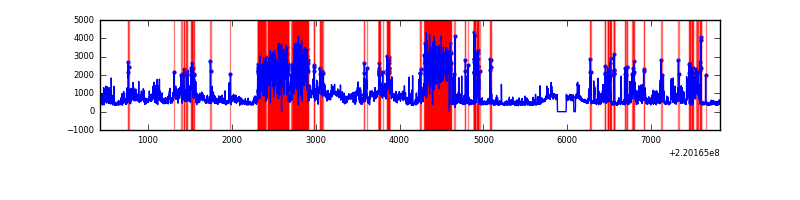 |
Top three noisy pixels from each quadrant. If the there are fewer than three noisy pixels in the level2.evt file, extra rows are filled as -1
| Pixel properties | Quadrant properties | ||||||
|---|---|---|---|---|---|---|---|
| Quadrant | DetID | PixID | Counts | Sigma | Mean | Median | Sigma |
| A | 8 | 15 | 65267 | 381.44 | 824 | 804 | 169.0 |
| A | 14 | 111 | 60836 | 355.22 | 824 | 804 | 169.0 |
| A | 4 | 2 | 14814 | 82.9 | 824 | 804 | 169.0 |
| B | 4 | 48 | 60628 | 372.4 | 834 | 811 | 160.6 |
| B | 0 | 198 | 57956 | 355.77 | 834 | 811 | 160.6 |
| B | 15 | 204 | 35848 | 218.13 | 834 | 811 | 160.6 |
| C | 8 | 128 | 14195 | 71.03 | 813 | 815 | 188.4 |
| C | 8 | 112 | 8092 | 38.63 | 813 | 815 | 188.4 |
| C | 13 | 61 | 6423 | 29.77 | 813 | 815 | 188.4 |
| D | 2 | 33 | 2610282 | 14141.82 | 753 | 727 | 184.5 |
| D | 8 | 195 | 892415 | 4832.28 | 753 | 727 | 184.5 |
| D | 2 | 152 | 314715 | 1701.58 | 753 | 727 | 184.5 |
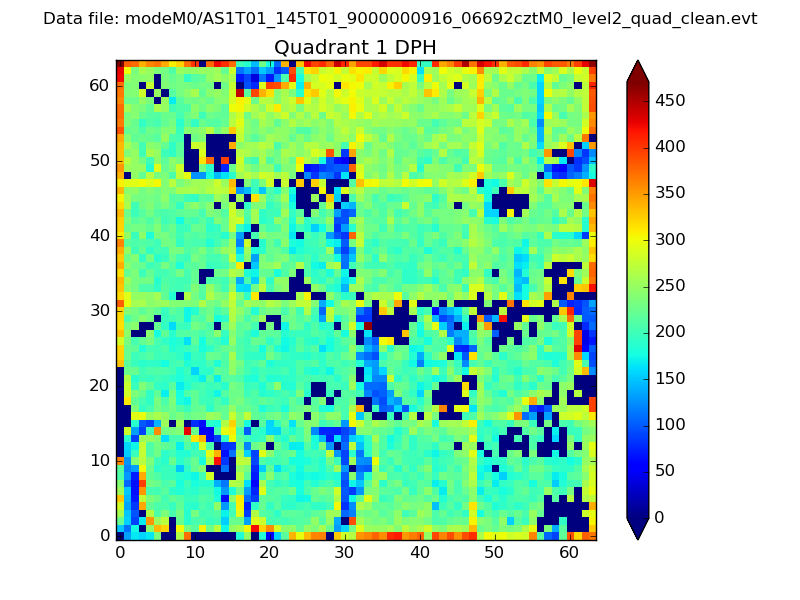
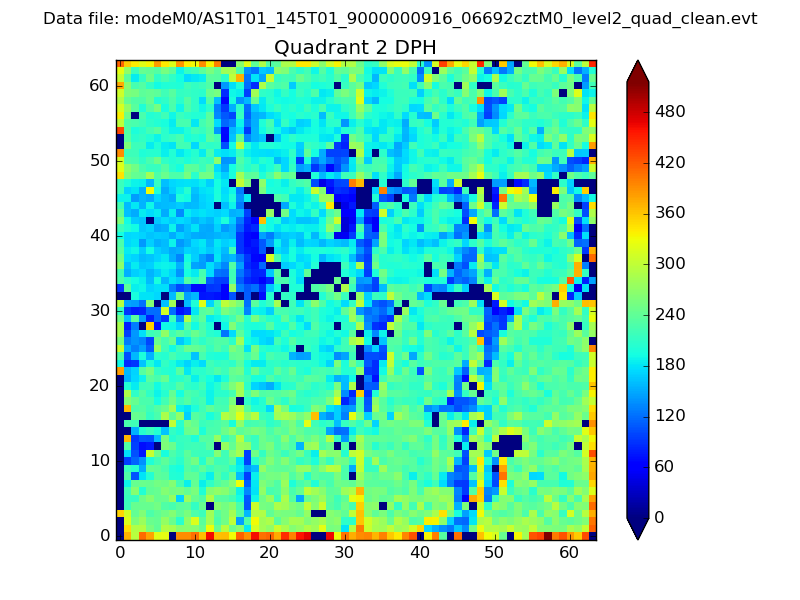
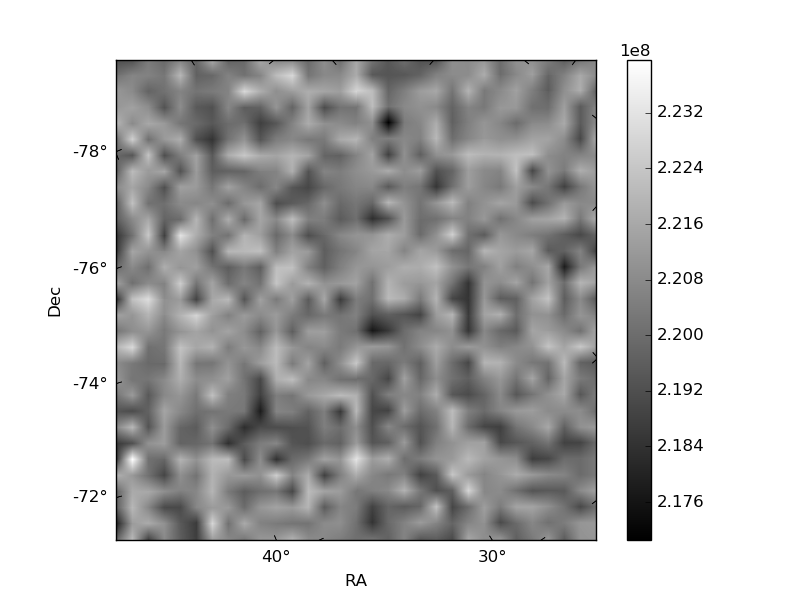
Histogram calculated using DETX and DETY for each event in the final _common_clean file
| Quadrant A | 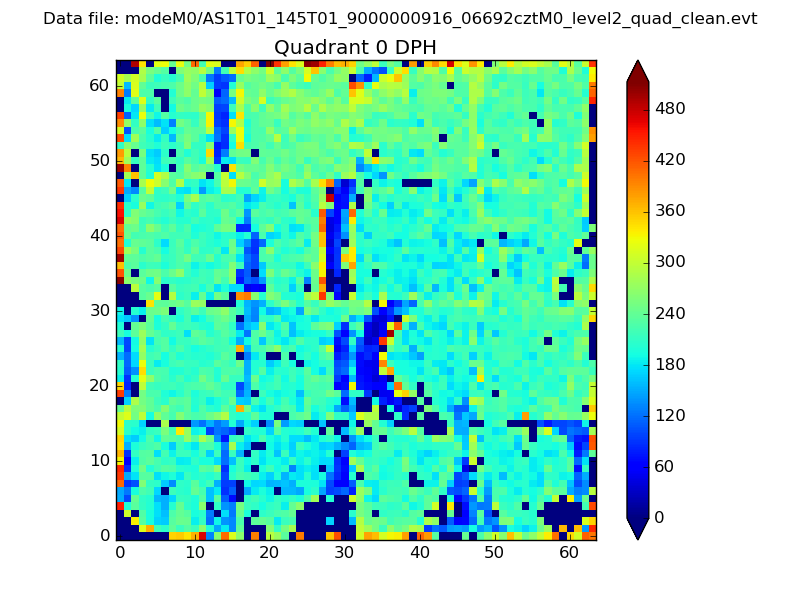 |
 |
Quadrant B |
|---|---|---|---|
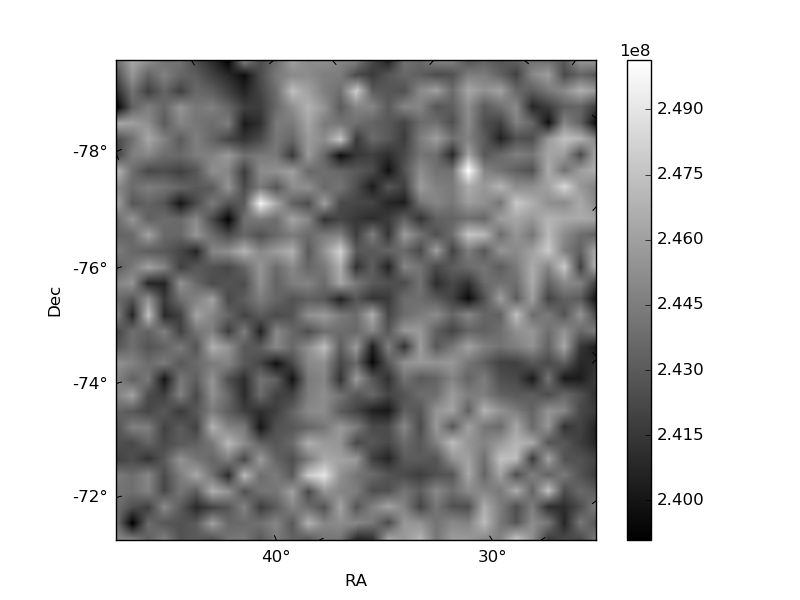
| Quadrant D | 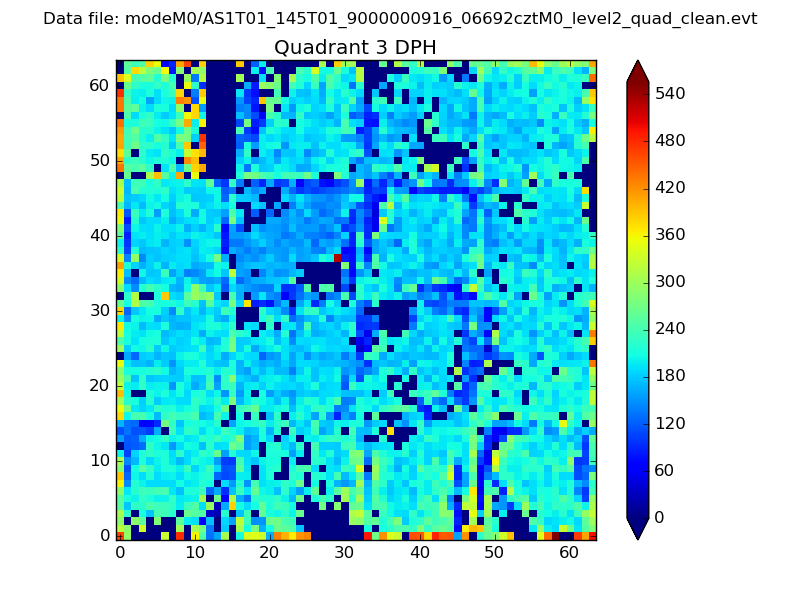 |
 |
Quadrant C |
| Plot type | Count rate plots | Images |
|---|---|---|
| Comparison with Poisson distribution Blue bars denote a histogram of data divided into 1 sec bins. Red curve is a Poisson curve with rate = median count rate of data. |
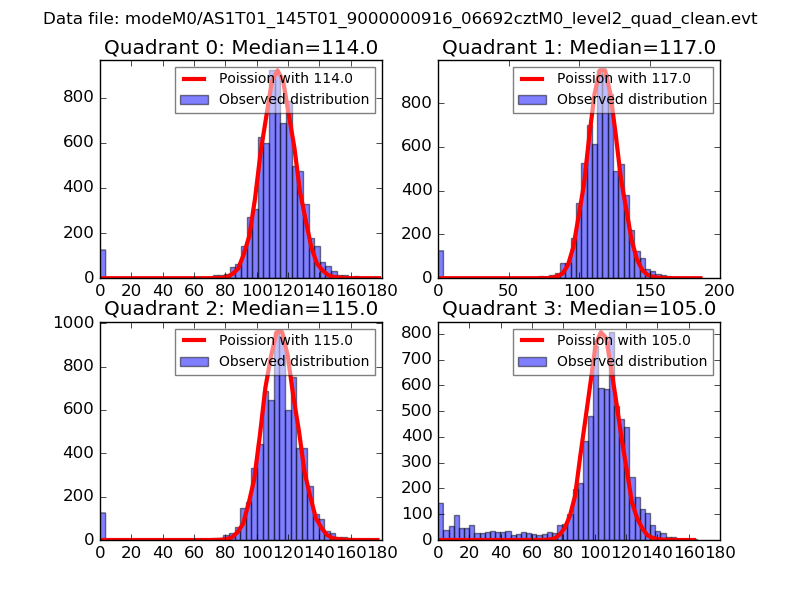 |
 |
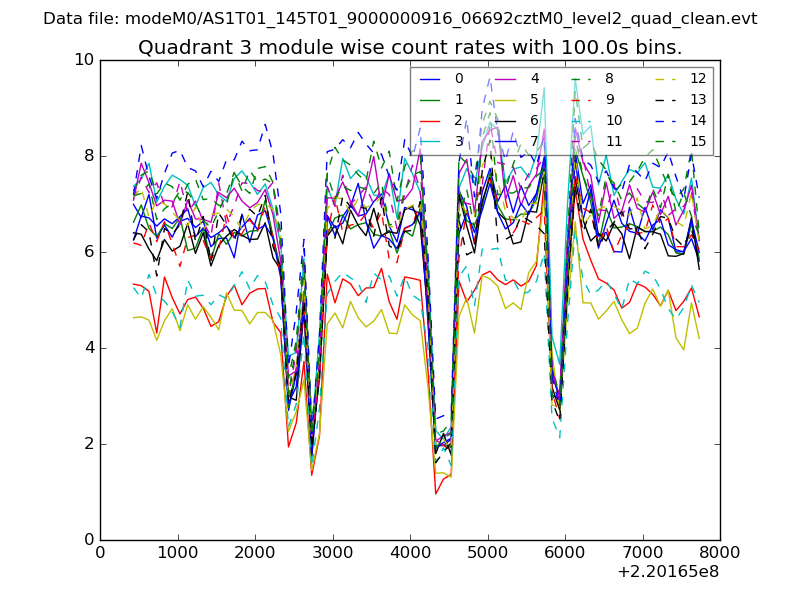
| Quadrant-wise count rates Data is divided into 100 sec bins |
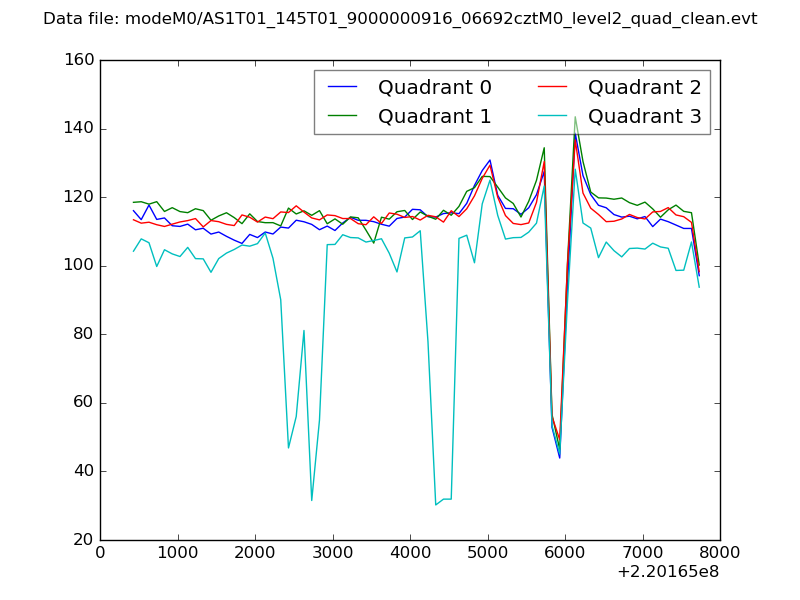 |
|
| Module-wise count rates for Quadrant A Data is divided into 100 sec bins |
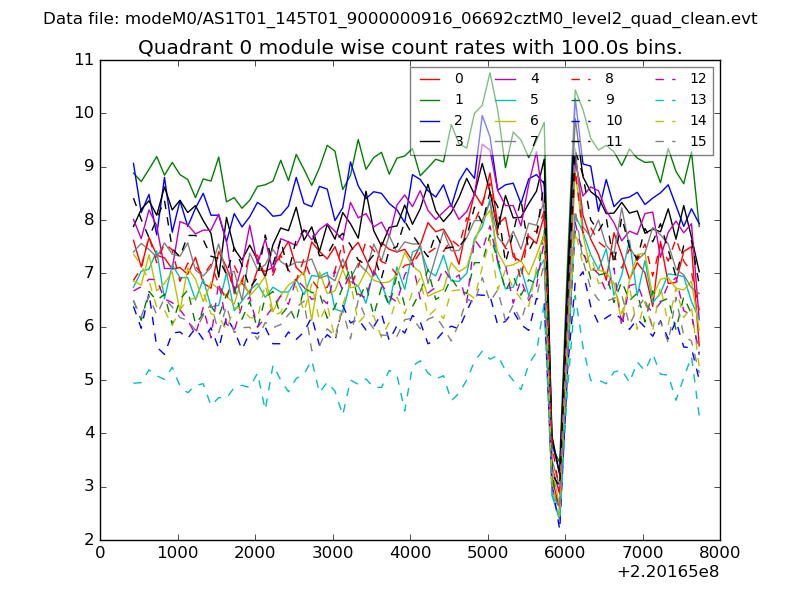 |
 |
| Module-wise count rates for Quadrant B Data is divided into 100 sec bins |
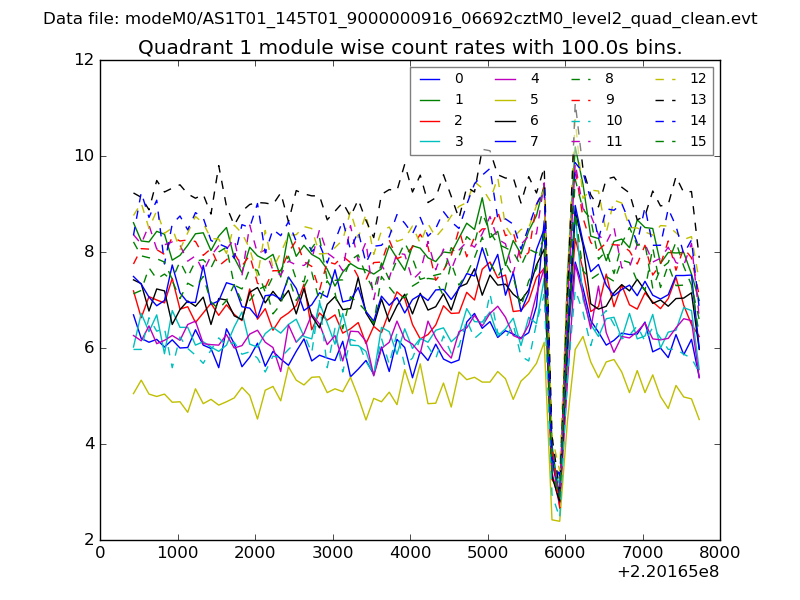 |
 |
| Module-wise count rates for Quadrant C Data is divided into 100 sec bins |
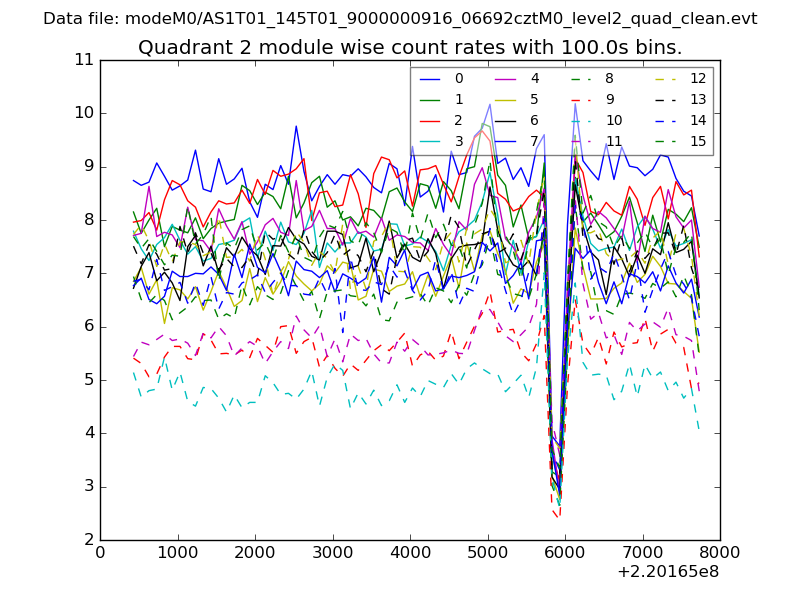 |
 |
| Module-wise count rates for Quadrant D Data is divided into 100 sec bins |
 |
 |
| Parameter | Plot |
|---|---|
| CZT HV Monitor | 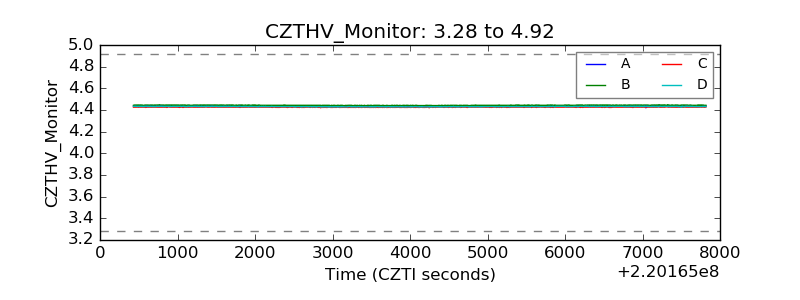 |
| D_VDD | 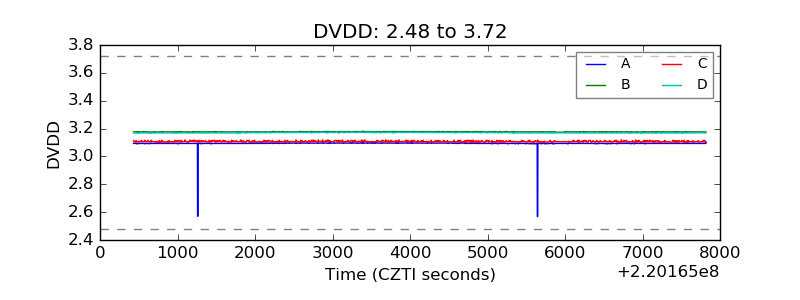 |
| Temperature 1 | 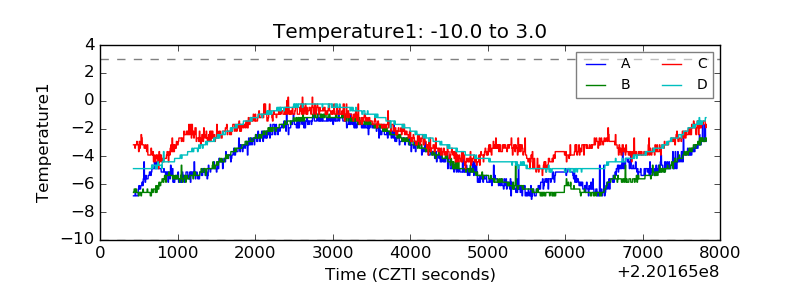 |
| Veto HV Monitor | 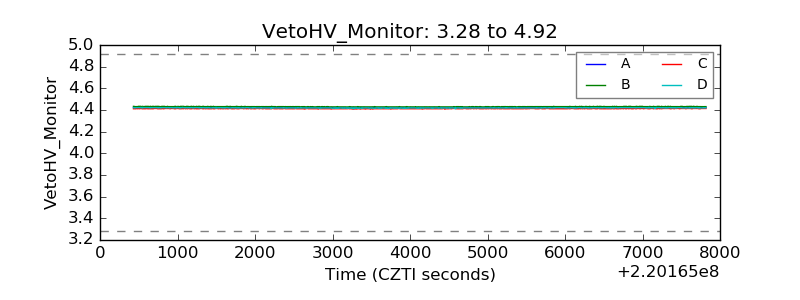 |
| Veto LLD | 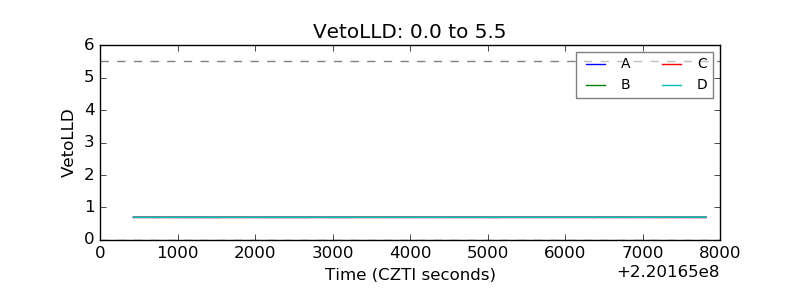 |
| Alpha Counter | 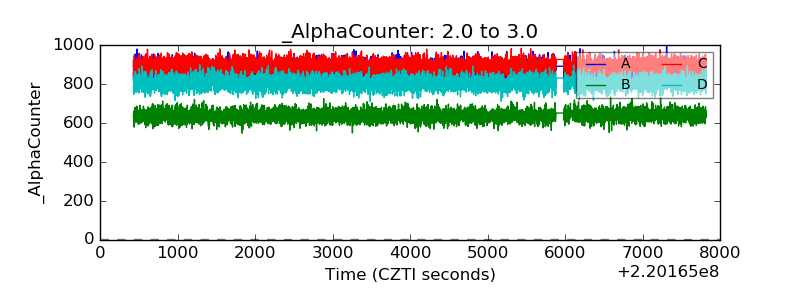 |
| _CPM_Rate | 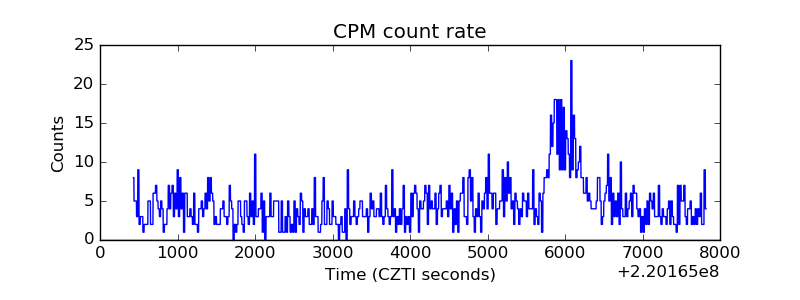 |
| CZT Counter | 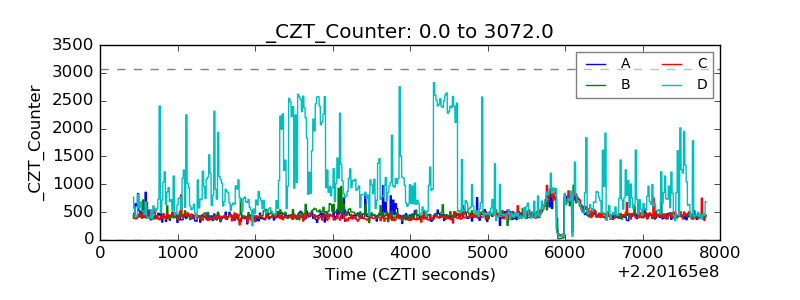 |
| +2.5 Volts monitor | 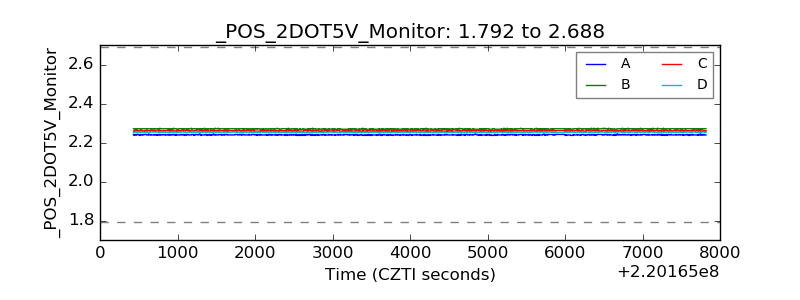 |
| +5 Volts monitor |  |
| _ROLL_ROT | 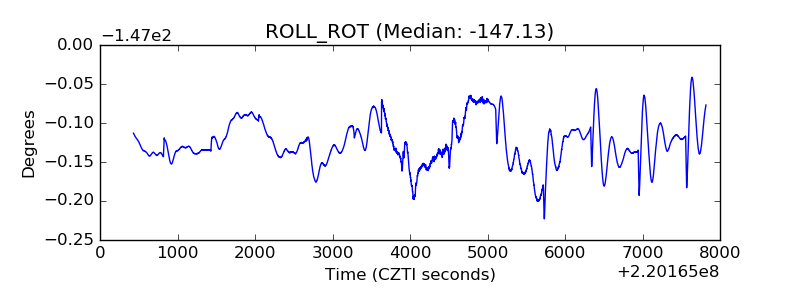 |
| _Roll_DEC | 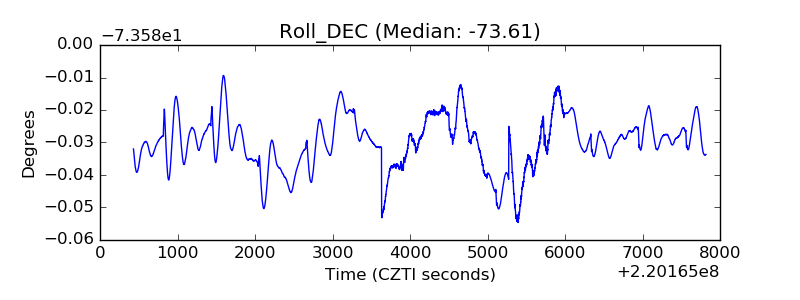 |
| _Roll_RA | 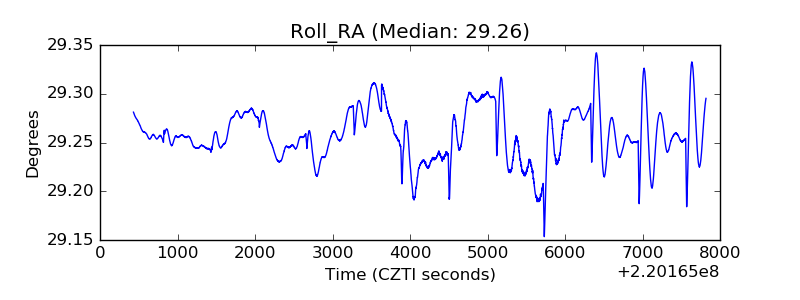 |
| Veto Counter | 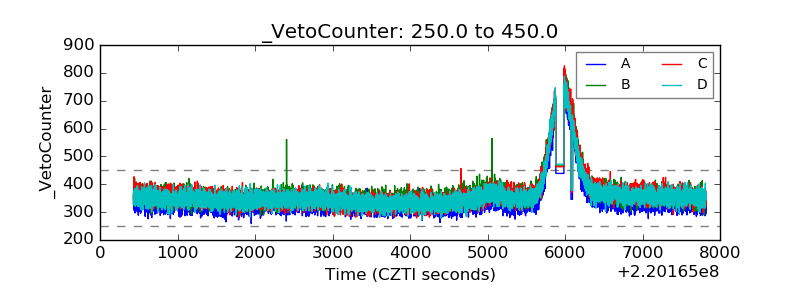 |