| Param | Original file | Final file |
|---|---|---|
| Filename | modeM0/AS1T01_145T01_9000000916_06696cztM0_level2.evt | modeM0/AS1T01_145T01_9000000916_06696cztM0_level2_quad_clean.evt |
| Size (bytes) | 920,105,280 | 219,646,080 |
| Size | 877.5 MB | 209.5 MB |
| Events in quadrant A | 5,902,611 | 1,465,932 |
| Events in quadrant B | 6,016,897 | 1,490,788 |
| Events in quadrant C | 5,489,939 | 1,478,525 |
| Events in quadrant D | 9,592,375 | 1,335,808 |
| Mode M0 | |||
|---|---|---|---|
| Quadrant | BADHDUFLAG | Total packets | Discarded packets |
| A | 0 | 26529 | 3 |
| B | 0 | 26304 | 2 |
| C | 0 | 25815 | 2 |
| D | 0 | 37248 | 2 |
| Mode M9 | |||
|---|---|---|---|
| Quadrant | BADHDUFLAG | Total packets | Discarded packets |
| A | 0 | 10 | 0 |
| B | 0 | 10 | 0 |
| C | 0 | 10 | 0 |
| D | 0 | 10 | 0 |
| Mode SS | |||
|---|---|---|---|
| Quadrant | BADHDUFLAG | Total packets | Discarded packets |
| A | 0 | 260 | 0 |
| B | 0 | 260 | 0 |
| C | 0 | 260 | 0 |
| D | 0 | 260 | 0 |
| Quadrant | Total seconds | Saturated seconds | Saturation percentage |
|---|---|---|---|
| A | 12750 | 180 | 1.411765% |
| B | 12750 | 141 | 1.105882% |
| C | 12750 | 106 | 0.831373% |
| D | 12750 | 1323 | 10.376471% |
Noise dominated data is calculated using 1-second bins in cleaned event files. If a bin has >2000 counts, and if more than 50% of those come from <1% of pixels, then it is considered to be noise-dominated and hence unusable.
| Quadrant | # 1 sec bins | Bins with >0 counts | Bins with >2000 counts | High rate bins dominated by noise | Noise dominated (total time) | Noise dominated (detector-on time) | Marked lightcurve |
|---|---|---|---|---|---|---|---|
| A | 13785 | 12752 | 37 | 37 | 0.27% | 0.29% | 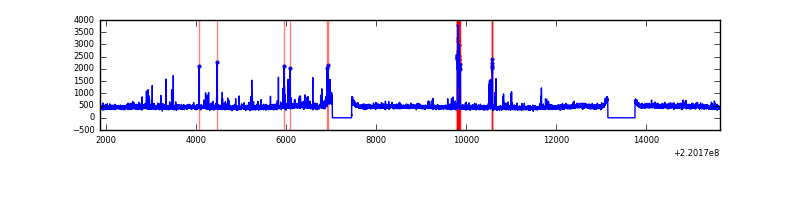 |
| B | 13785 | 12752 | 1 | 1 | 0.01% | 0.01% | 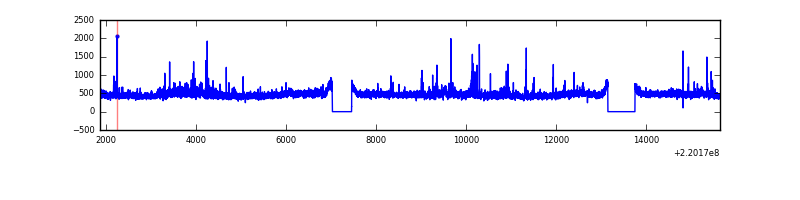 |
| C | 13785 | 12752 | 0 | 0 | 0.00% | 0.00% | 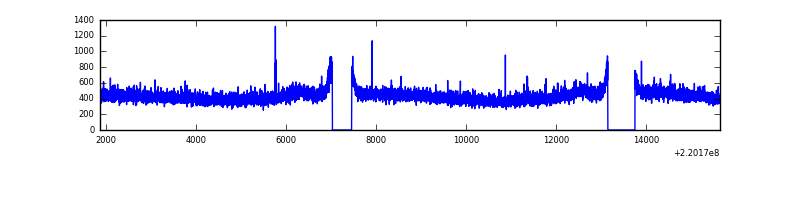 |
| D | 13785 | 12752 | 974 | 974 | 7.07% | 7.64% |  |
Top three noisy pixels from each quadrant. If the there are fewer than three noisy pixels in the level2.evt file, extra rows are filled as -1
| Pixel properties | Quadrant properties | ||||||
|---|---|---|---|---|---|---|---|
| Quadrant | DetID | PixID | Counts | Sigma | Mean | Median | Sigma |
| A | 14 | 111 | 169757 | 578.33 | 1432 | 1396 | 291.1 |
| A | 8 | 15 | 152341 | 518.5 | 1432 | 1396 | 291.1 |
| A | 13 | 251 | 24705 | 80.07 | 1432 | 1396 | 291.1 |
| B | 0 | 214 | 150385 | 540.53 | 1447 | 1411 | 275.6 |
| B | 15 | 204 | 70604 | 251.06 | 1447 | 1411 | 275.6 |
| B | 0 | 228 | 39964 | 139.88 | 1447 | 1411 | 275.6 |
| C | 9 | 54 | 15988 | 45.35 | 1396 | 1398 | 321.7 |
| C | 13 | 61 | 11226 | 30.55 | 1396 | 1398 | 321.7 |
| C | 8 | 128 | 9776 | 26.04 | 1396 | 1398 | 321.7 |
| D | 2 | 33 | 3543751 | 10835.98 | 1336 | 1294 | 326.9 |
| D | 2 | 152 | 470489 | 1435.22 | 1336 | 1294 | 326.9 |
| D | 8 | 195 | 194932 | 592.32 | 1336 | 1294 | 326.9 |
Histogram calculated using DETX and DETY for each event in the final _common_clean file
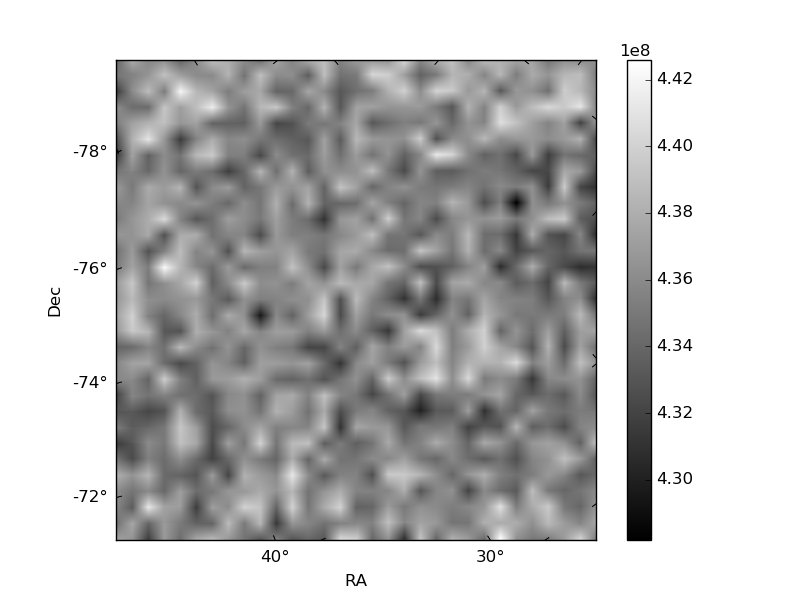
| Quadrant A |  |
 |
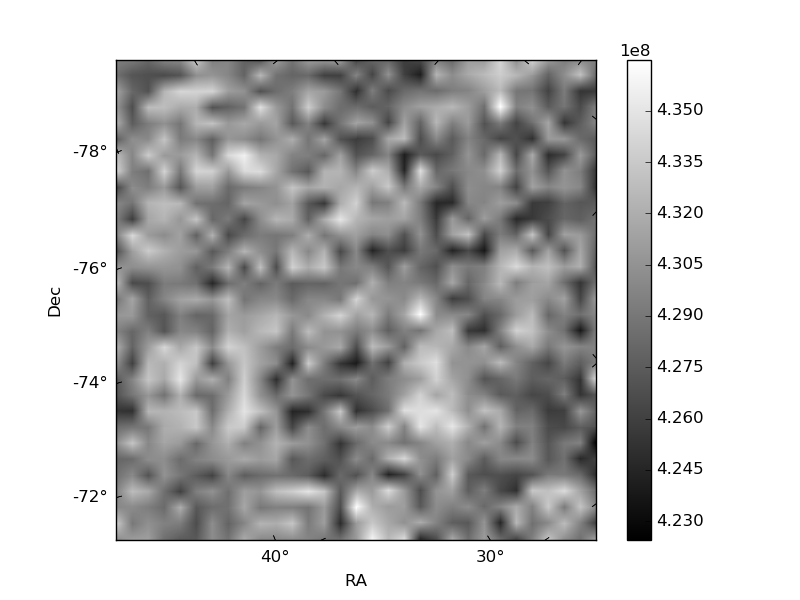
Quadrant B |
|---|---|---|---|
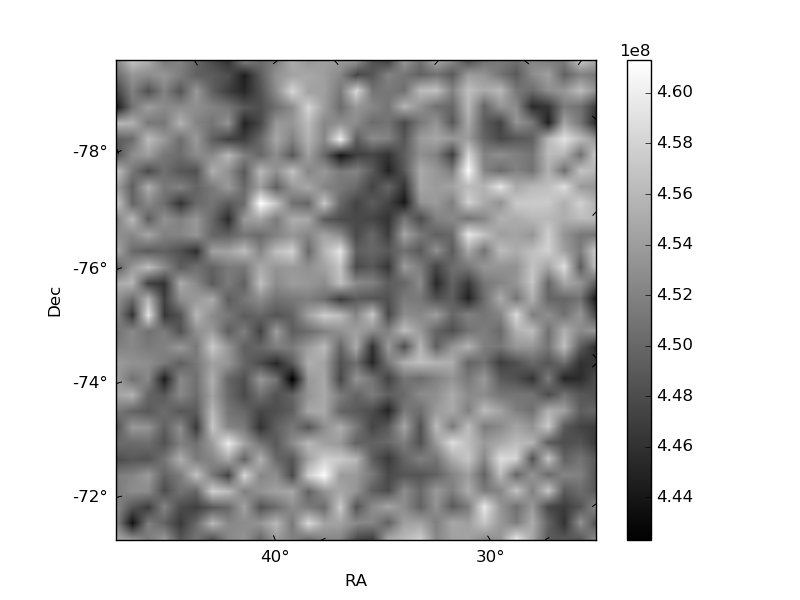
| Quadrant D | 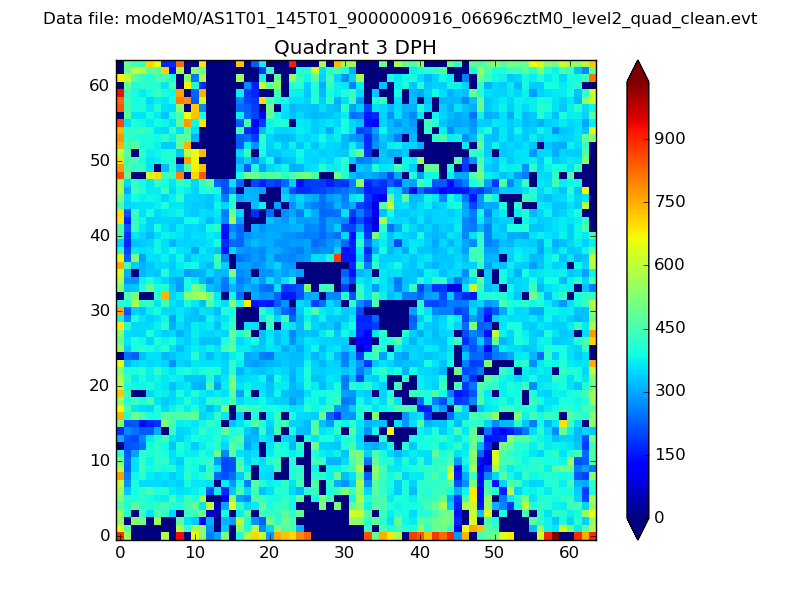 |
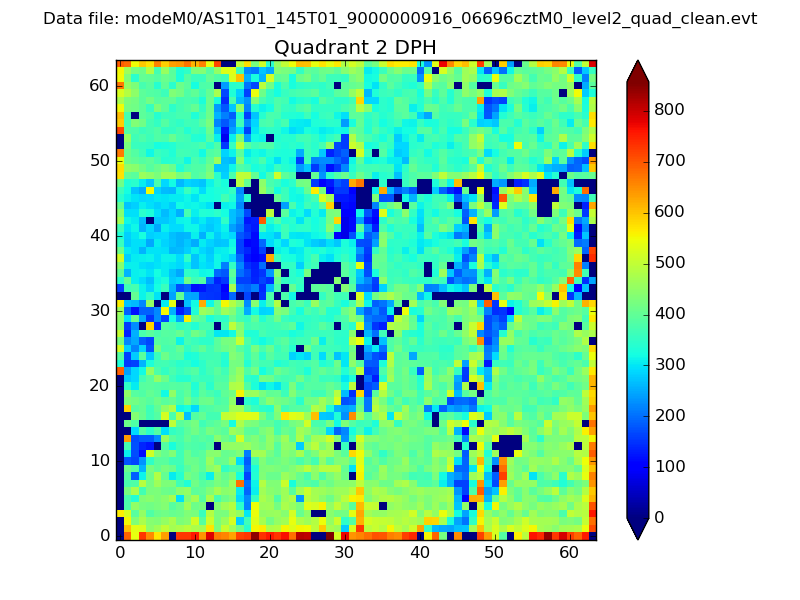 |
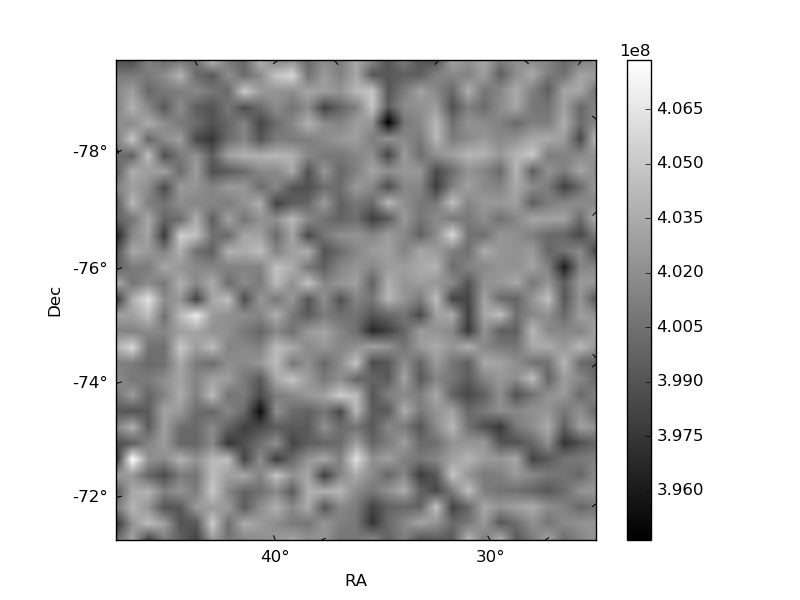
Quadrant C |
| Plot type | Count rate plots | Images |
|---|---|---|
| Comparison with Poisson distribution Blue bars denote a histogram of data divided into 1 sec bins. Red curve is a Poisson curve with rate = median count rate of data. |
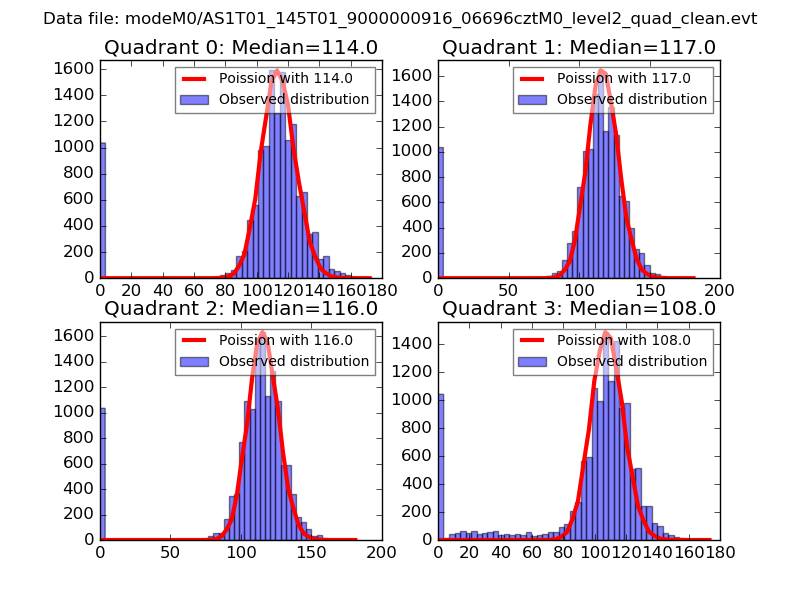 |
 |
| Quadrant-wise count rates Data is divided into 100 sec bins |
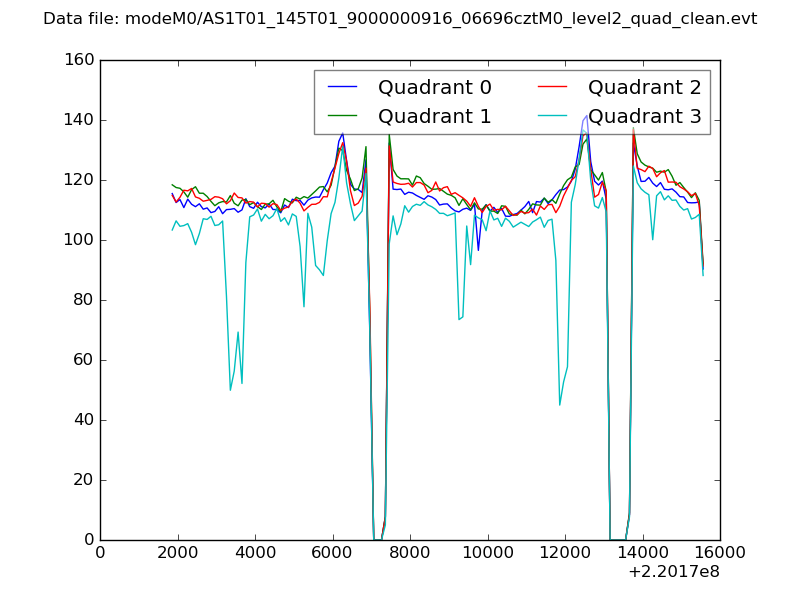 |
|
| Module-wise count rates for Quadrant A Data is divided into 100 sec bins |
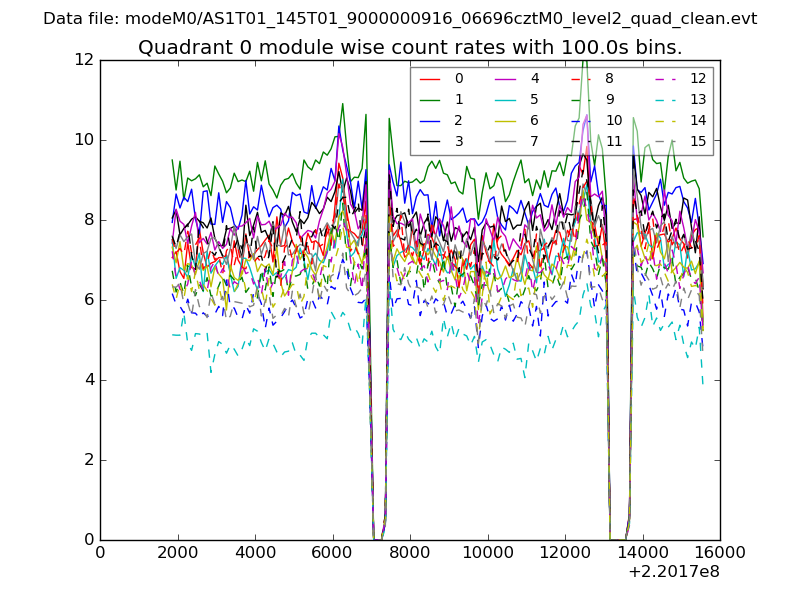 |
 |
| Module-wise count rates for Quadrant B Data is divided into 100 sec bins |
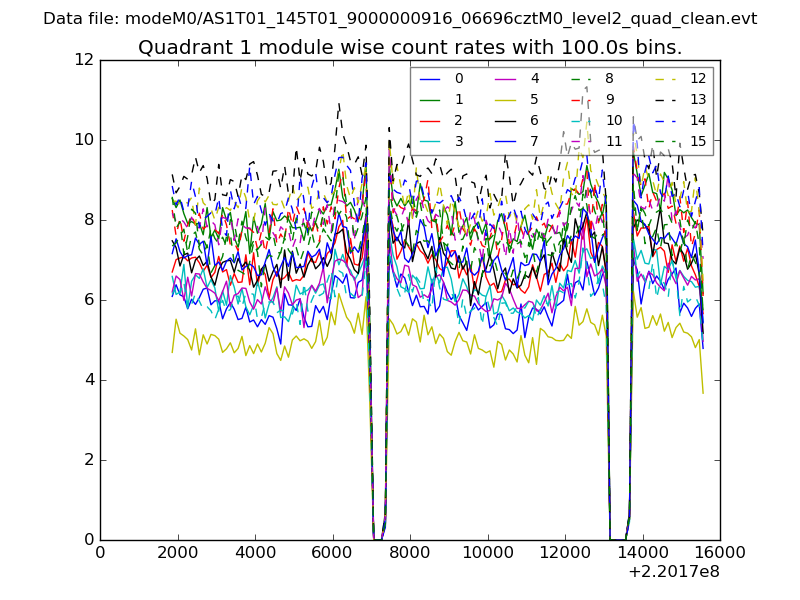 |
 |
| Module-wise count rates for Quadrant C Data is divided into 100 sec bins |
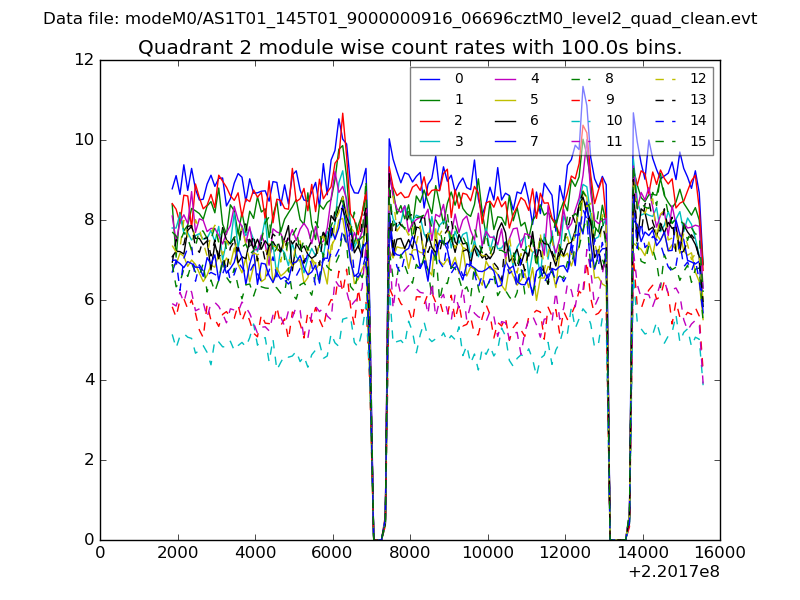 |
 |
| Module-wise count rates for Quadrant D Data is divided into 100 sec bins |
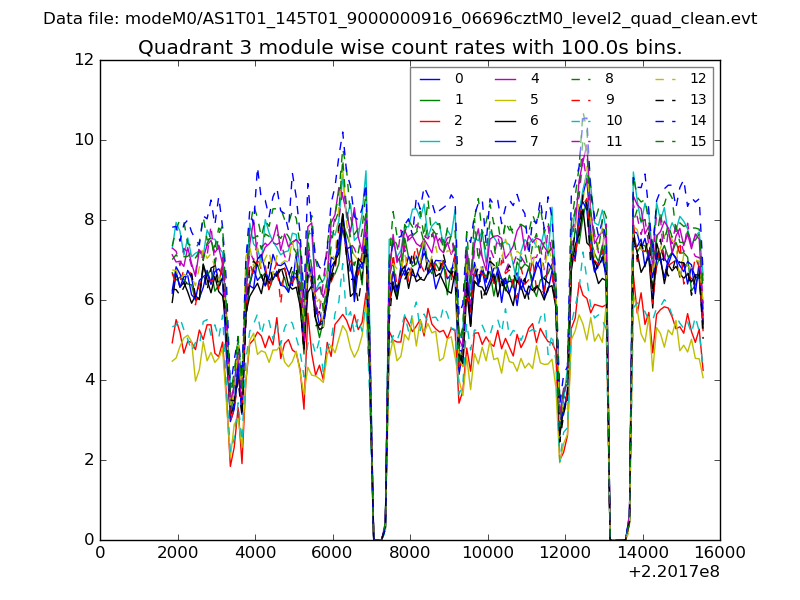 |
 |
| Parameter | Plot |
|---|---|
| CZT HV Monitor | 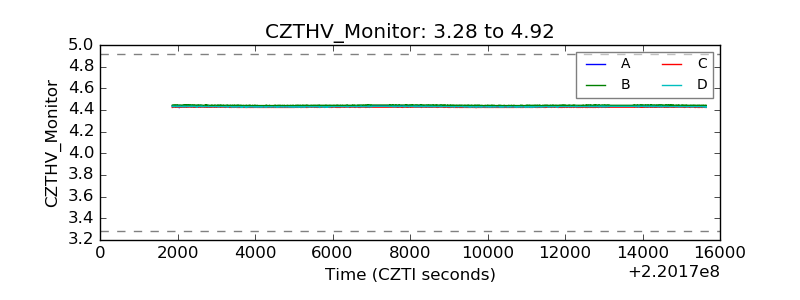 |
| D_VDD | 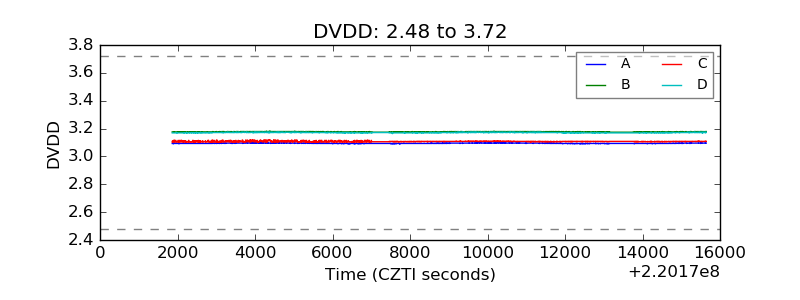 |
| Temperature 1 | 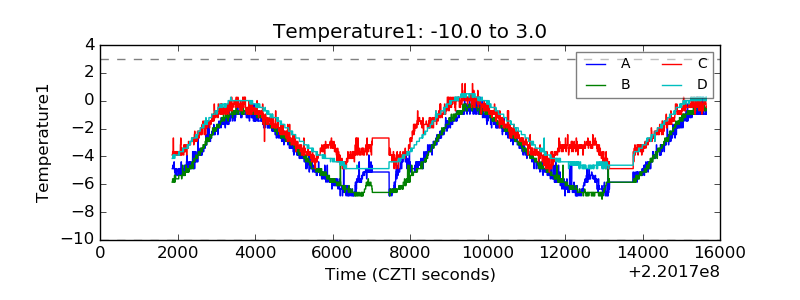 |
| Veto HV Monitor | 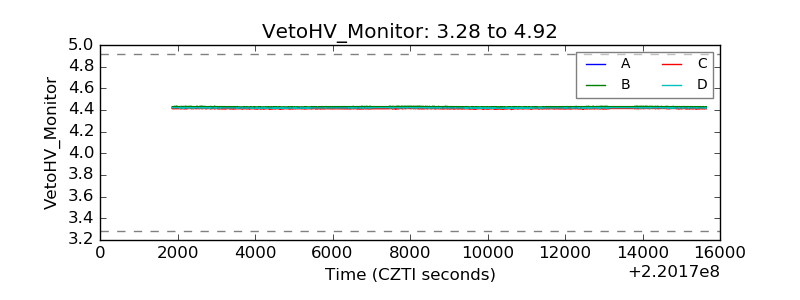 |
| Veto LLD | 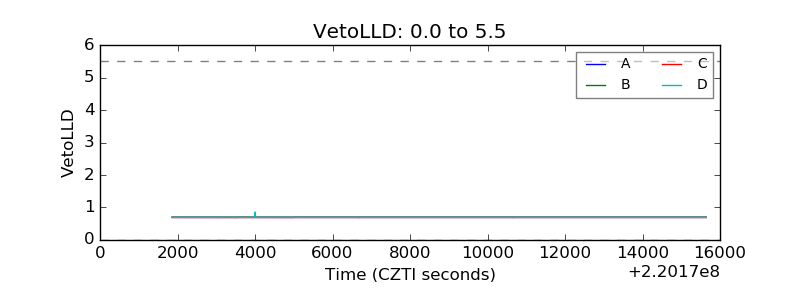 |
| Alpha Counter | 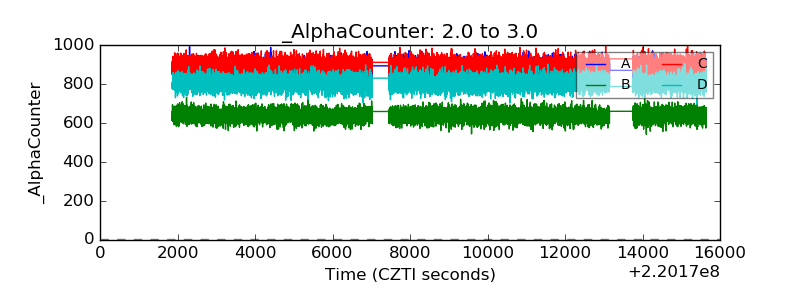 |
| _CPM_Rate | 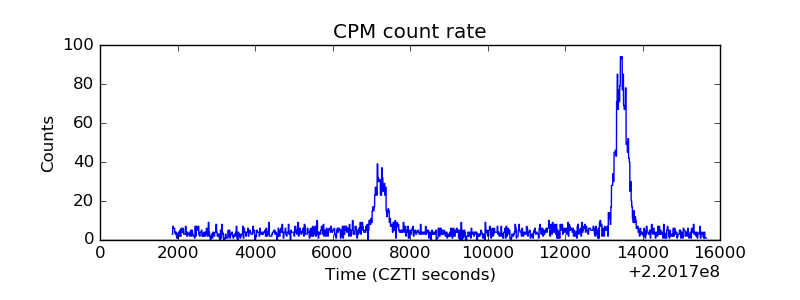 |
| CZT Counter | 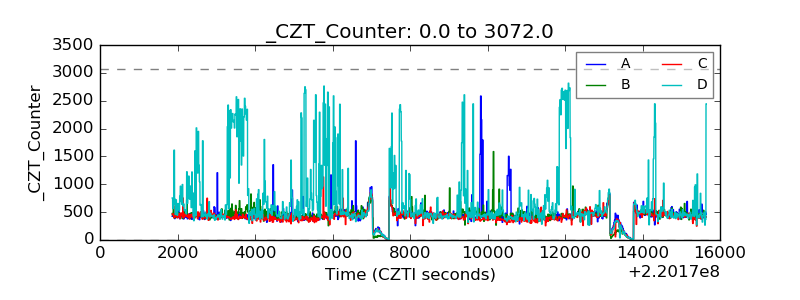 |
| +2.5 Volts monitor | 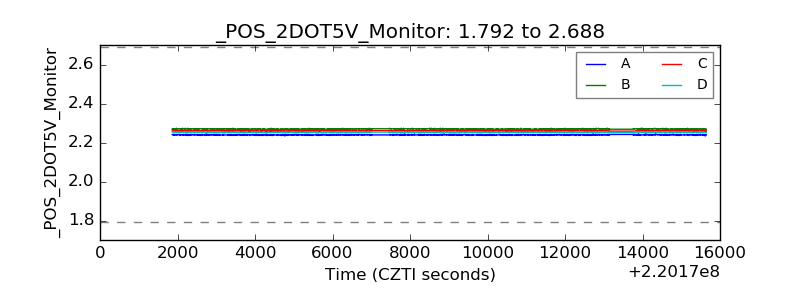 |
| +5 Volts monitor |  |
| _ROLL_ROT | 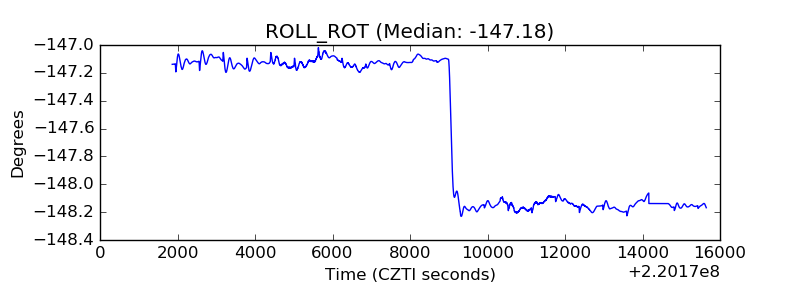 |
| _Roll_DEC | 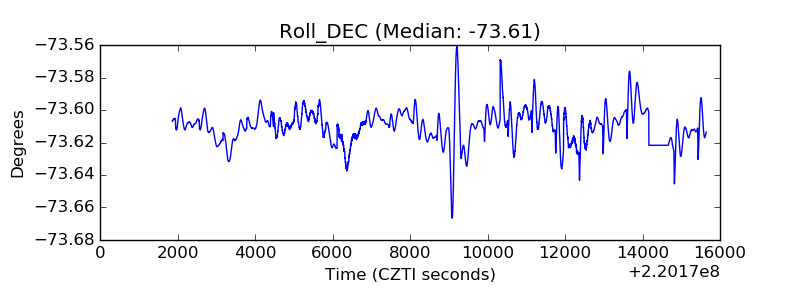 |
| _Roll_RA | 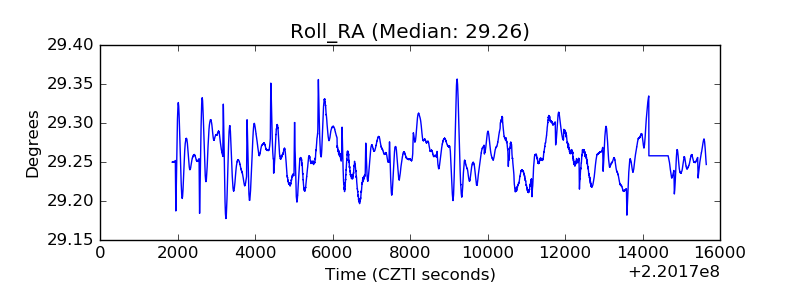 |
| Veto Counter | 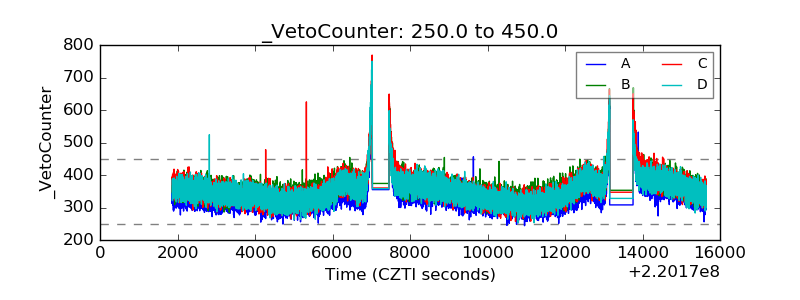 |