| Param | Original file | Final file |
|---|---|---|
| Filename | modeM0/AS1T01_145T01_9000000916_06698cztM0_level2.evt | modeM0/AS1T01_145T01_9000000916_06698cztM0_level2_quad_clean.evt |
| Size (bytes) | 1,170,728,640 | 285,661,440 |
| Size | 1.1 GB | 272.4 MB |
| Events in quadrant A | 7,534,256 | 1,929,291 |
| Events in quadrant B | 7,647,230 | 1,939,298 |
| Events in quadrant C | 6,894,996 | 1,911,901 |
| Events in quadrant D | 12,285,265 | 1,756,352 |
| Mode M0 | |||
|---|---|---|---|
| Quadrant | BADHDUFLAG | Total packets | Discarded packets |
| A | 0 | 33628 | 4 |
| B | 0 | 33876 | 3 |
| C | 0 | 32796 | 3 |
| D | 0 | 47937 | 3 |
| Mode M9 | |||
|---|---|---|---|
| Quadrant | BADHDUFLAG | Total packets | Discarded packets |
| A | 0 | 27 | 0 |
| B | 0 | 27 | 0 |
| C | 0 | 27 | 0 |
| D | 0 | 27 | 0 |
| Mode SS | |||
|---|---|---|---|
| Quadrant | BADHDUFLAG | Total packets | Discarded packets |
| A | 0 | 332 | 0 |
| B | 0 | 332 | 0 |
| C | 0 | 332 | 0 |
| D | 0 | 332 | 0 |
| Quadrant | Total seconds | Saturated seconds | Saturation percentage |
|---|---|---|---|
| A | 16166 | 135 | 0.835086% |
| B | 16166 | 130 | 0.804157% |
| C | 16166 | 81 | 0.501052% |
| D | 16166 | 1208 | 7.472473% |
Noise dominated data is calculated using 1-second bins in cleaned event files. If a bin has >2000 counts, and if more than 50% of those come from <1% of pixels, then it is considered to be noise-dominated and hence unusable.
| Quadrant | # 1 sec bins | Bins with >0 counts | Bins with >2000 counts | High rate bins dominated by noise | Noise dominated (total time) | Noise dominated (detector-on time) | Marked lightcurve |
|---|---|---|---|---|---|---|---|
| A | 18946 | 16169 | 22 | 22 | 0.12% | 0.14% | 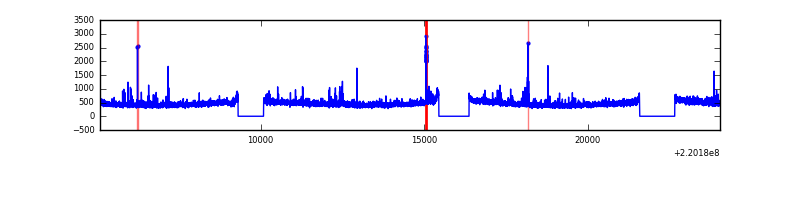 |
| B | 18946 | 16169 | 16 | 16 | 0.08% | 0.10% | 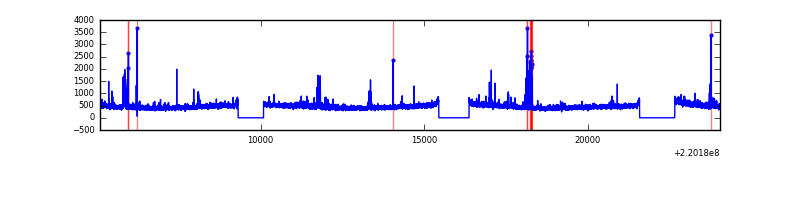 |
| C | 18946 | 16169 | 1 | 1 | 0.01% | 0.01% |  |
| D | 18946 | 16169 | 868 | 868 | 4.58% | 5.37% |  |
Top three noisy pixels from each quadrant. If the there are fewer than three noisy pixels in the level2.evt file, extra rows are filled as -1
| Pixel properties | Quadrant properties | ||||||
|---|---|---|---|---|---|---|---|
| Quadrant | DetID | PixID | Counts | Sigma | Mean | Median | Sigma |
| A | 8 | 15 | 274879 | 739.92 | 1822 | 1780 | 369.1 |
| A | 13 | 251 | 177099 | 475.0 | 1822 | 1780 | 369.1 |
| A | 0 | 226 | 18714 | 45.88 | 1822 | 1780 | 369.1 |
| B | 4 | 80 | 180279 | 511.48 | 1838 | 1795 | 349.0 |
| B | 0 | 214 | 103957 | 292.77 | 1838 | 1795 | 349.0 |
| B | 4 | 173 | 58161 | 161.53 | 1838 | 1795 | 349.0 |
| C | 9 | 247 | 33369 | 78.06 | 1754 | 1759 | 405.0 |
| C | 9 | 54 | 14629 | 31.78 | 1754 | 1759 | 405.0 |
| C | 13 | 61 | 13981 | 30.18 | 1754 | 1759 | 405.0 |
| D | 2 | 33 | 2758520 | 6690.67 | 1691 | 1638 | 412.0 |
| D | 8 | 195 | 1729281 | 4192.81 | 1691 | 1638 | 412.0 |
| D | 2 | 152 | 548507 | 1327.2 | 1691 | 1638 | 412.0 |
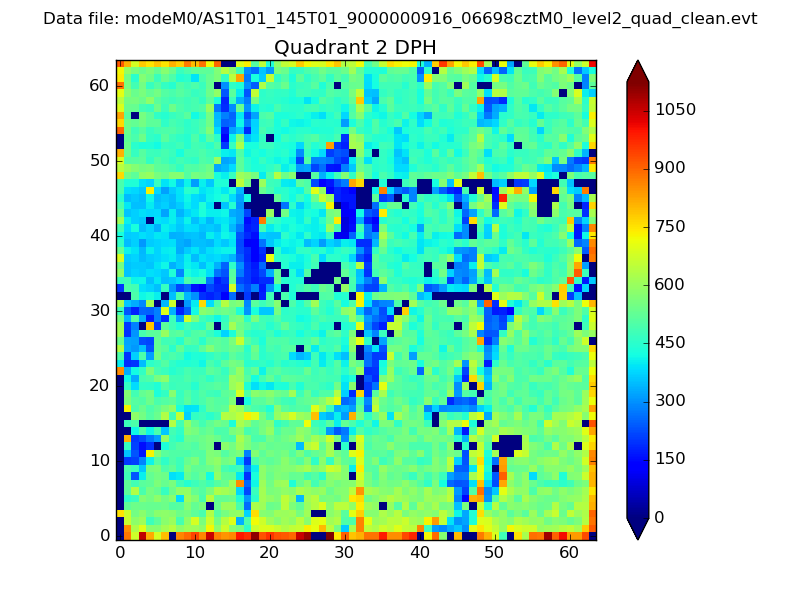
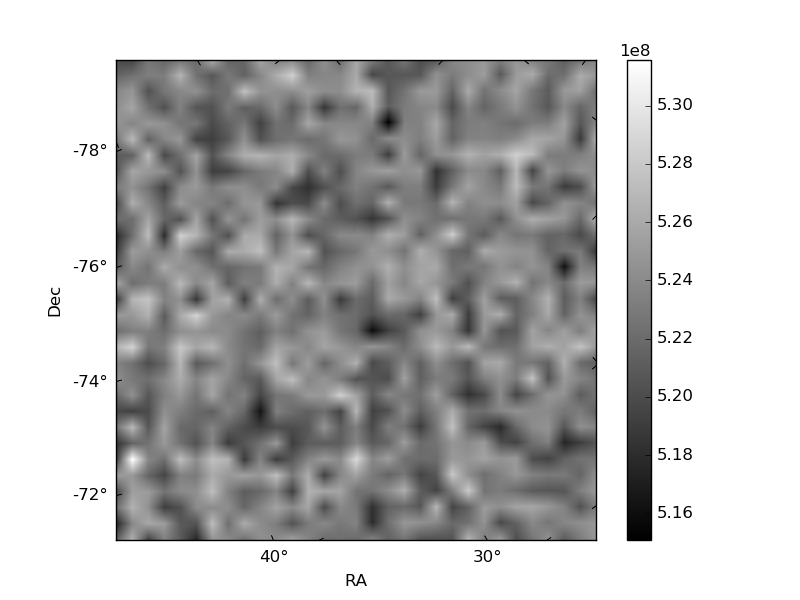
Histogram calculated using DETX and DETY for each event in the final _common_clean file
| Quadrant A | 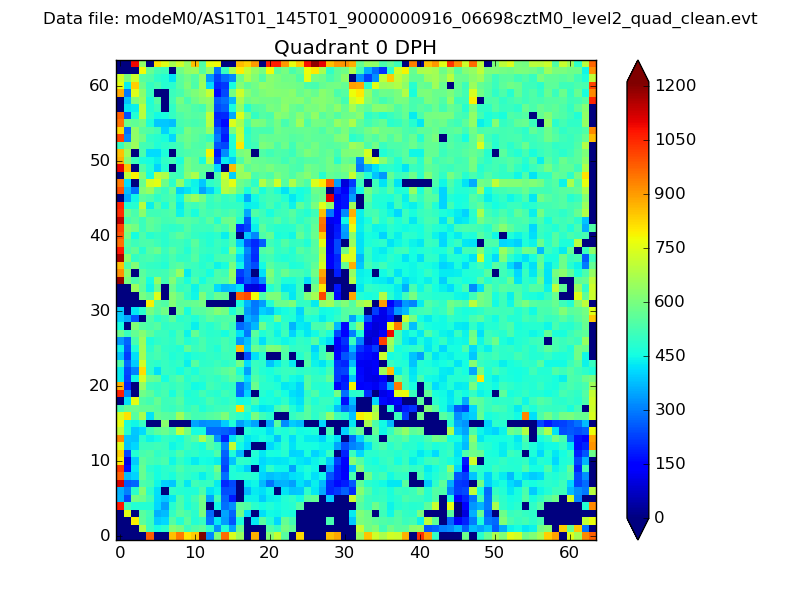 |
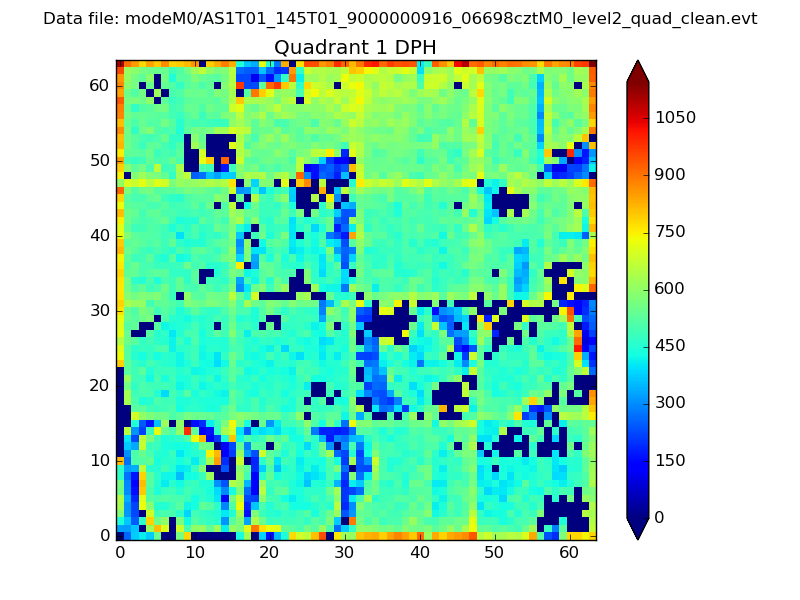 |
Quadrant B |
|---|---|---|---|
| Quadrant D | 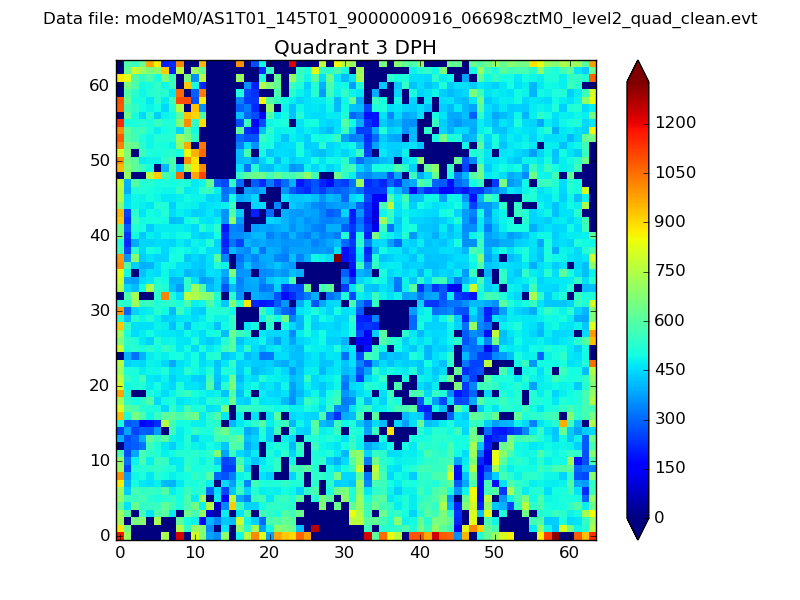 |
 |
Quadrant C |
| Plot type | Count rate plots | Images |
|---|---|---|
| Comparison with Poisson distribution Blue bars denote a histogram of data divided into 1 sec bins. Red curve is a Poisson curve with rate = median count rate of data. |
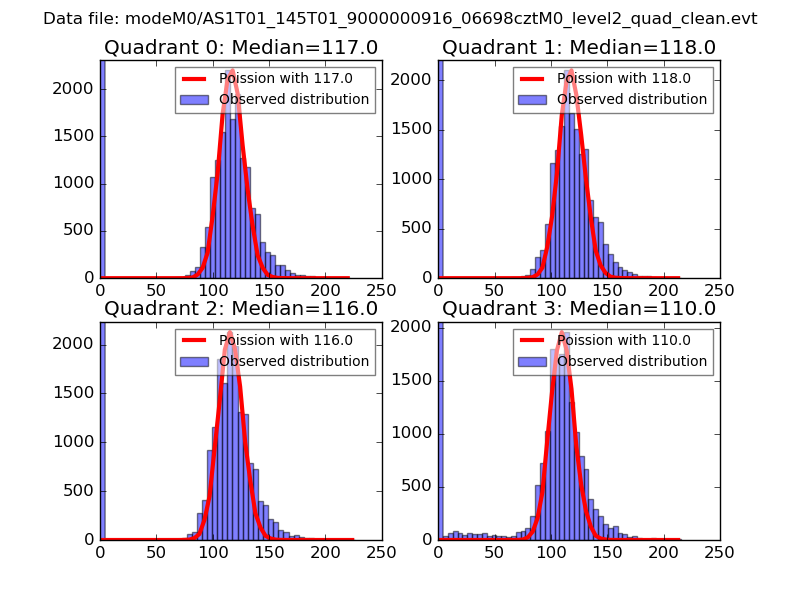 |
 |
| Quadrant-wise count rates Data is divided into 100 sec bins |
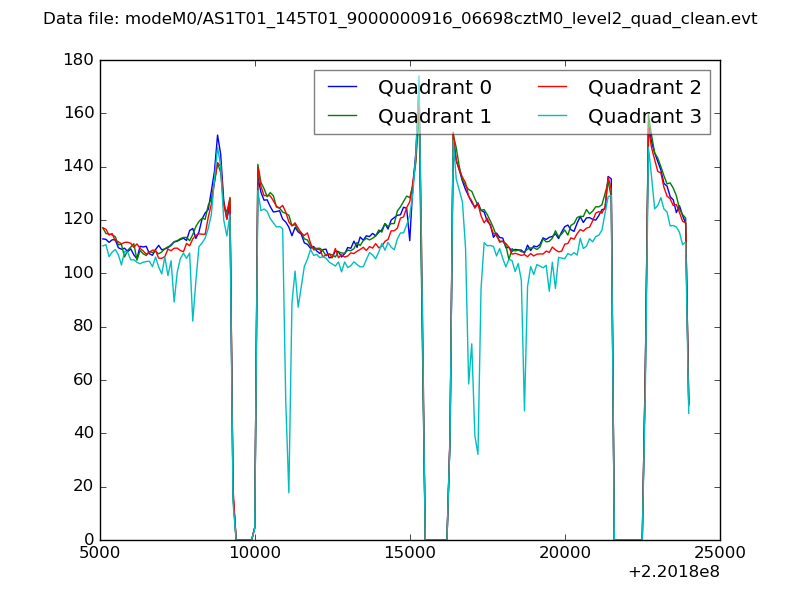 |
|
| Module-wise count rates for Quadrant A Data is divided into 100 sec bins |
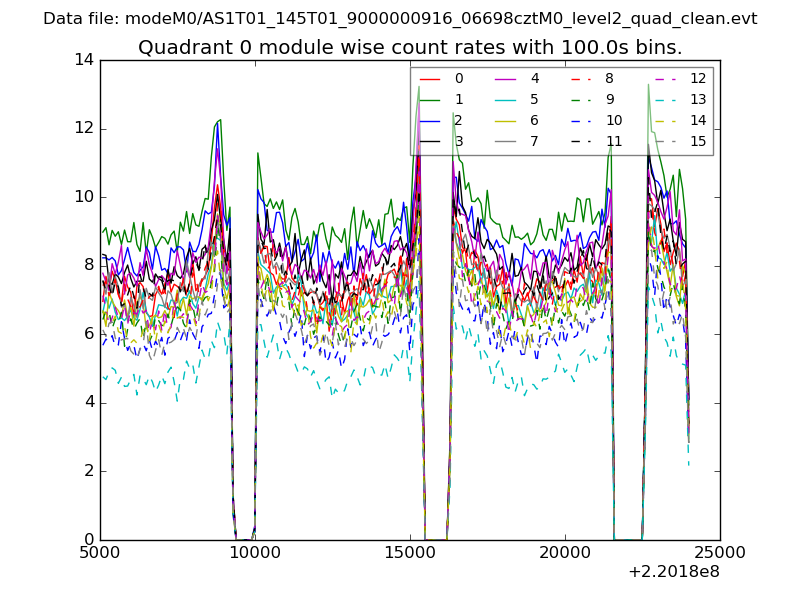 |
 |
| Module-wise count rates for Quadrant B Data is divided into 100 sec bins |
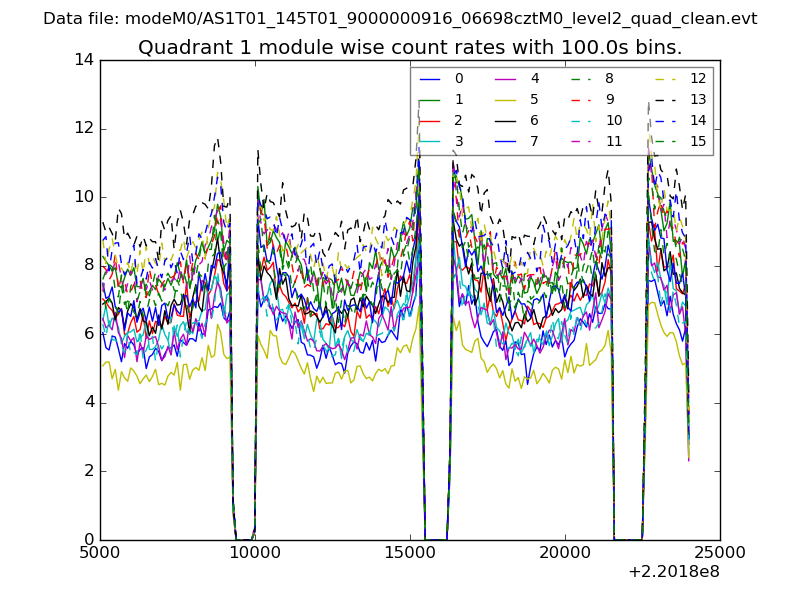 |
 |
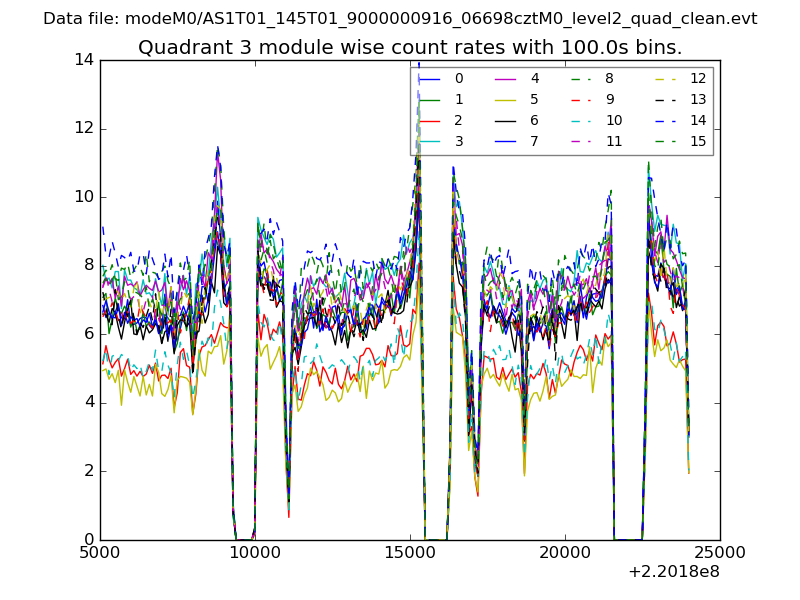
| Module-wise count rates for Quadrant C Data is divided into 100 sec bins |
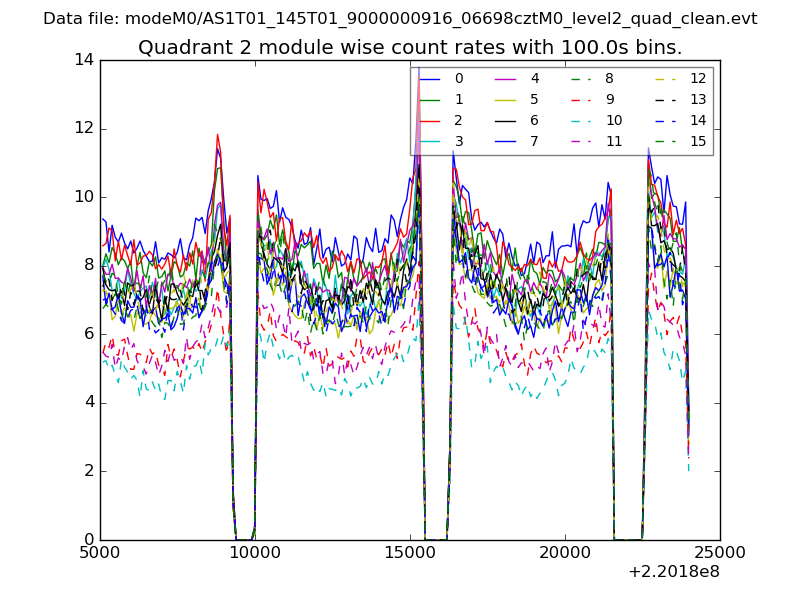 |
 |
| Module-wise count rates for Quadrant D Data is divided into 100 sec bins |
 |
 |
| Parameter | Plot |
|---|---|
| CZT HV Monitor | 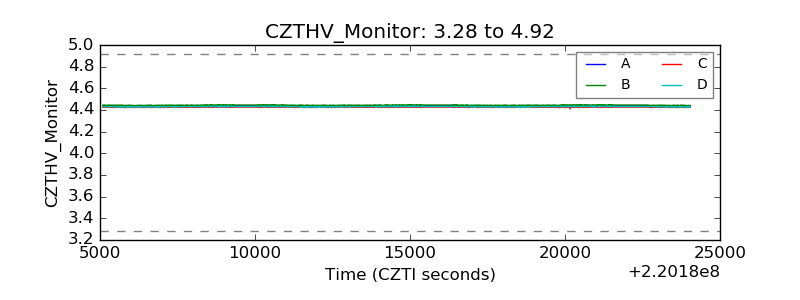 |
| D_VDD | 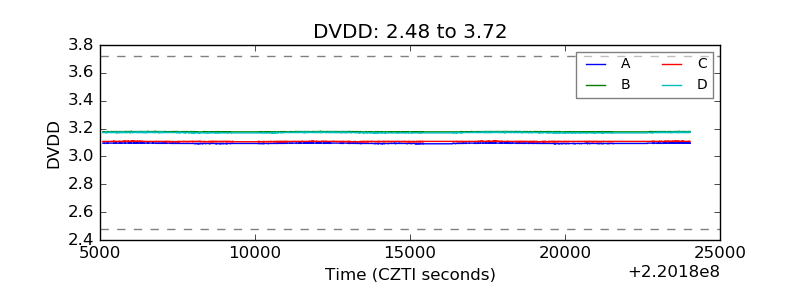 |
| Temperature 1 | 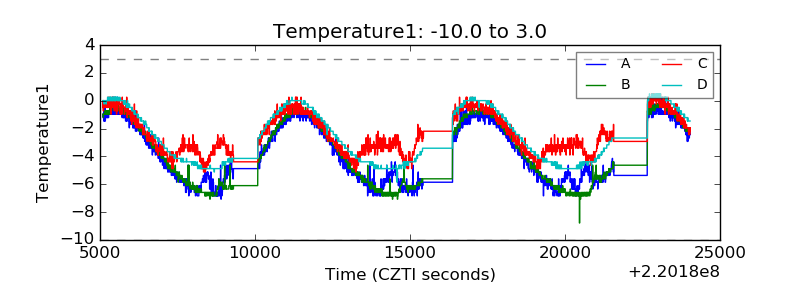 |
| Veto HV Monitor | 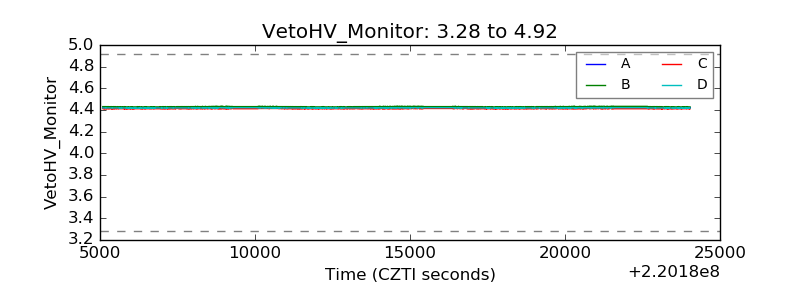 |
| Veto LLD | 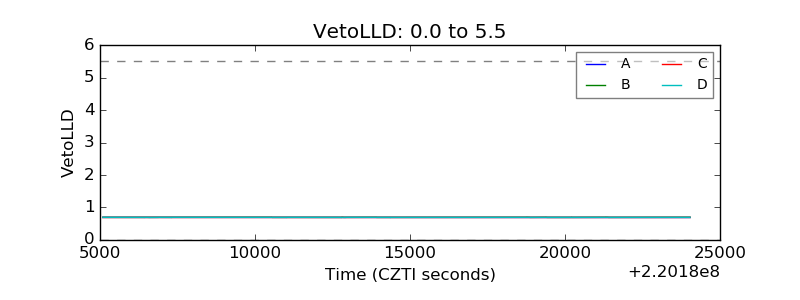 |
| Alpha Counter | 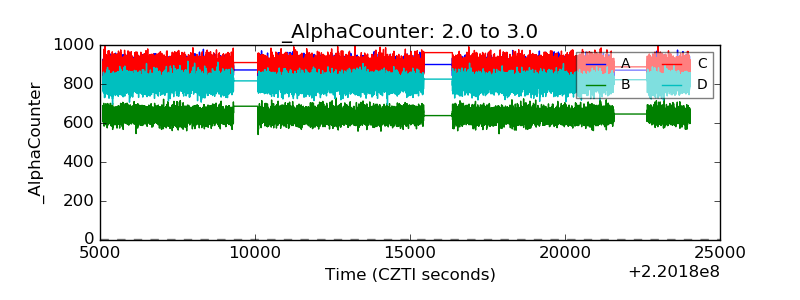 |
| _CPM_Rate | 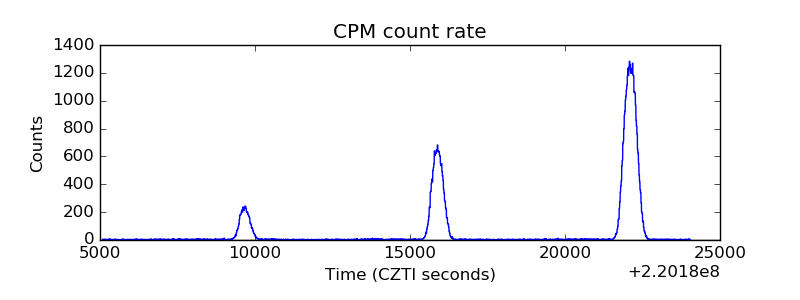 |
| CZT Counter | 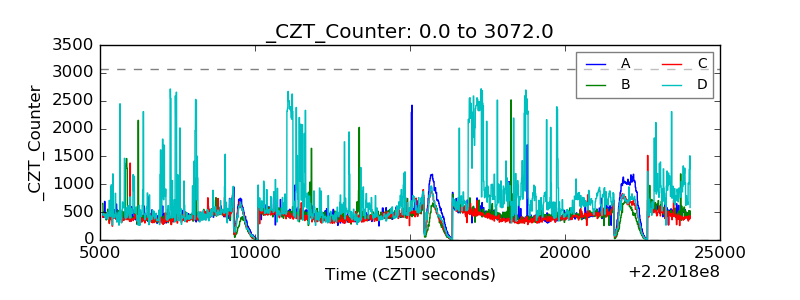 |
| +2.5 Volts monitor |  |
| +5 Volts monitor |  |
| _ROLL_ROT | 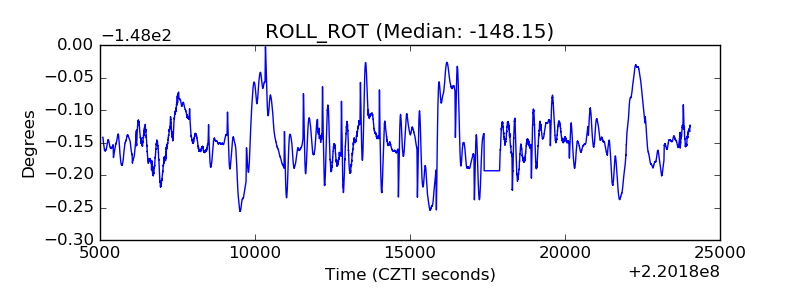 |
| _Roll_DEC | 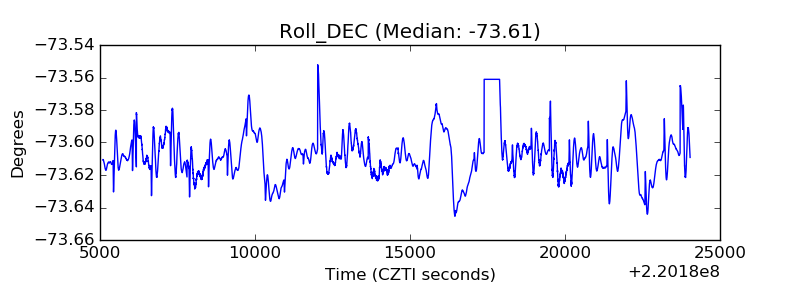 |
| _Roll_RA | 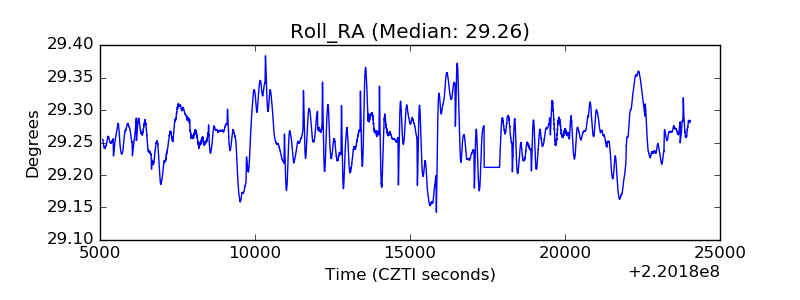 |
| Veto Counter | 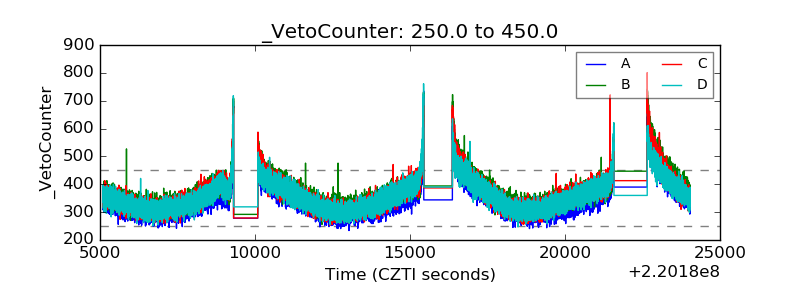 |