| Param | Original file | Final file |
|---|---|---|
| Filename | modeM0/AS1T01_145T01_9000000916_06700cztM0_level2.evt | modeM0/AS1T01_145T01_9000000916_06700cztM0_level2_quad_clean.evt |
| Size (bytes) | 511,885,440 | 110,966,400 |
| Size | 488.2 MB | 105.8 MB |
| Events in quadrant A | 2,952,017 | 774,504 |
| Events in quadrant B | 3,546,254 | 781,064 |
| Events in quadrant C | 2,695,209 | 758,143 |
| Events in quadrant D | 5,895,381 | 621,310 |
| Mode M0 | |||
|---|---|---|---|
| Quadrant | BADHDUFLAG | Total packets | Discarded packets |
| A | 0 | 13040 | 2 |
| B | 0 | 14765 | 1 |
| C | 0 | 12423 | 1 |
| D | 0 | 21474 | 1 |
| Mode M9 | |||
|---|---|---|---|
| Quadrant | BADHDUFLAG | Total packets | Discarded packets |
| A | 0 | 12 | 0 |
| B | 0 | 12 | 0 |
| C | 0 | 12 | 0 |
| D | 0 | 12 | 0 |
| Mode SS | |||
|---|---|---|---|
| Quadrant | BADHDUFLAG | Total packets | Discarded packets |
| A | 0 | 124 | 0 |
| B | 0 | 124 | 0 |
| C | 0 | 124 | 0 |
| D | 0 | 124 | 0 |
| Quadrant | Total seconds | Saturated seconds | Saturation percentage |
|---|---|---|---|
| A | 6089 | 19 | 0.312038% |
| B | 6089 | 149 | 2.447036% |
| C | 6089 | 6 | 0.098538% |
| D | 6089 | 1136 | 18.656594% |
Noise dominated data is calculated using 1-second bins in cleaned event files. If a bin has >2000 counts, and if more than 50% of those come from <1% of pixels, then it is considered to be noise-dominated and hence unusable.
| Quadrant | # 1 sec bins | Bins with >0 counts | Bins with >2000 counts | High rate bins dominated by noise | Noise dominated (total time) | Noise dominated (detector-on time) | Marked lightcurve |
|---|---|---|---|---|---|---|---|
| A | 7334 | 6090 | 1 | 1 | 0.01% | 0.02% | 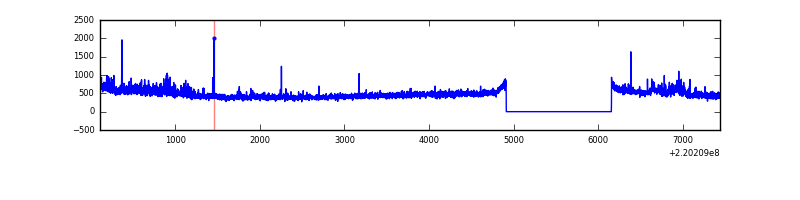 |
| B | 7334 | 6090 | 75 | 75 | 1.02% | 1.23% | 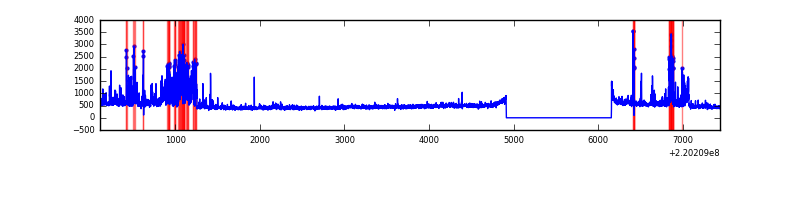 |
| C | 7334 | 6090 | 0 | 0 | 0.00% | 0.00% | 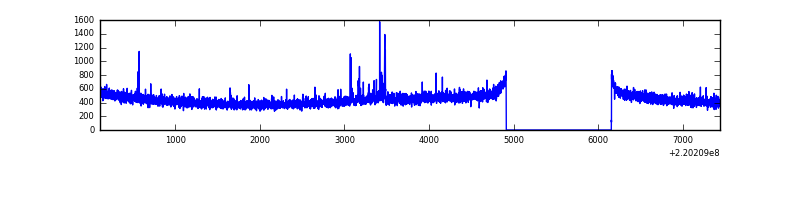 |
| D | 7334 | 6090 | 953 | 953 | 12.99% | 15.65% | 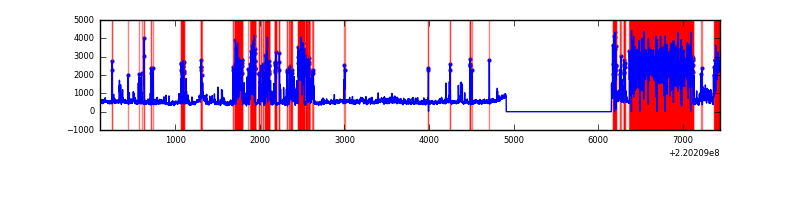 |
Top three noisy pixels from each quadrant. If the there are fewer than three noisy pixels in the level2.evt file, extra rows are filled as -1
| Pixel properties | Quadrant properties | ||||||
|---|---|---|---|---|---|---|---|
| Quadrant | DetID | PixID | Counts | Sigma | Mean | Median | Sigma |
| A | 8 | 15 | 182563 | 1276.09 | 704 | 690 | 142.5 |
| A | 13 | 251 | 38799 | 267.39 | 704 | 690 | 142.5 |
| A | 14 | 111 | 7290 | 46.31 | 704 | 690 | 142.5 |
| B | 4 | 80 | 561492 | 4150.99 | 712 | 695 | 135.1 |
| B | 0 | 219 | 107913 | 793.62 | 712 | 695 | 135.1 |
| B | 0 | 198 | 24289 | 174.64 | 712 | 695 | 135.1 |
| C | 9 | 247 | 30448 | 190.52 | 676 | 678 | 156.3 |
| C | 8 | 128 | 10185 | 60.84 | 676 | 678 | 156.3 |
| C | 13 | 61 | 5671 | 31.95 | 676 | 678 | 156.3 |
| D | 2 | 33 | 2908523 | 20036.28 | 589 | 569 | 145.1 |
| D | 8 | 195 | 418840 | 2881.96 | 589 | 569 | 145.1 |
| D | 2 | 136 | 119583 | 820.03 | 589 | 569 | 145.1 |
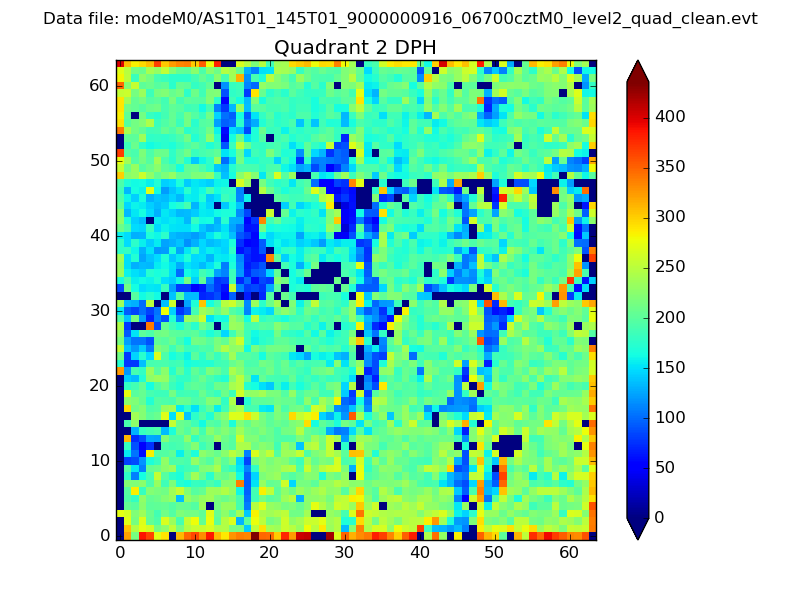
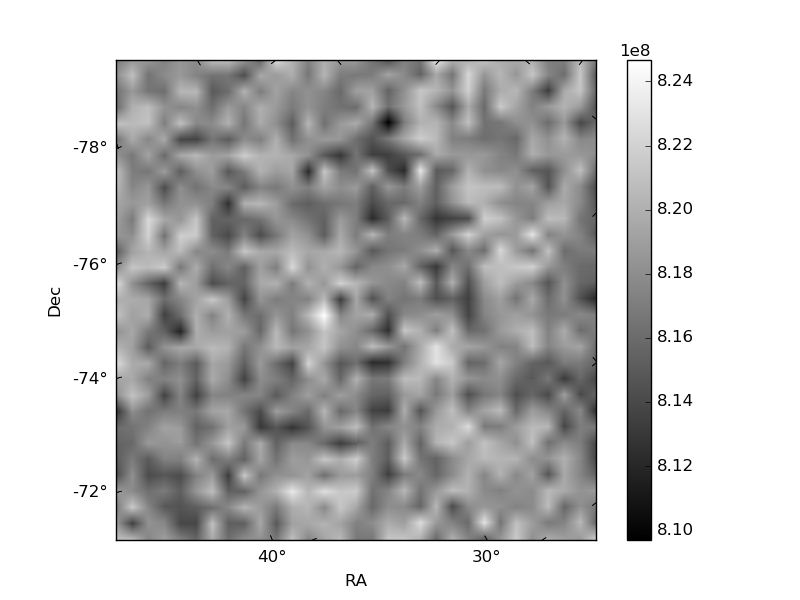
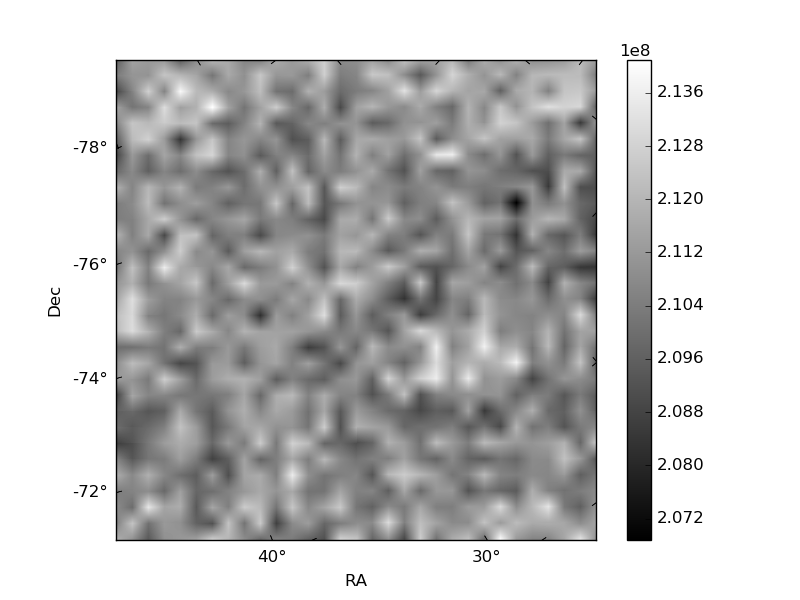
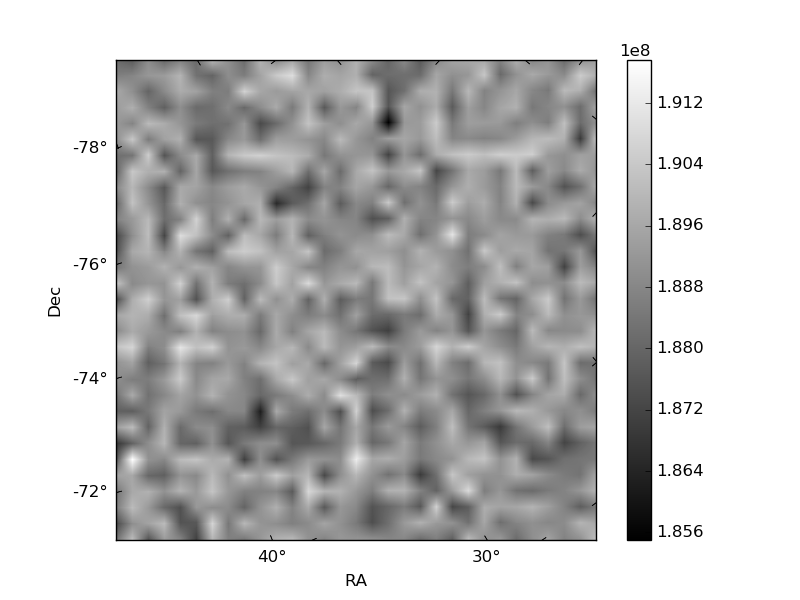
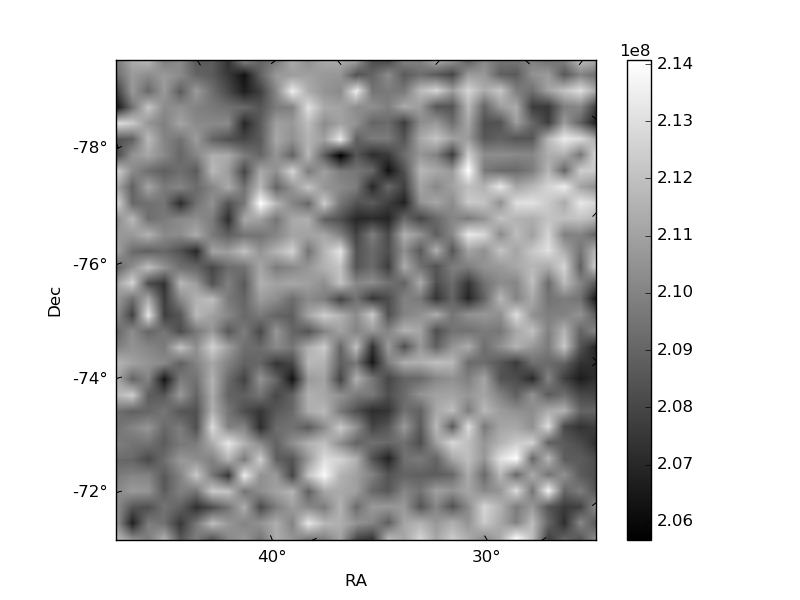
Histogram calculated using DETX and DETY for each event in the final _common_clean file
| Quadrant A | 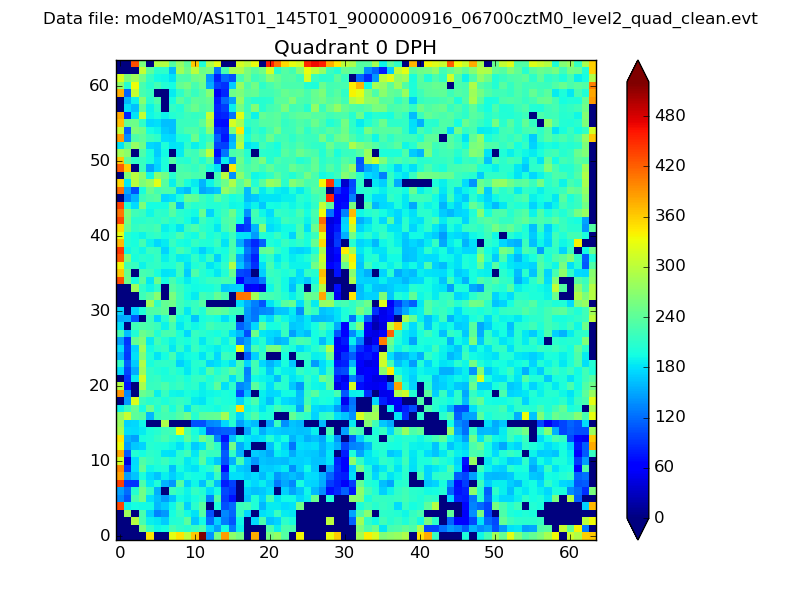 |
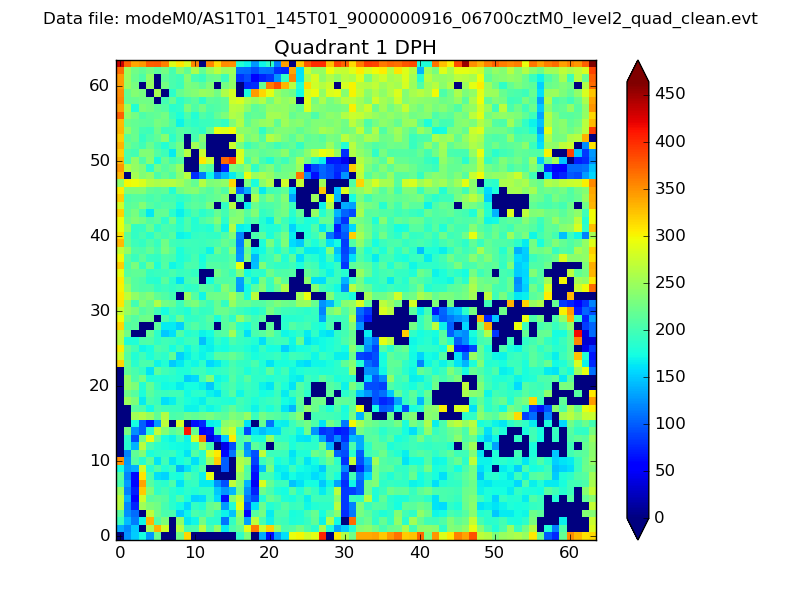 |
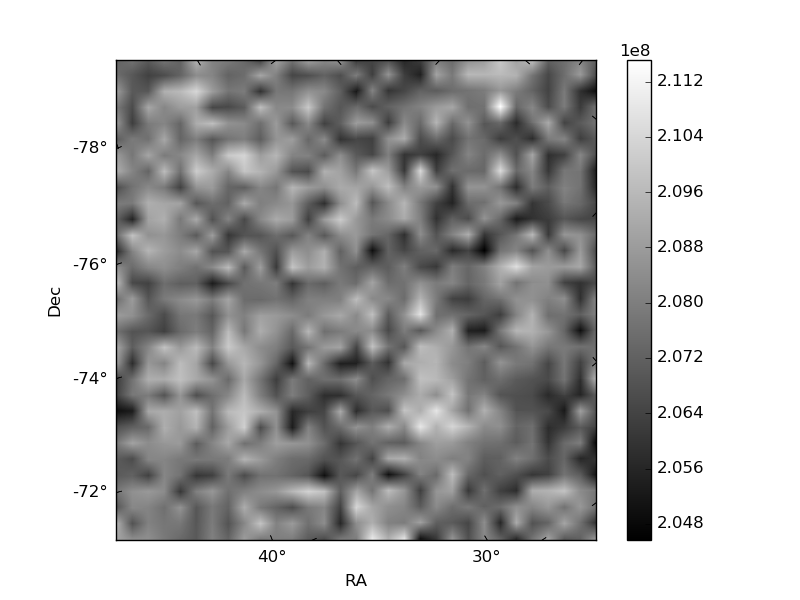
Quadrant B |
|---|---|---|---|
| Quadrant D | 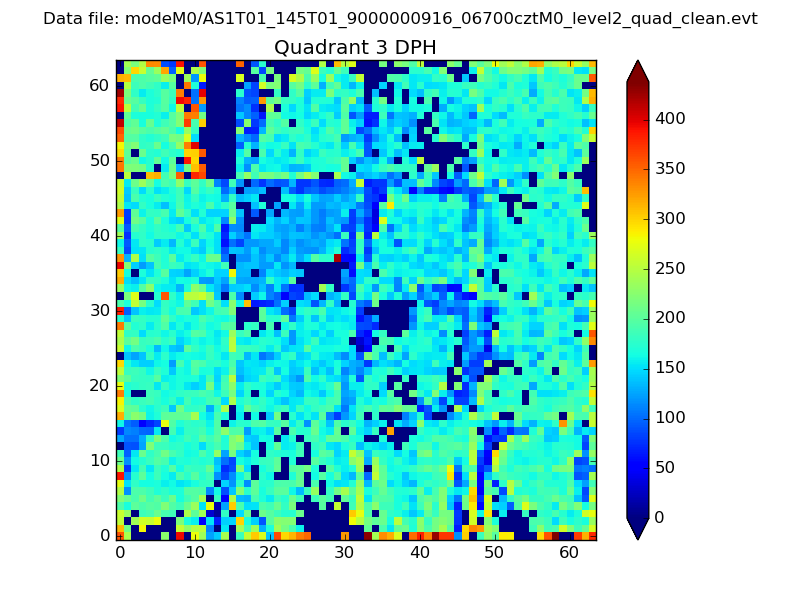 |
 |
Quadrant C |
| Plot type | Count rate plots | Images |
|---|---|---|
| Comparison with Poisson distribution Blue bars denote a histogram of data divided into 1 sec bins. Red curve is a Poisson curve with rate = median count rate of data. |
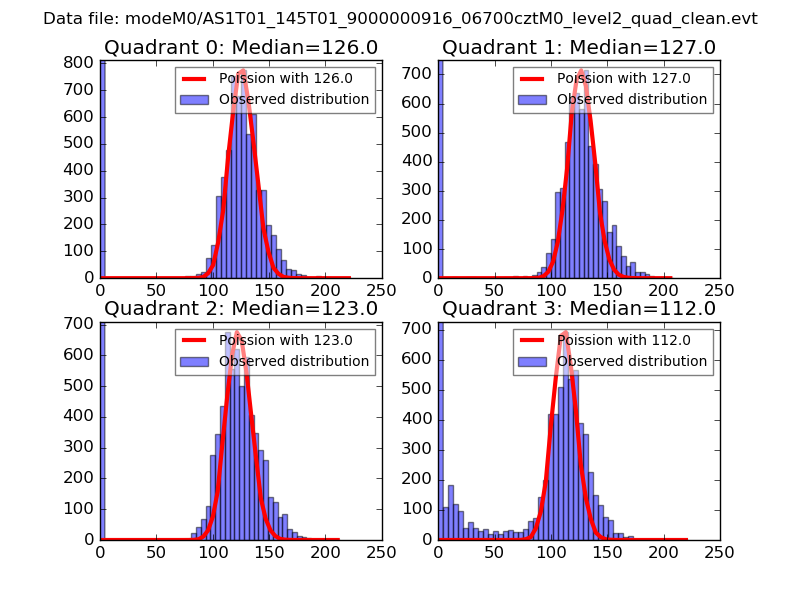 |
 |
| Quadrant-wise count rates Data is divided into 100 sec bins |
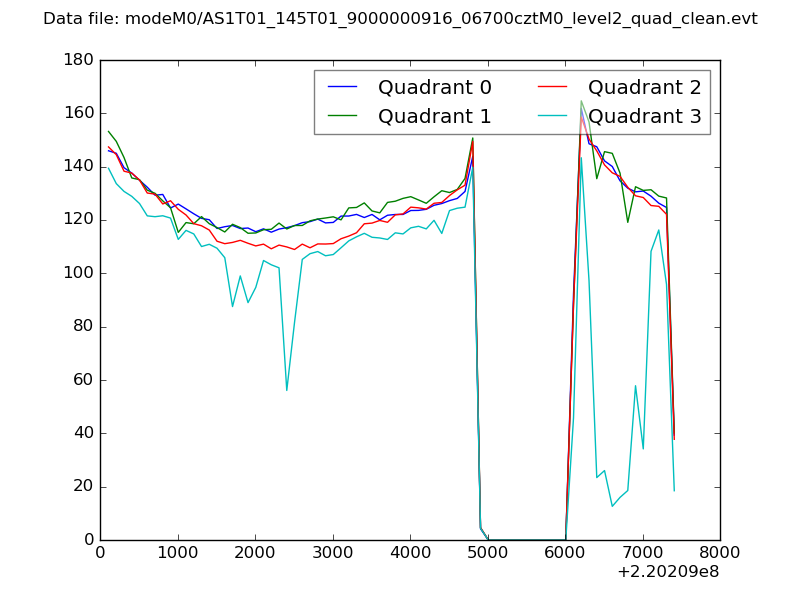 |
|
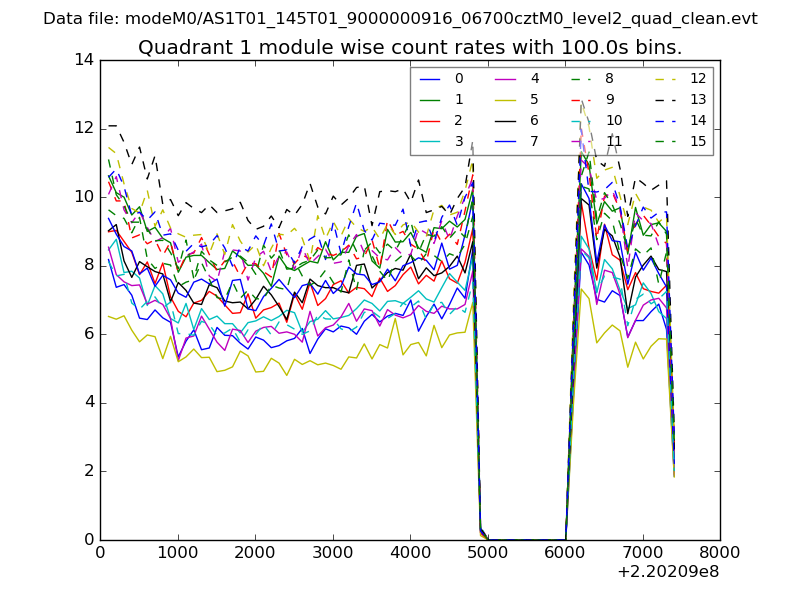
| Module-wise count rates for Quadrant A Data is divided into 100 sec bins |
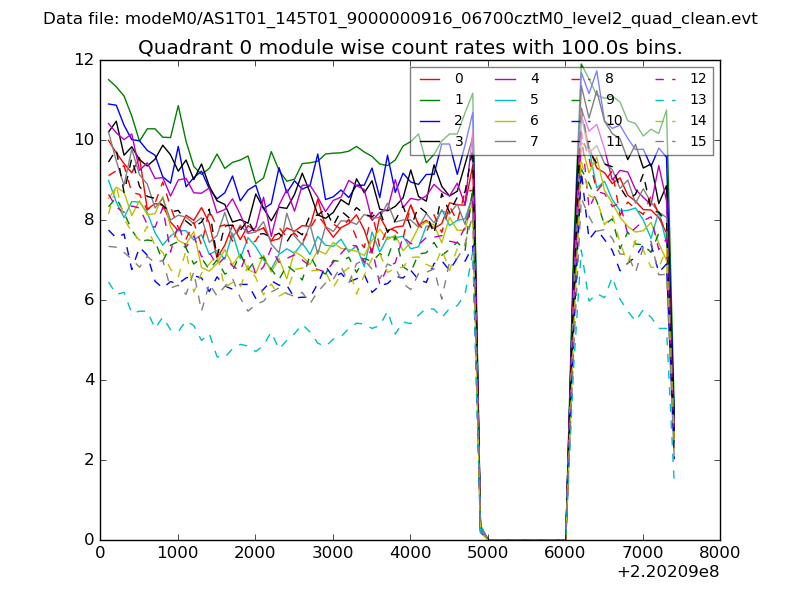 |
 |
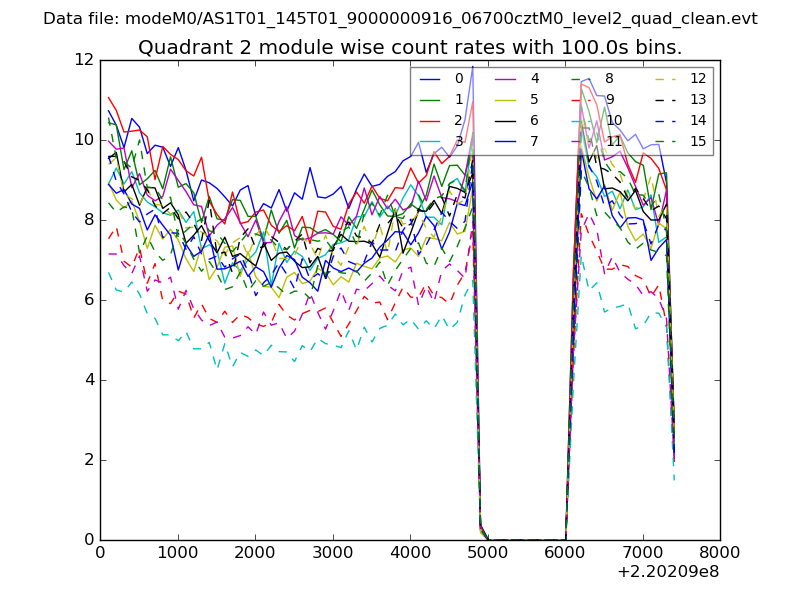
| Module-wise count rates for Quadrant B Data is divided into 100 sec bins |
 |
 |
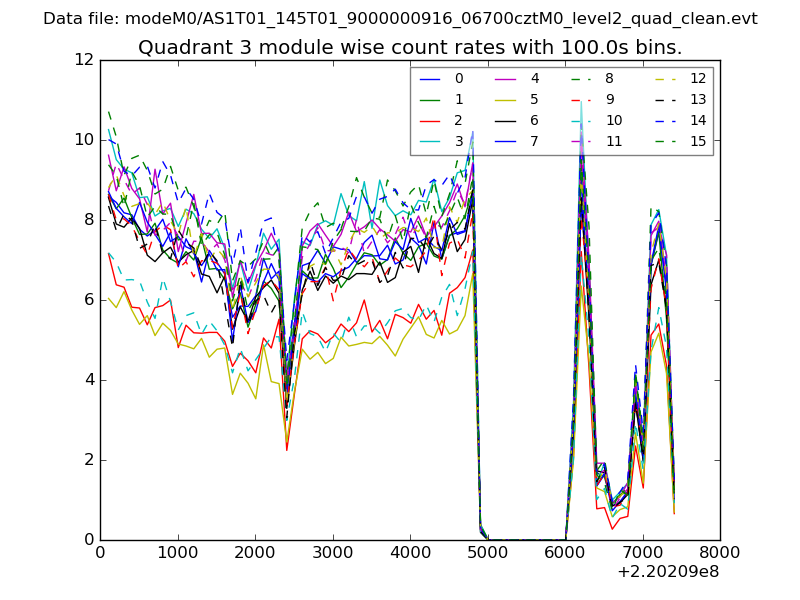
| Module-wise count rates for Quadrant C Data is divided into 100 sec bins |
 |
 |
| Module-wise count rates for Quadrant D Data is divided into 100 sec bins |
 |
 |
| Parameter | Plot |
|---|---|
| CZT HV Monitor | 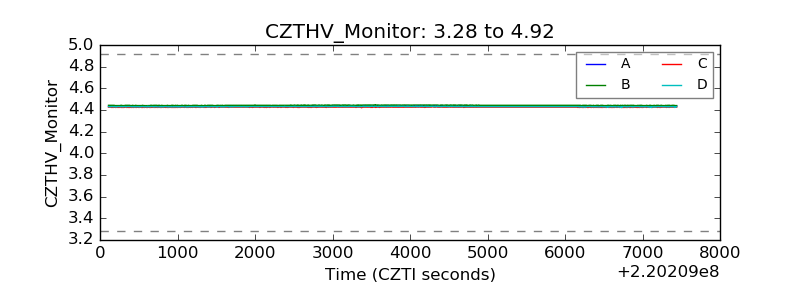 |
| D_VDD | 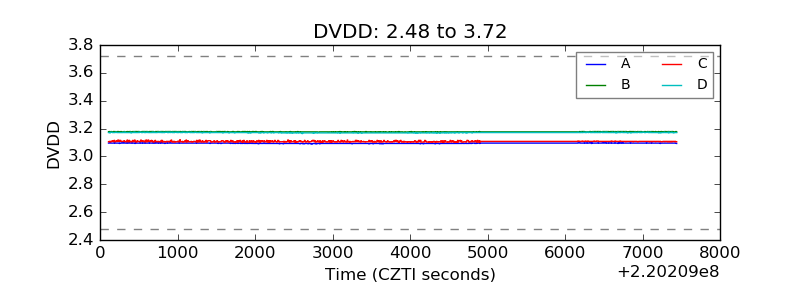 |
| Temperature 1 | 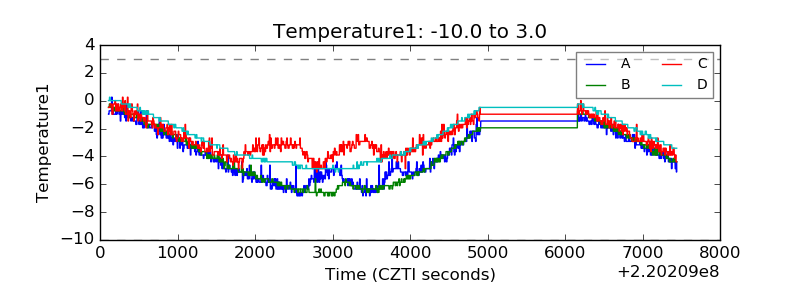 |
| Veto HV Monitor |  |
| Veto LLD | 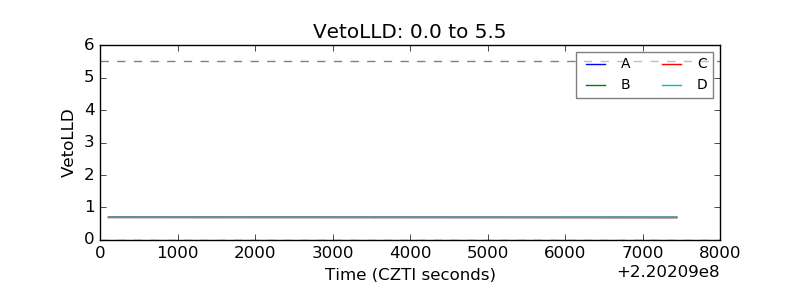 |
| Alpha Counter | 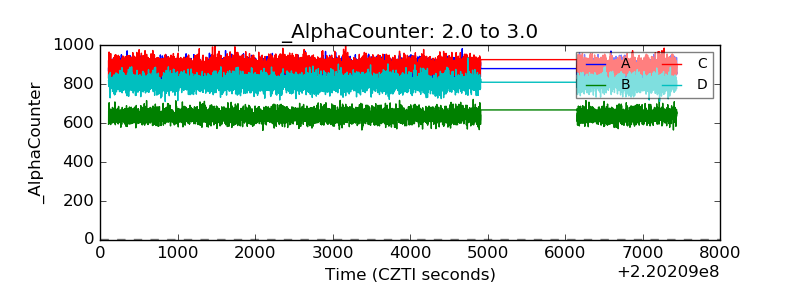 |
| _CPM_Rate | 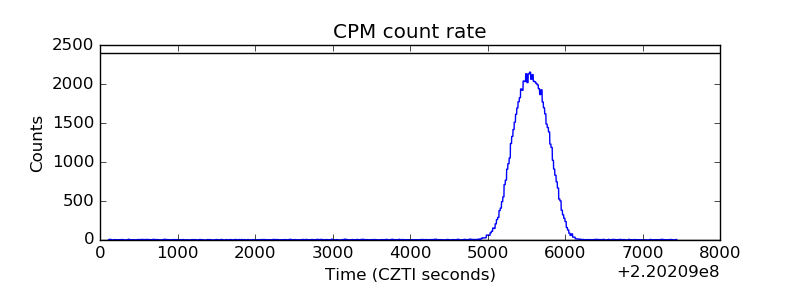 |
| CZT Counter | 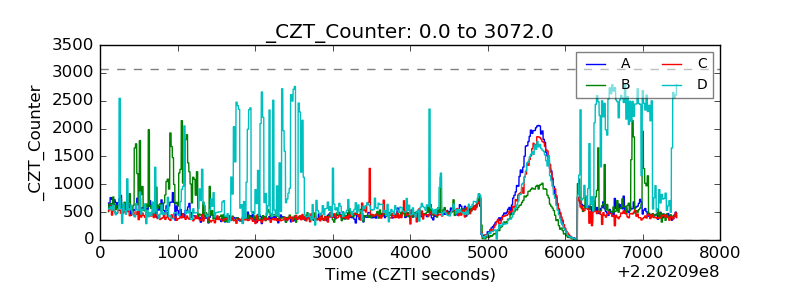 |
| +2.5 Volts monitor |  |
| +5 Volts monitor |  |
| _ROLL_ROT | 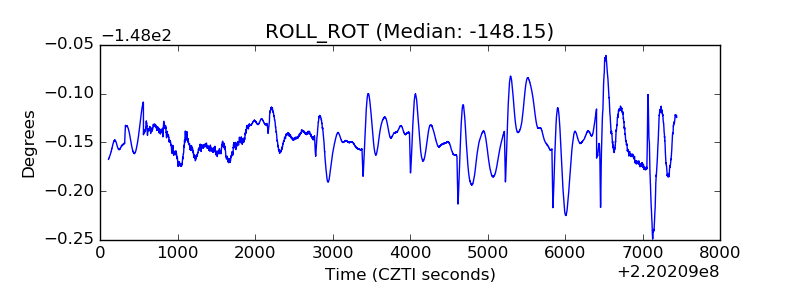 |
| _Roll_DEC | 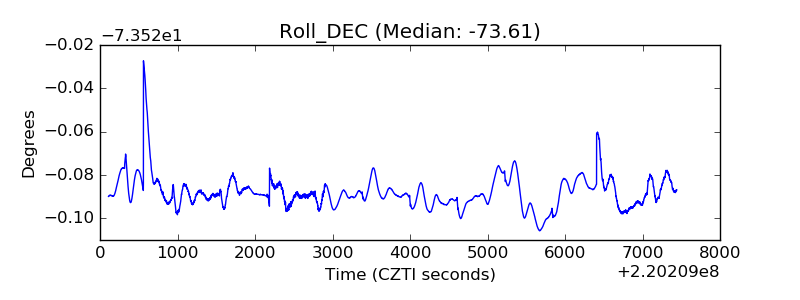 |
| _Roll_RA | 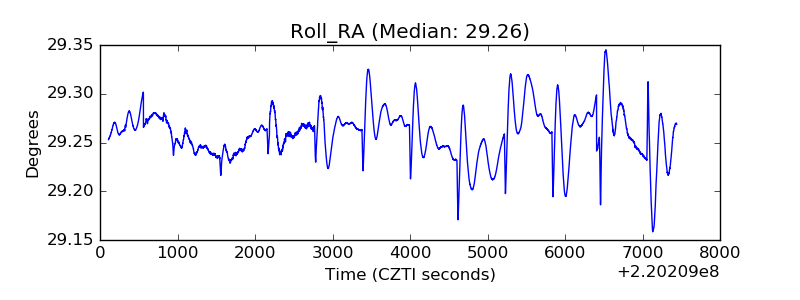 |
| Veto Counter | 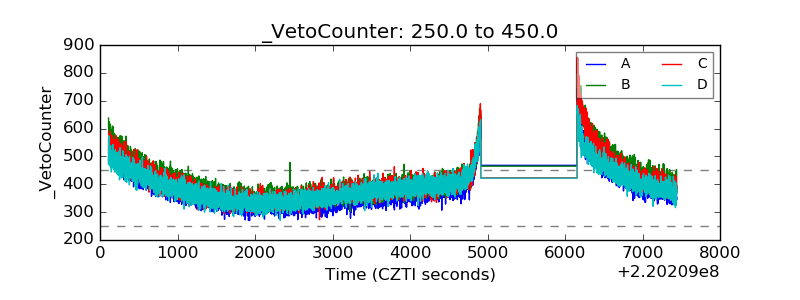 |