| Param | Original file | Final file |
|---|---|---|
| Filename | modeM0/AS1T01_145T01_9000000916_06701cztM0_level2.evt | modeM0/AS1T01_145T01_9000000916_06701cztM0_level2_quad_clean.evt |
| Size (bytes) | 592,862,400 | 111,862,080 |
| Size | 565.4 MB | 106.7 MB |
| Events in quadrant A | 3,026,665 | 796,851 |
| Events in quadrant B | 3,283,300 | 812,463 |
| Events in quadrant C | 2,738,292 | 786,825 |
| Events in quadrant D | 8,484,783 | 556,857 |
| Mode M0 | |||
|---|---|---|---|
| Quadrant | BADHDUFLAG | Total packets | Discarded packets |
| A | 0 | 13254 | 3 |
| B | 0 | 14001 | 2 |
| C | 0 | 12640 | 2 |
| D | 0 | 29428 | 2 |
| Mode M9 | |||
|---|---|---|---|
| Quadrant | BADHDUFLAG | Total packets | Discarded packets |
| A | 0 | 13 | 0 |
| B | 0 | 13 | 0 |
| C | 0 | 13 | 0 |
| D | 0 | 13 | 0 |
| Mode SS | |||
|---|---|---|---|
| Quadrant | BADHDUFLAG | Total packets | Discarded packets |
| A | 0 | 126 | 0 |
| B | 0 | 126 | 0 |
| C | 0 | 126 | 0 |
| D | 0 | 126 | 0 |
| Quadrant | Total seconds | Saturated seconds | Saturation percentage |
|---|---|---|---|
| A | 6220 | 59 | 0.948553% |
| B | 6220 | 116 | 1.864952% |
| C | 6220 | 11 | 0.176849% |
| D | 6220 | 2236 | 35.948553% |
Noise dominated data is calculated using 1-second bins in cleaned event files. If a bin has >2000 counts, and if more than 50% of those come from <1% of pixels, then it is considered to be noise-dominated and hence unusable.
| Quadrant | # 1 sec bins | Bins with >0 counts | Bins with >2000 counts | High rate bins dominated by noise | Noise dominated (total time) | Noise dominated (detector-on time) | Marked lightcurve |
|---|---|---|---|---|---|---|---|
| A | 7520 | 6221 | 10 | 10 | 0.13% | 0.16% | 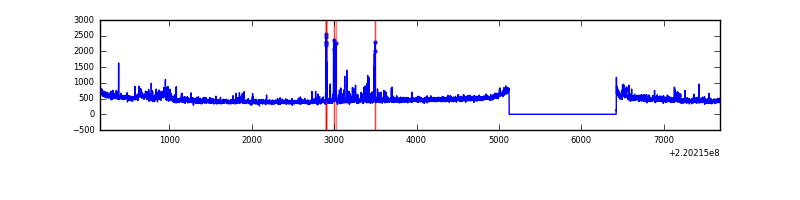 |
| B | 7520 | 6221 | 38 | 38 | 0.51% | 0.61% | 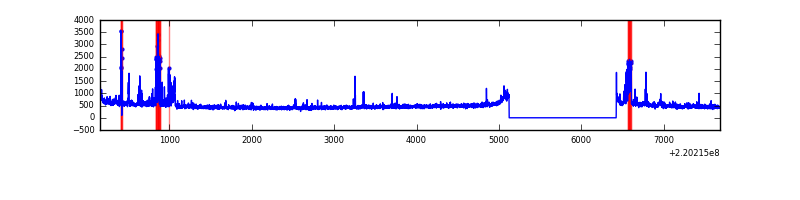 |
| C | 7520 | 6221 | 0 | 0 | 0.00% | 0.00% |  |
| D | 7520 | 6221 | 1905 | 1905 | 25.33% | 30.62% | 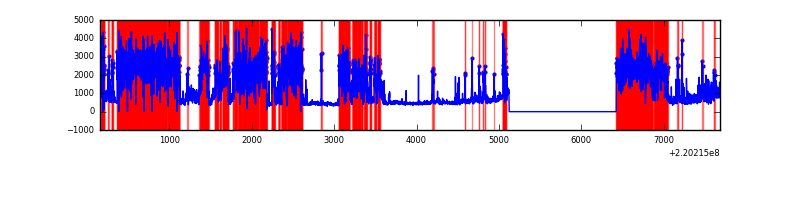 |
Top three noisy pixels from each quadrant. If the there are fewer than three noisy pixels in the level2.evt file, extra rows are filled as -1
| Pixel properties | Quadrant properties | ||||||
|---|---|---|---|---|---|---|---|
| Quadrant | DetID | PixID | Counts | Sigma | Mean | Median | Sigma |
| A | 8 | 15 | 205035 | 1392.47 | 724 | 709 | 146.7 |
| A | 14 | 111 | 24697 | 163.48 | 724 | 709 | 146.7 |
| A | 0 | 226 | 7224 | 44.4 | 724 | 709 | 146.7 |
| B | 4 | 80 | 241386 | 1733.2 | 736 | 719 | 138.9 |
| B | 0 | 219 | 70029 | 499.15 | 736 | 719 | 138.9 |
| B | 0 | 214 | 28136 | 197.45 | 736 | 719 | 138.9 |
| C | 13 | 61 | 5703 | 30.94 | 699 | 702 | 161.6 |
| C | 8 | 128 | 3732 | 18.75 | 699 | 702 | 161.6 |
| C | 9 | 54 | 3153 | 15.16 | 699 | 702 | 161.6 |
| D | 2 | 33 | 5679796 | 42254.25 | 543 | 523 | 134.4 |
| D | 2 | 152 | 236216 | 1753.57 | 543 | 523 | 134.4 |
| D | 8 | 195 | 159818 | 1185.17 | 543 | 523 | 134.4 |
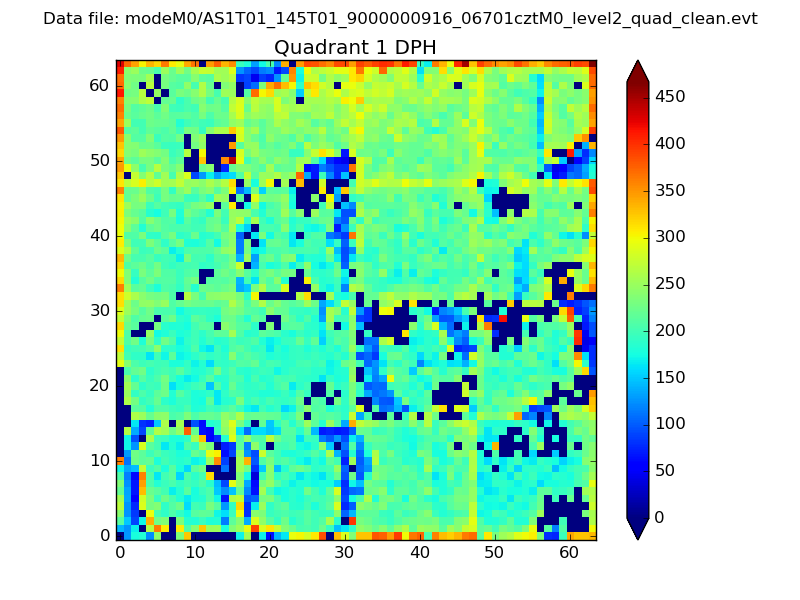
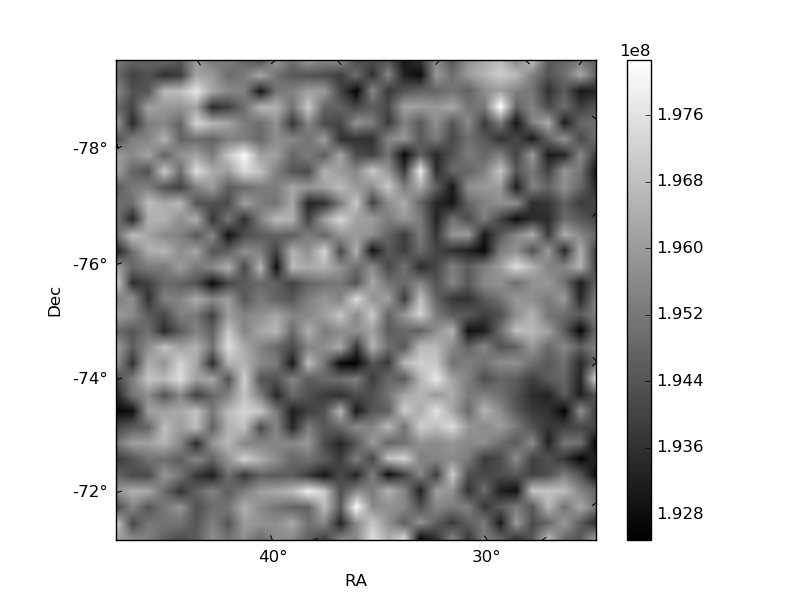
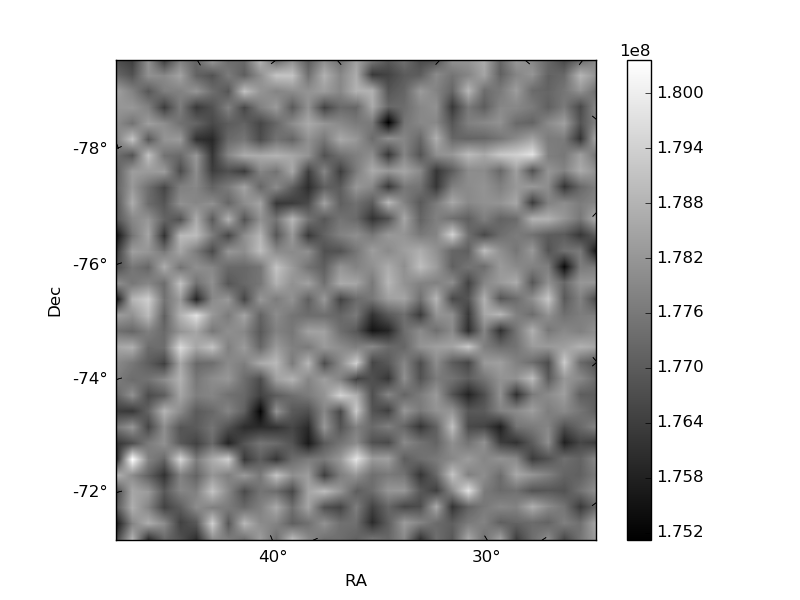
Histogram calculated using DETX and DETY for each event in the final _common_clean file
| Quadrant A | 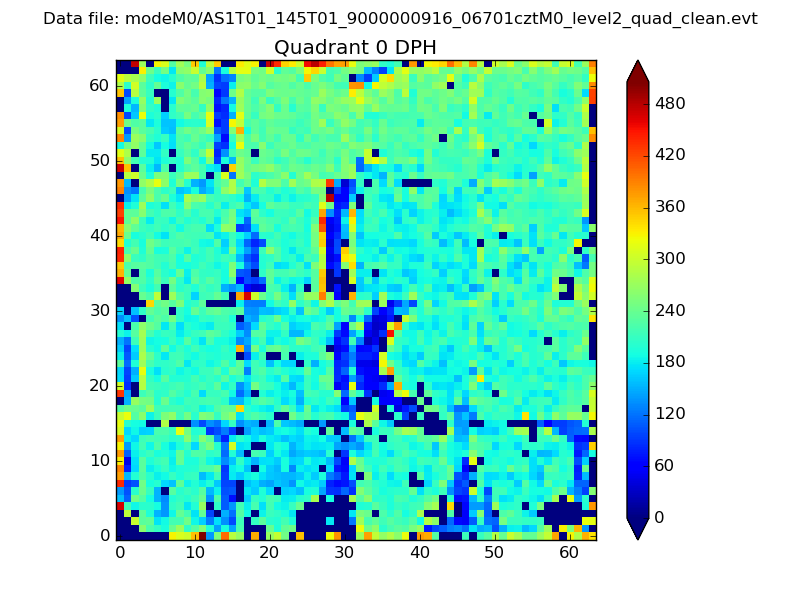 |
 |
Quadrant B |
|---|---|---|---|
| Quadrant D | 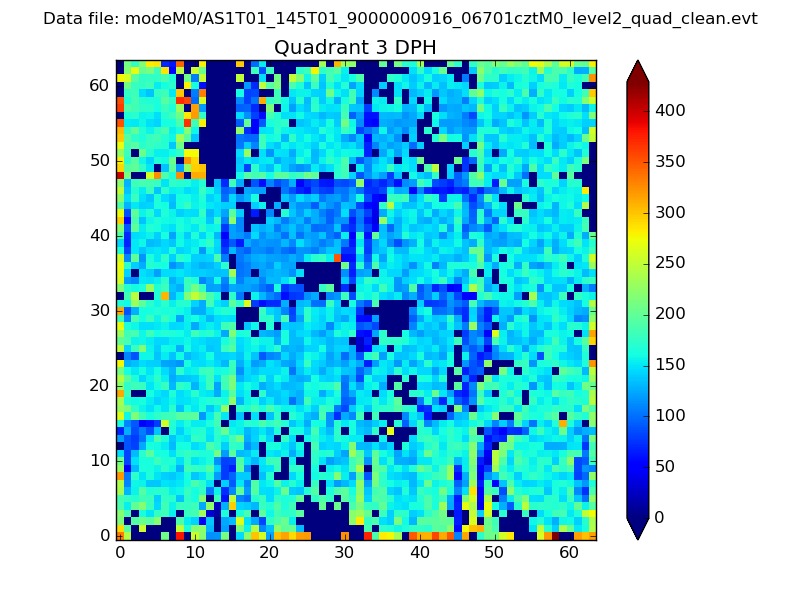 |
 |
Quadrant C |
| Plot type | Count rate plots | Images |
|---|---|---|
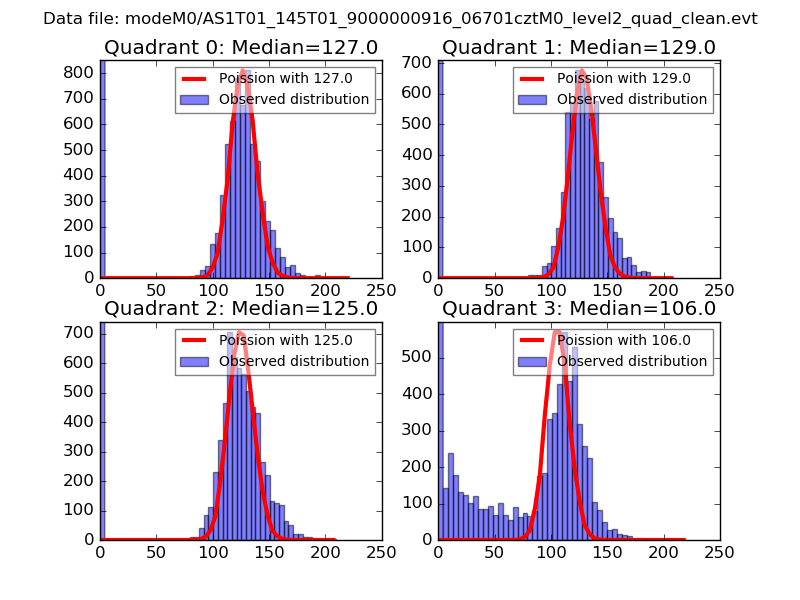
| Comparison with Poisson distribution Blue bars denote a histogram of data divided into 1 sec bins. Red curve is a Poisson curve with rate = median count rate of data. |
 |
 |
| Quadrant-wise count rates Data is divided into 100 sec bins |
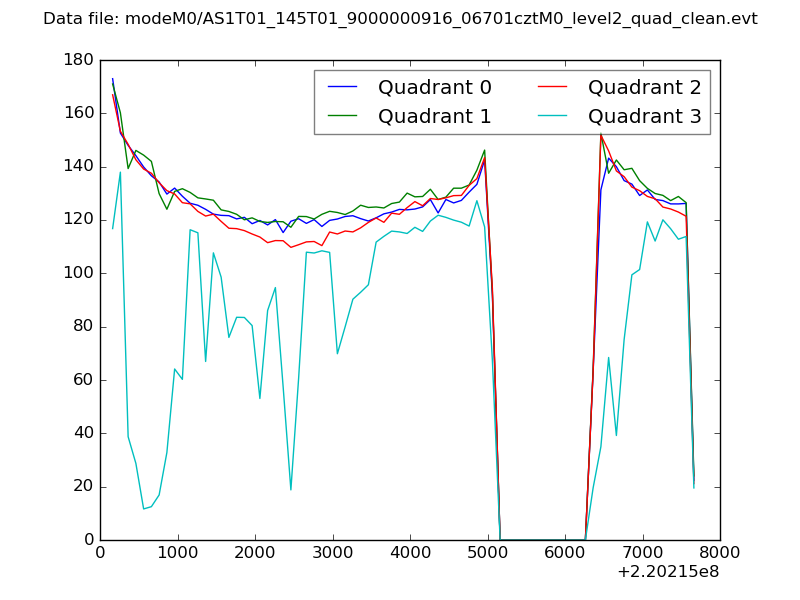 |
|
| Module-wise count rates for Quadrant A Data is divided into 100 sec bins |
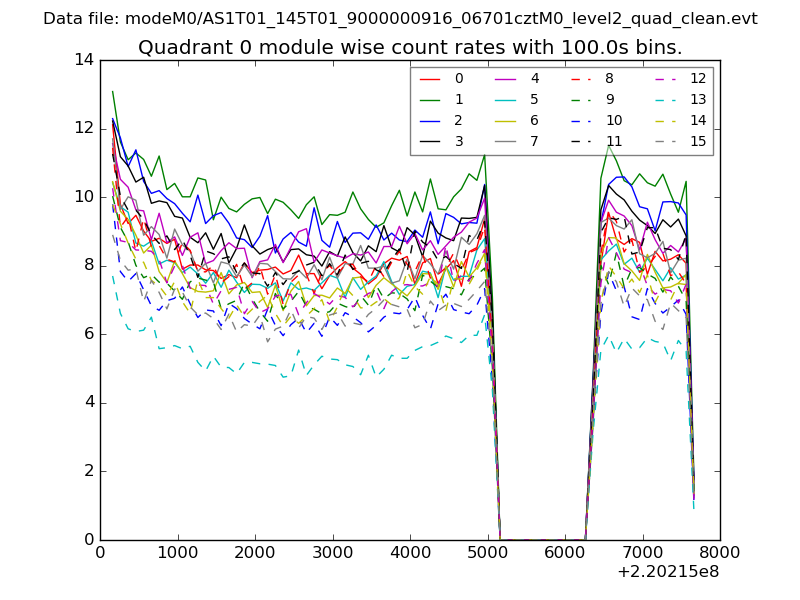 |
 |
| Module-wise count rates for Quadrant B Data is divided into 100 sec bins |
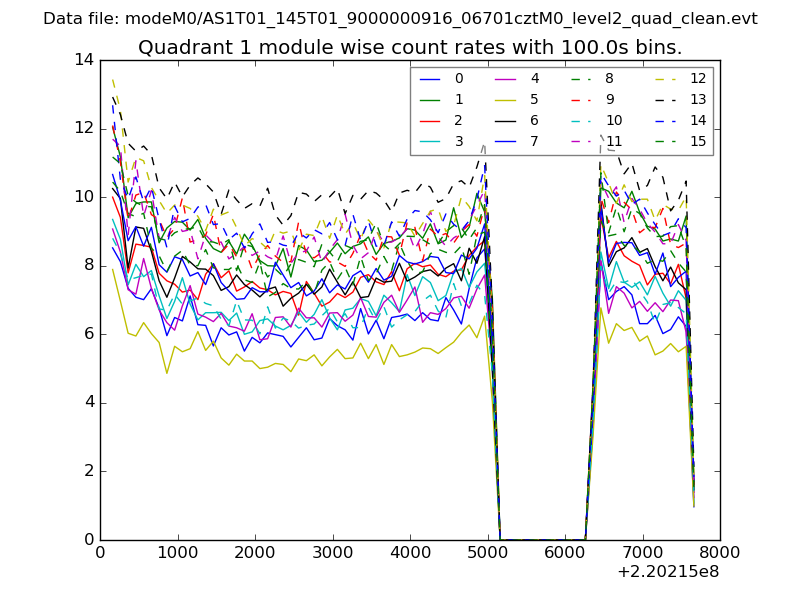 |
 |
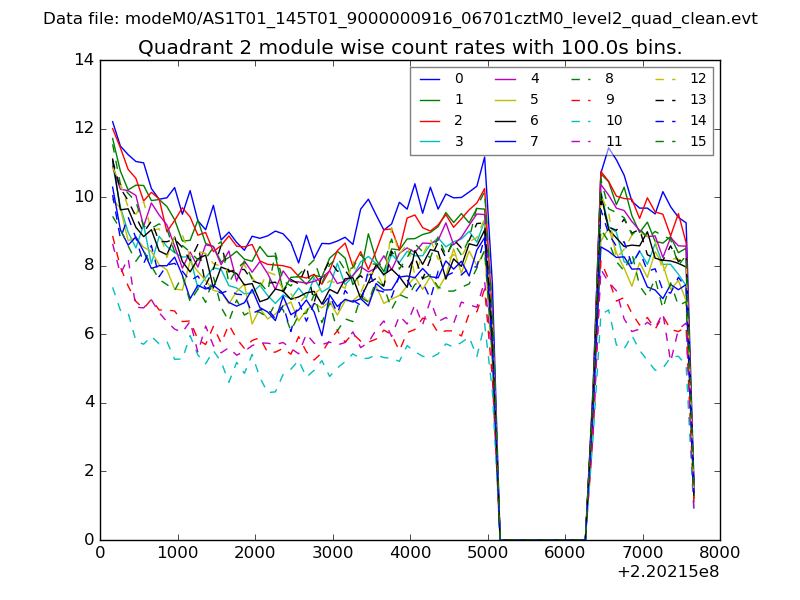
| Module-wise count rates for Quadrant C Data is divided into 100 sec bins |
 |
 |
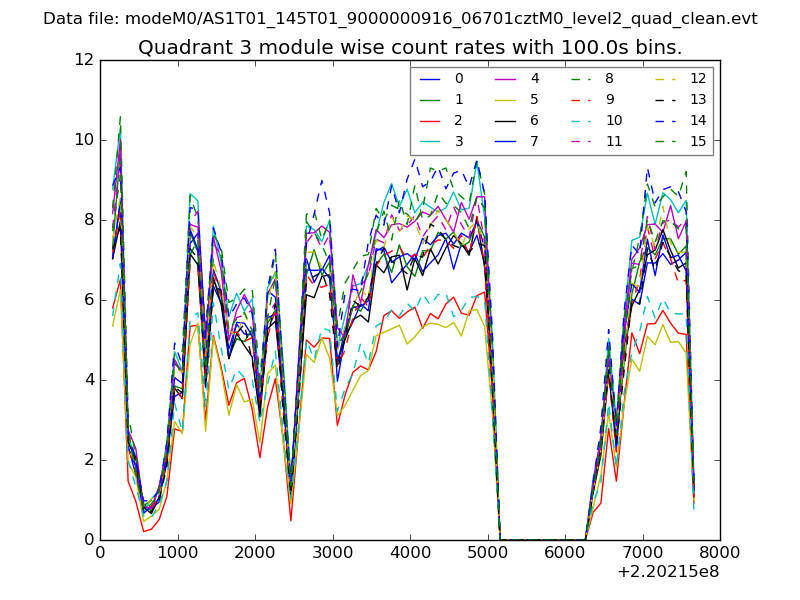
| Module-wise count rates for Quadrant D Data is divided into 100 sec bins |
 |
 |
| Parameter | Plot |
|---|---|
| CZT HV Monitor | 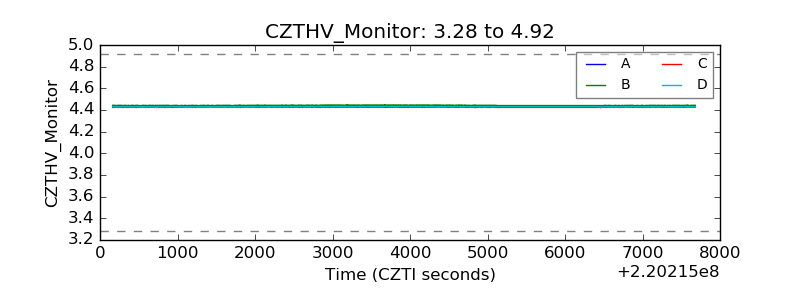 |
| D_VDD | 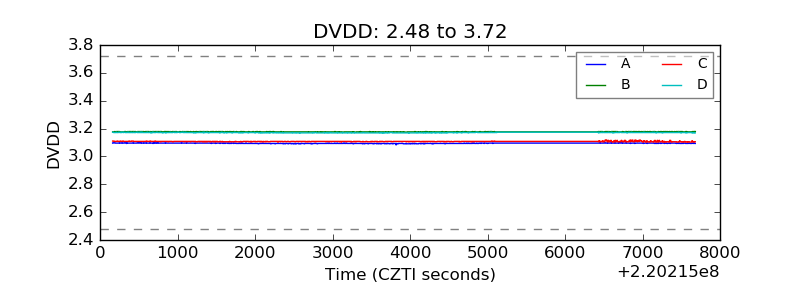 |
| Temperature 1 | 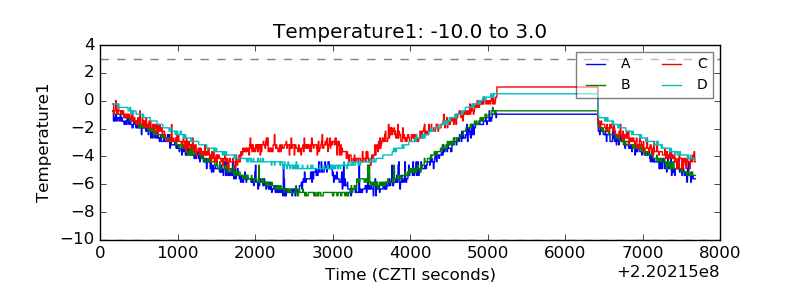 |
| Veto HV Monitor | 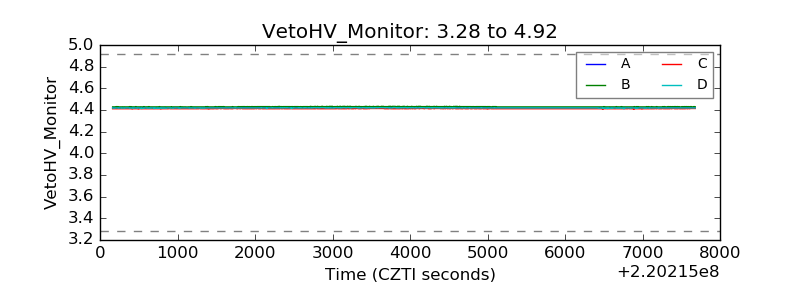 |
| Veto LLD | 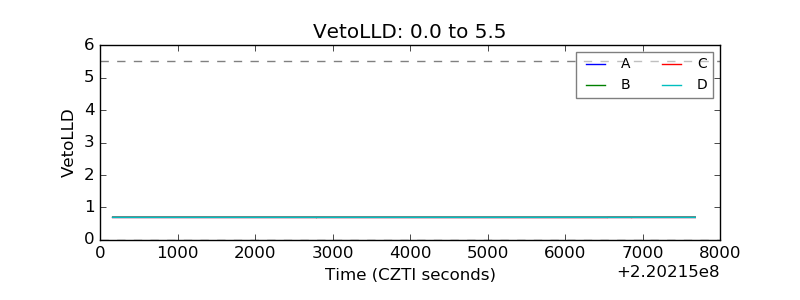 |
| Alpha Counter | 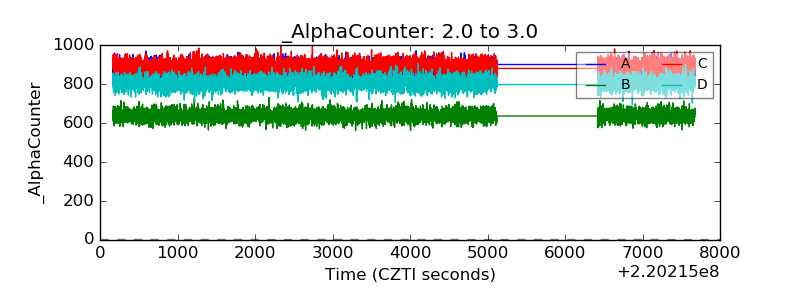 |
| _CPM_Rate | 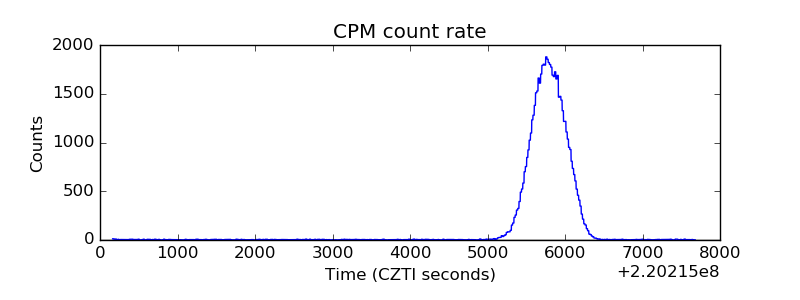 |
| CZT Counter | 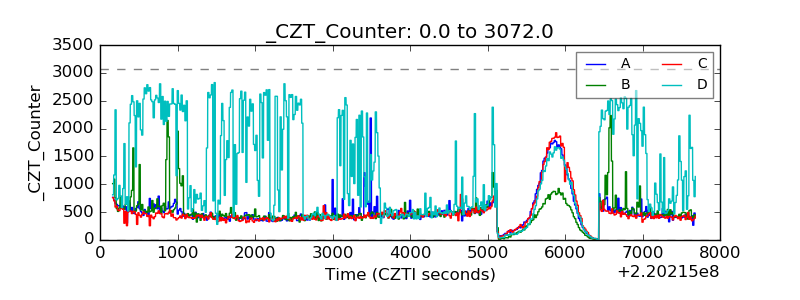 |
| +2.5 Volts monitor | 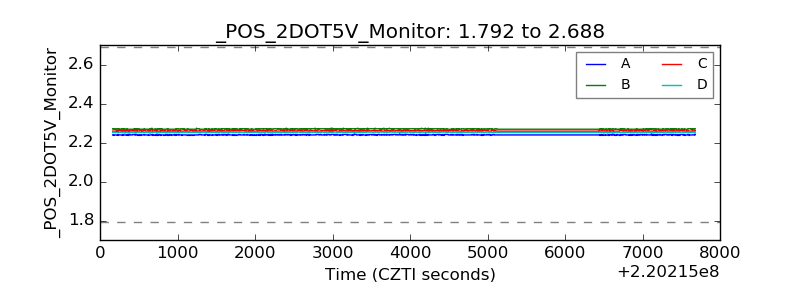 |
| +5 Volts monitor |  |
| _ROLL_ROT | 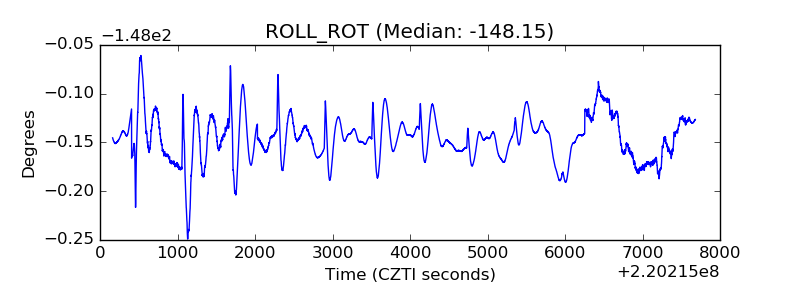 |
| _Roll_DEC | 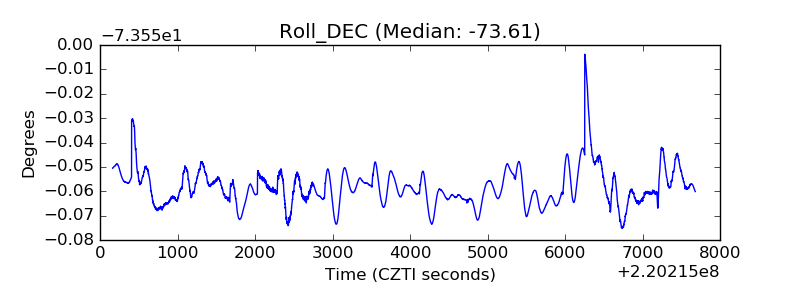 |
| _Roll_RA | 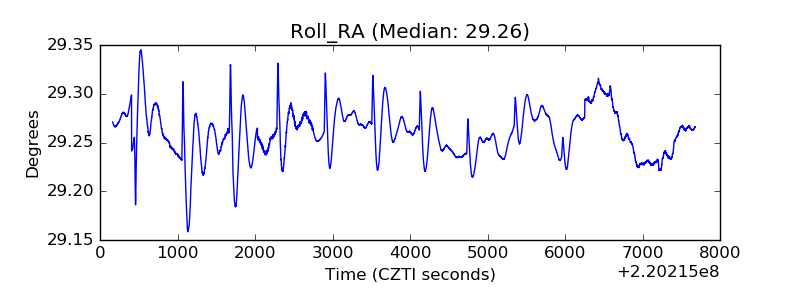 |
| Veto Counter | 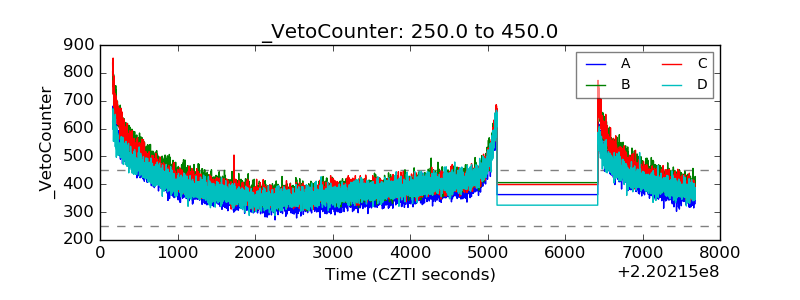 |