| Param | Original file | Final file |
|---|---|---|
| Filename | modeM0/AS1T01_145T01_9000000916_06702cztM0_level2.evt | modeM0/AS1T01_145T01_9000000916_06702cztM0_level2_quad_clean.evt |
| Size (bytes) | 445,878,720 | 79,545,600 |
| Size | 425.2 MB | 75.9 MB |
| Events in quadrant A | 2,009,086 | 559,713 |
| Events in quadrant B | 2,182,275 | 572,841 |
| Events in quadrant C | 1,946,385 | 554,974 |
| Events in quadrant D | 7,058,516 | 403,026 |
| Mode M0 | |||
|---|---|---|---|
| Quadrant | BADHDUFLAG | Total packets | Discarded packets |
| A | 0 | 9181 | 2 |
| B | 0 | 9641 | 1 |
| C | 0 | 9078 | 1 |
| D | 0 | 24052 | 1 |
| Mode M9 | |||
|---|---|---|---|
| Quadrant | BADHDUFLAG | Total packets | Discarded packets |
| A | 0 | 5 | 0 |
| B | 0 | 5 | 0 |
| C | 0 | 5 | 0 |
| D | 0 | 6 | 0 |
| Mode SS | |||
|---|---|---|---|
| Quadrant | BADHDUFLAG | Total packets | Discarded packets |
| A | 0 | 90 | 0 |
| B | 0 | 90 | 0 |
| C | 0 | 90 | 0 |
| D | 0 | 90 | 0 |
| Quadrant | Total seconds | Saturated seconds | Saturation percentage |
|---|---|---|---|
| A | 4517 | 35 | 0.774851% |
| B | 4517 | 45 | 0.996236% |
| C | 4517 | 6 | 0.132832% |
| D | 4517 | 1649 | 36.506531% |
Noise dominated data is calculated using 1-second bins in cleaned event files. If a bin has >2000 counts, and if more than 50% of those come from <1% of pixels, then it is considered to be noise-dominated and hence unusable.
| Quadrant | # 1 sec bins | Bins with >0 counts | Bins with >2000 counts | High rate bins dominated by noise | Noise dominated (total time) | Noise dominated (detector-on time) | Marked lightcurve |
|---|---|---|---|---|---|---|---|
| A | 4517 | 4517 | 0 | 0 | 0.00% | 0.00% | 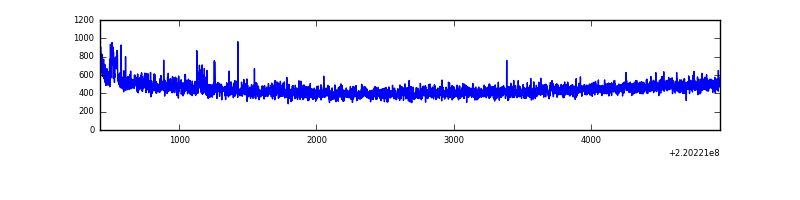 |
| B | 4517 | 4517 | 17 | 17 | 0.38% | 0.38% | 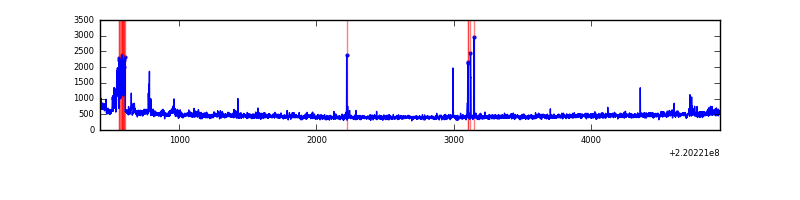 |
| C | 4517 | 4517 | 0 | 0 | 0.00% | 0.00% | 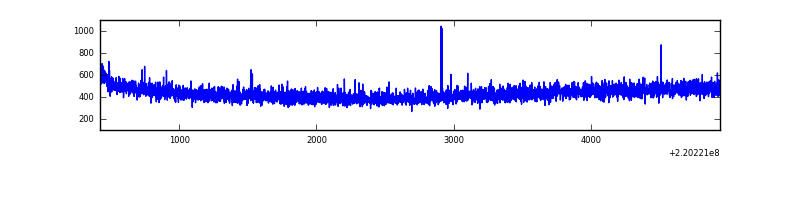 |
| D | 4517 | 4517 | 1353 | 1353 | 29.95% | 29.95% | 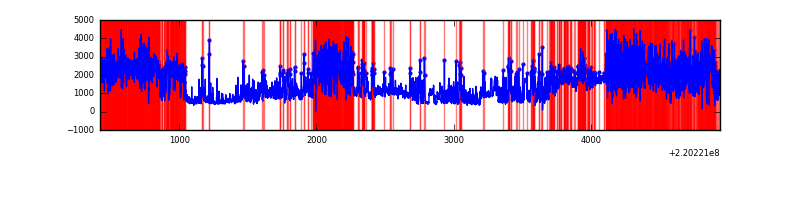 |
Top three noisy pixels from each quadrant. If the there are fewer than three noisy pixels in the level2.evt file, extra rows are filled as -1
| Pixel properties | Quadrant properties | ||||||
|---|---|---|---|---|---|---|---|
| Quadrant | DetID | PixID | Counts | Sigma | Mean | Median | Sigma |
| A | 8 | 15 | 43826 | 425.53 | 503 | 492 | 101.8 |
| A | 14 | 111 | 20337 | 194.87 | 503 | 492 | 101.8 |
| A | 13 | 14 | 5227 | 46.5 | 503 | 492 | 101.8 |
| B | 4 | 80 | 95587 | 980.63 | 512 | 500 | 97.0 |
| B | 0 | 219 | 27437 | 277.8 | 512 | 500 | 97.0 |
| B | 15 | 204 | 19470 | 195.63 | 512 | 500 | 97.0 |
| C | 8 | 128 | 9477 | 79.33 | 492 | 495 | 113.2 |
| C | 12 | 4 | 5754 | 46.45 | 492 | 495 | 113.2 |
| C | 8 | 112 | 5261 | 42.09 | 492 | 495 | 113.2 |
| D | 2 | 63 | 3057812 | 31447.49 | 394 | 382 | 97.2 |
| D | 2 | 33 | 2037972 | 20957.83 | 394 | 382 | 97.2 |
| D | 2 | 152 | 327830 | 3368.0 | 394 | 382 | 97.2 |
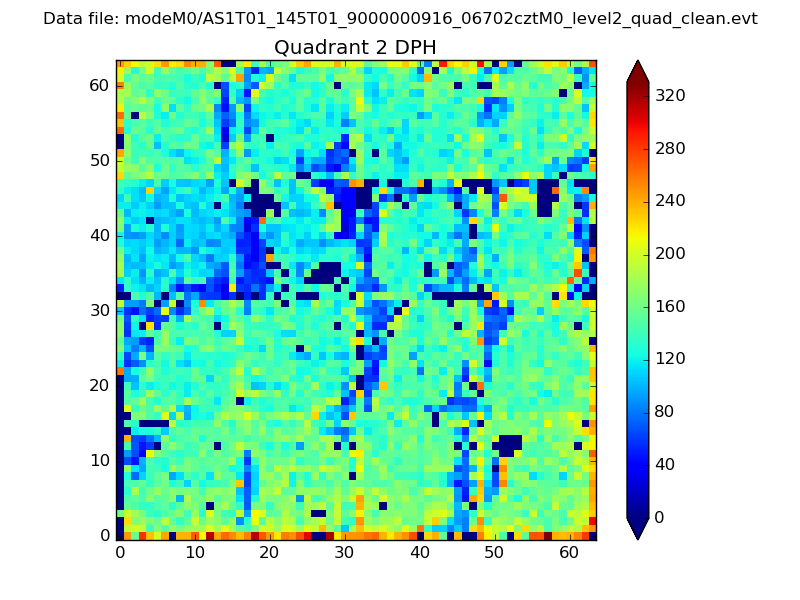
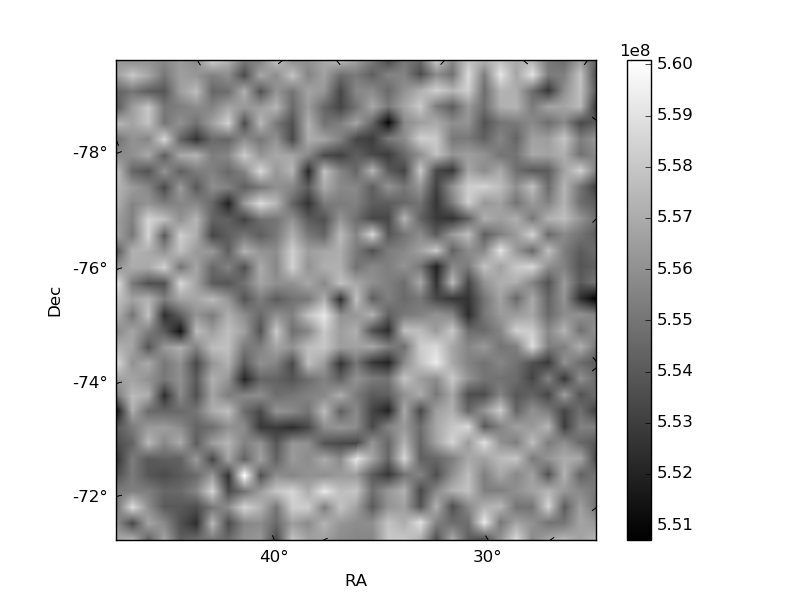
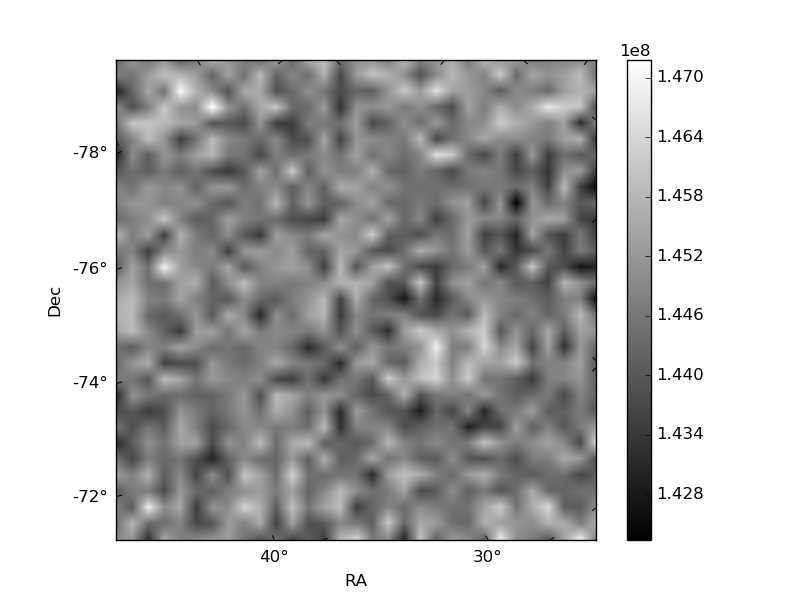
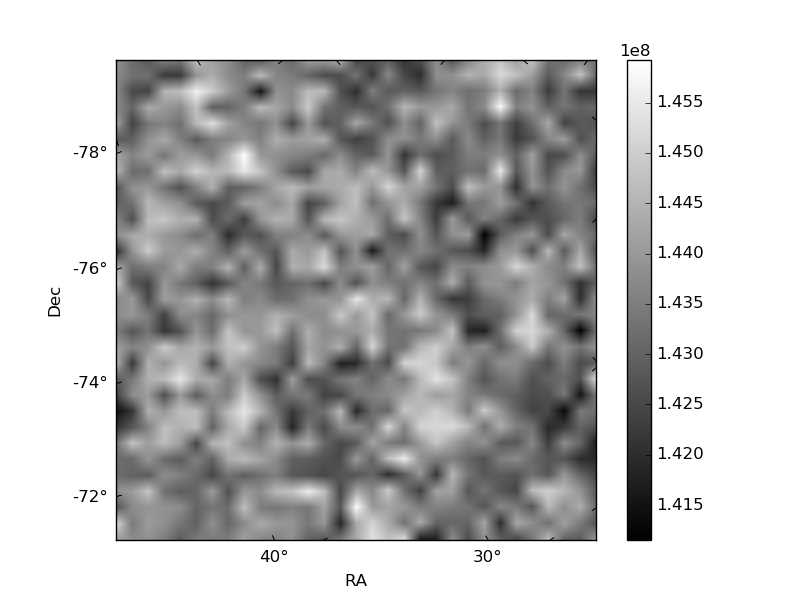
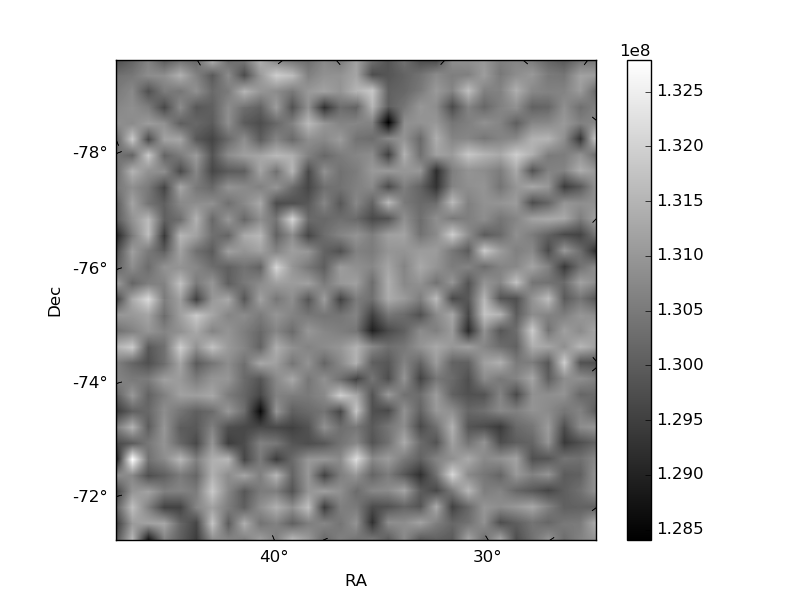
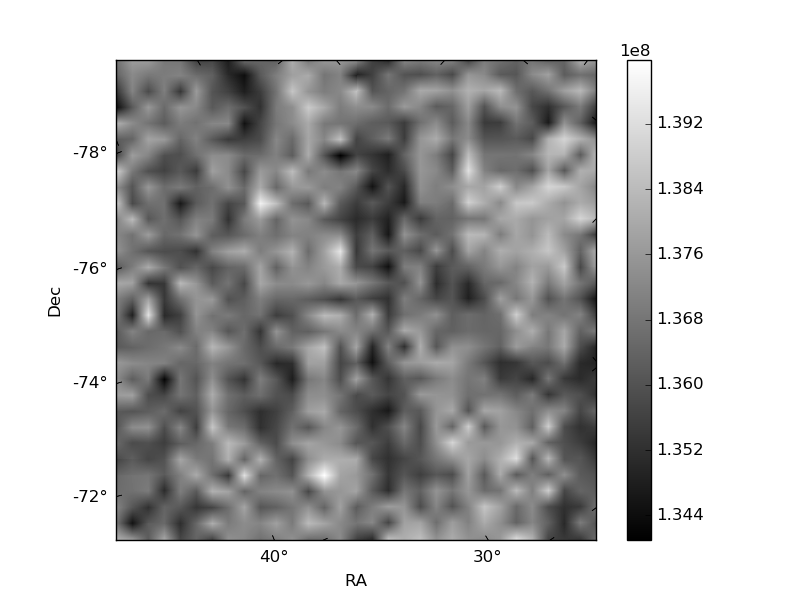
Histogram calculated using DETX and DETY for each event in the final _common_clean file
| Quadrant A | 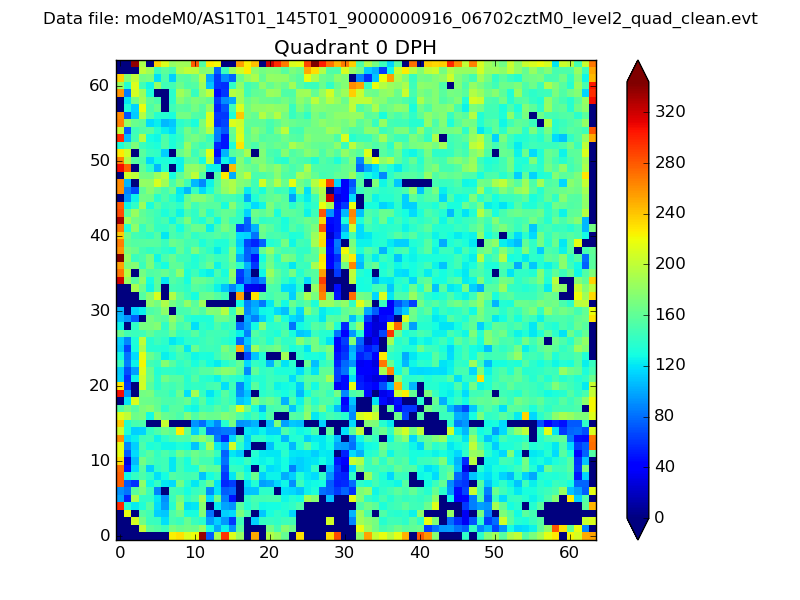 |
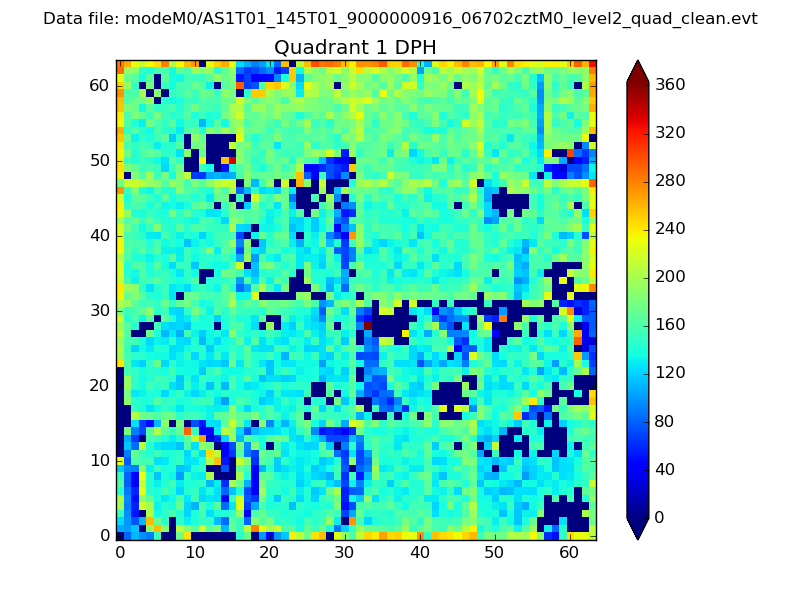 |
Quadrant B |
|---|---|---|---|
| Quadrant D | 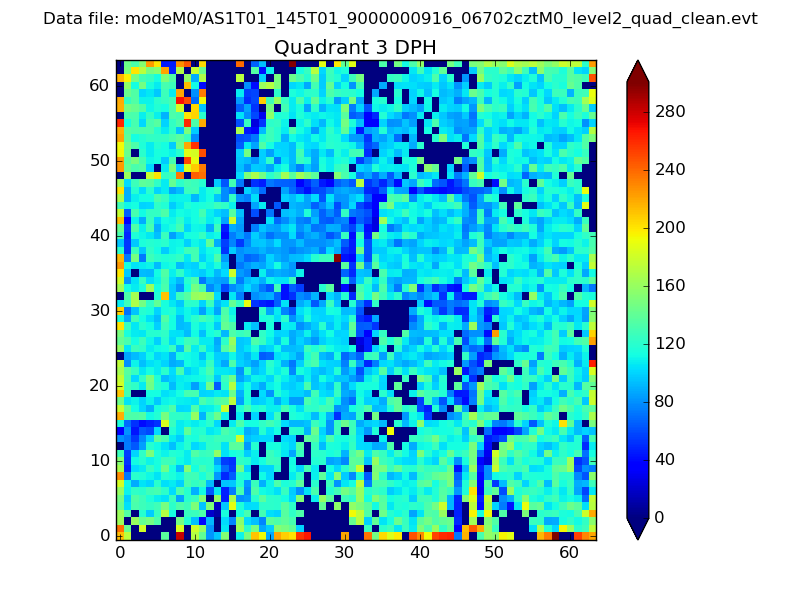 |
 |
Quadrant C |
| Plot type | Count rate plots | Images |
|---|---|---|
| Comparison with Poisson distribution Blue bars denote a histogram of data divided into 1 sec bins. Red curve is a Poisson curve with rate = median count rate of data. |
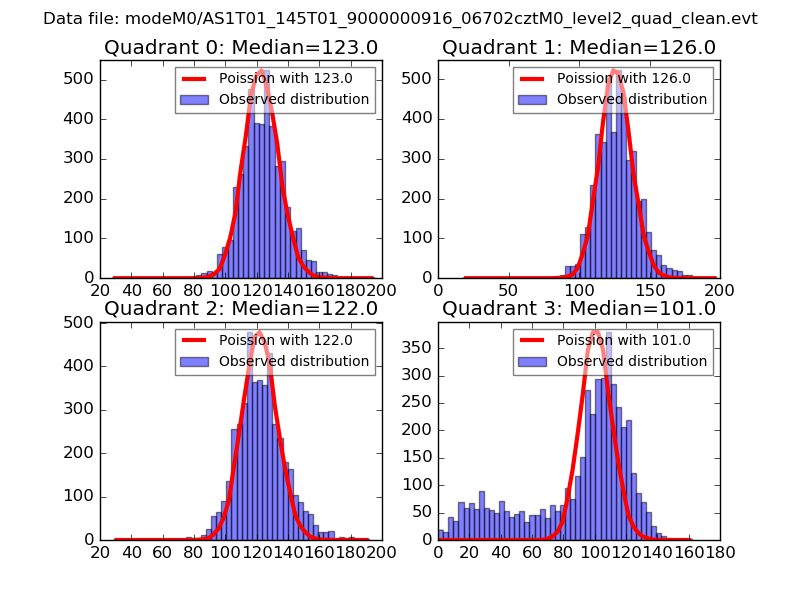 |
 |
| Quadrant-wise count rates Data is divided into 100 sec bins |
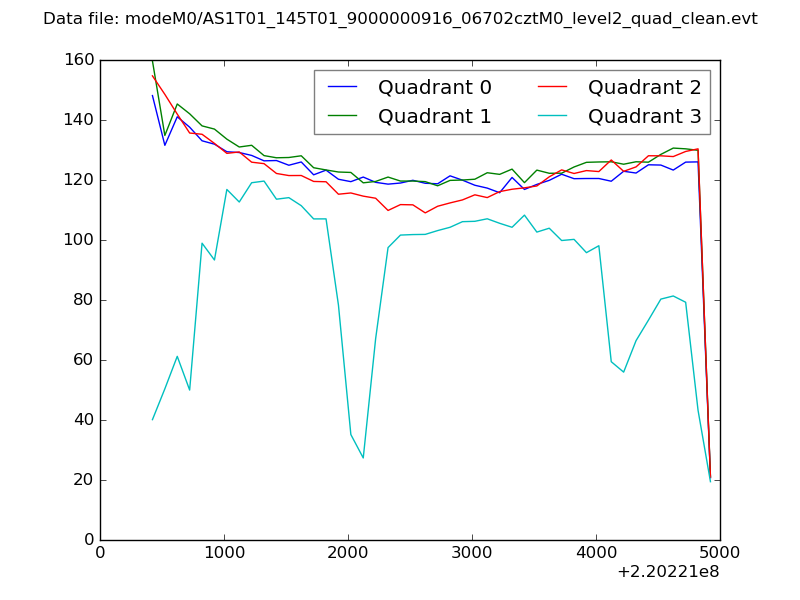 |
|
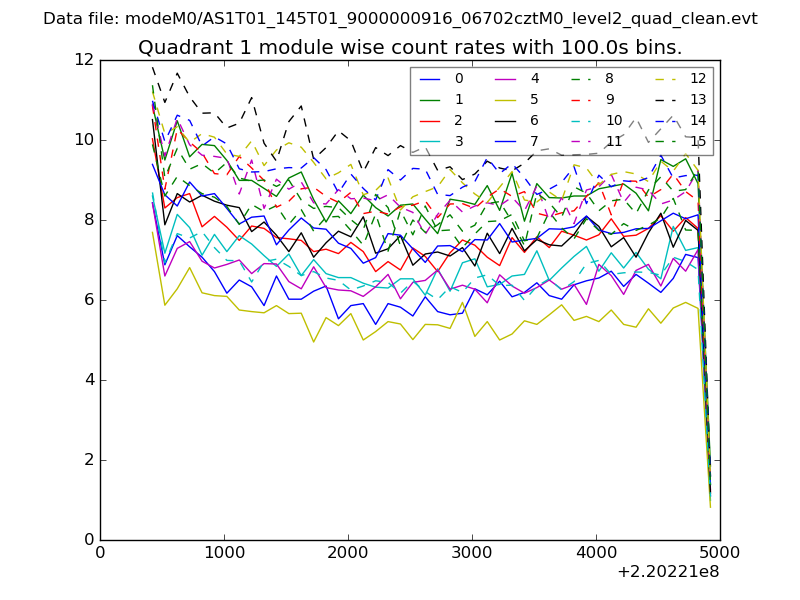
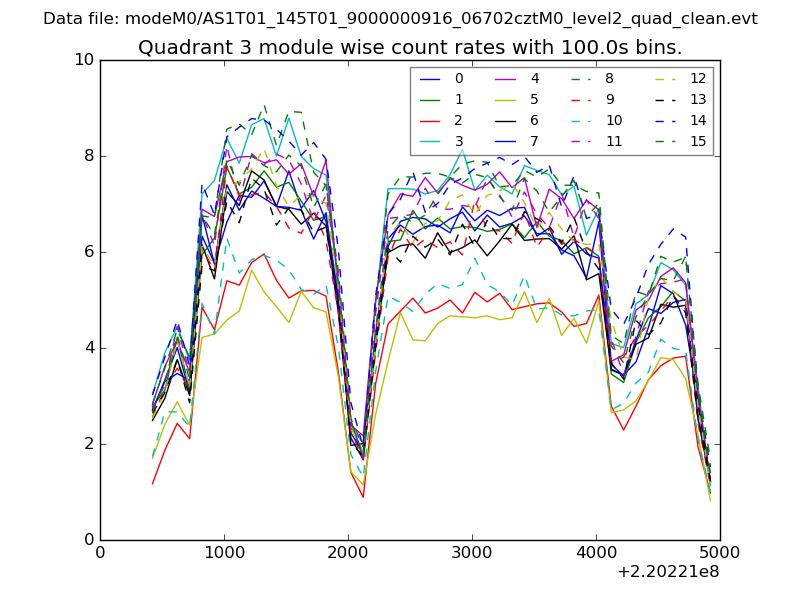
| Module-wise count rates for Quadrant A Data is divided into 100 sec bins |
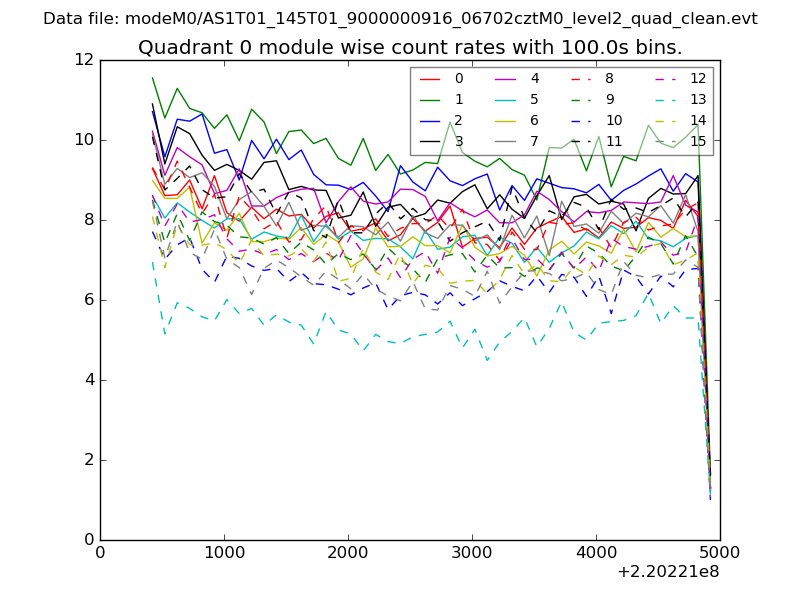 |
 |
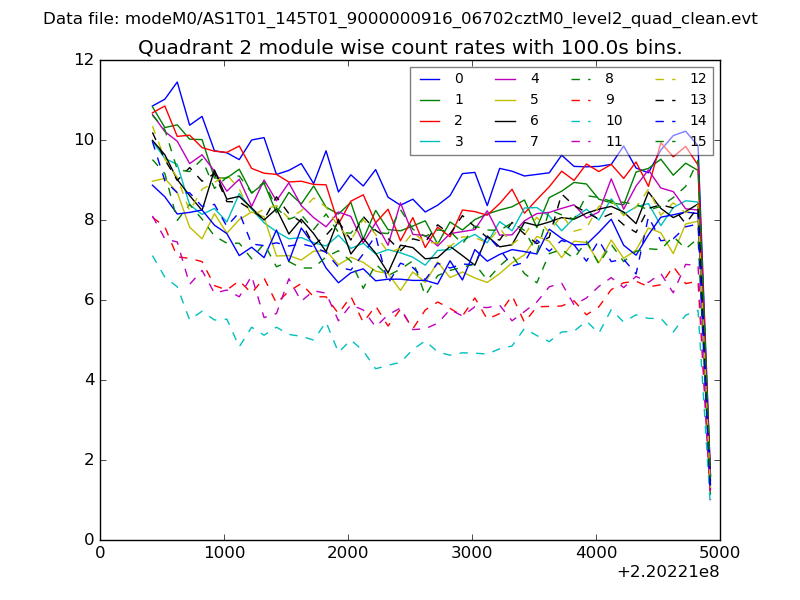
| Module-wise count rates for Quadrant B Data is divided into 100 sec bins |
 |
 |
| Module-wise count rates for Quadrant C Data is divided into 100 sec bins |
 |
 |
| Module-wise count rates for Quadrant D Data is divided into 100 sec bins |
 |
 |
| Parameter | Plot |
|---|---|
| CZT HV Monitor | 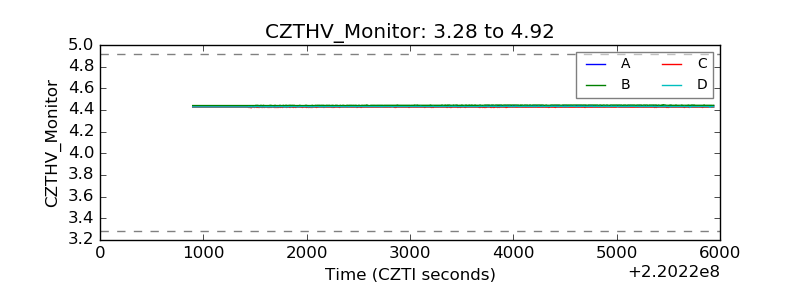 |
| D_VDD | 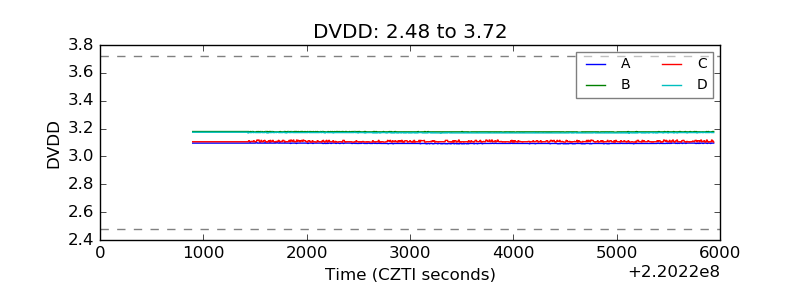 |
| Temperature 1 | 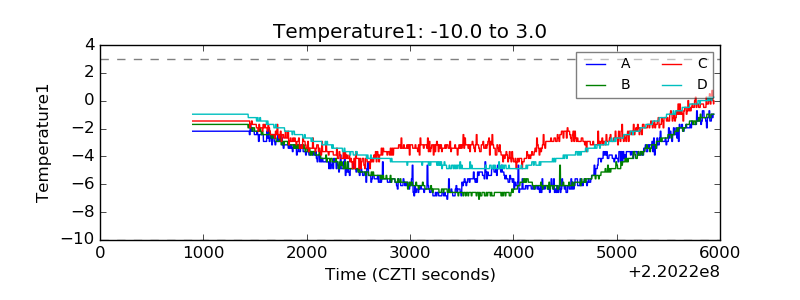 |
| Veto HV Monitor | 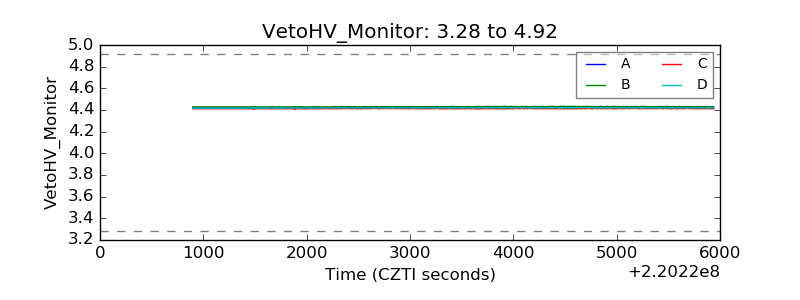 |
| Veto LLD | 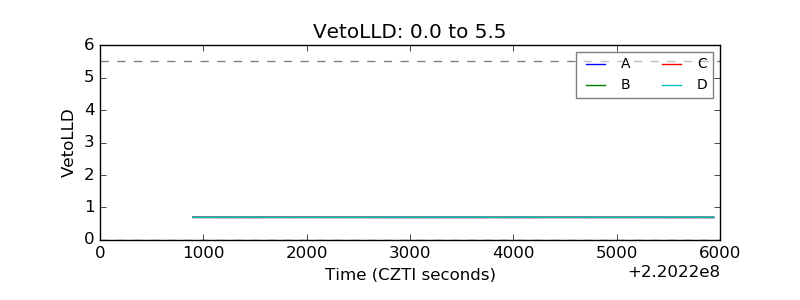 |
| Alpha Counter | 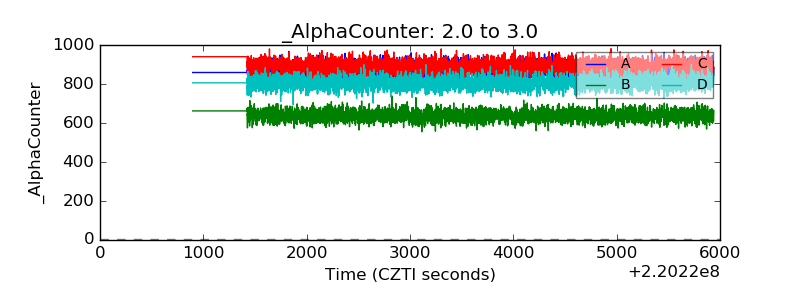 |
| _CPM_Rate | 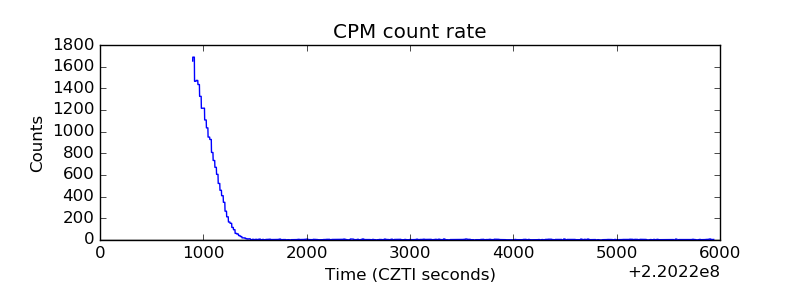 |
| CZT Counter | 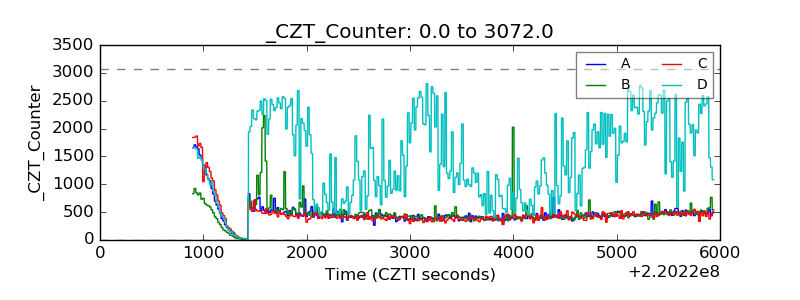 |
| +2.5 Volts monitor | 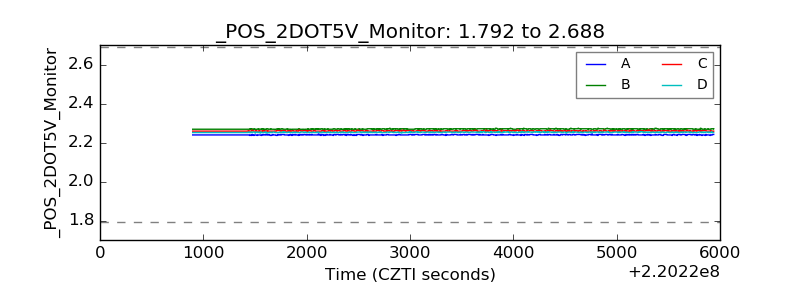 |
| +5 Volts monitor |  |
| _ROLL_ROT | 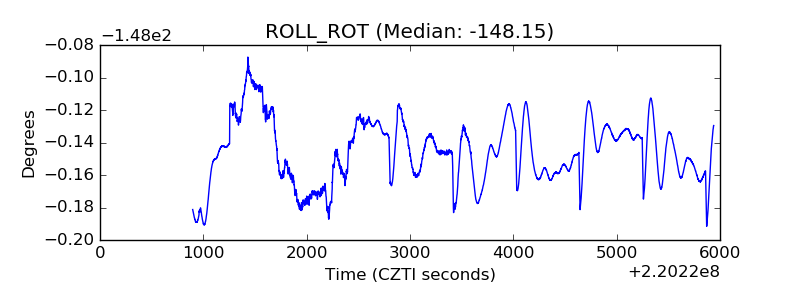 |
| _Roll_DEC | 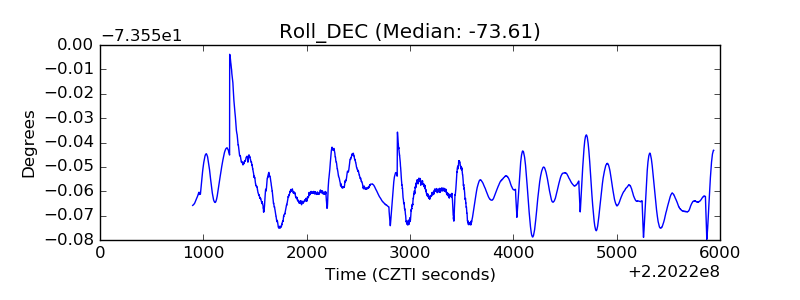 |
| _Roll_RA | 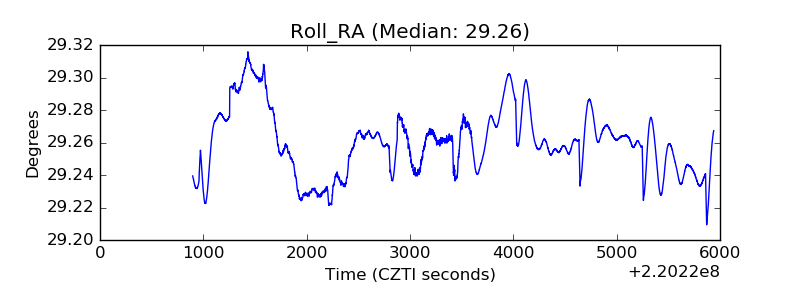 |
| Veto Counter | 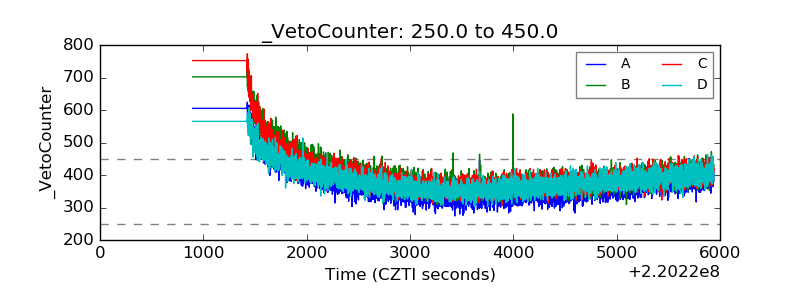 |