| Param | Original file | Final file |
|---|---|---|
| Filename | modeM0/AS1T01_145T01_9000000916_06703cztM0_level2.evt | modeM0/AS1T01_145T01_9000000916_06703cztM0_level2_quad_clean.evt |
| Size (bytes) | 78,710,400 | 13,872,960 |
| Size | 75.1 MB | 13.2 MB |
| Events in quadrant A | 397,264 | 95,834 |
| Events in quadrant B | 537,893 | 95,711 |
| Events in quadrant C | 379,977 | 97,679 |
| Events in quadrant D | 1,016,779 | 72,458 |
| Mode M0 | |||
|---|---|---|---|
| Quadrant | BADHDUFLAG | Total packets | Discarded packets |
| A | 0 | 1621 | 2 |
| B | 0 | 2083 | 2 |
| C | 0 | 1553 | 2 |
| D | 0 | 3523 | 2 |
| Mode M9 | |||
|---|---|---|---|
| Quadrant | BADHDUFLAG | Total packets | Discarded packets |
| A | 0 | 12 | 0 |
| B | 0 | 12 | 0 |
| C | 0 | 12 | 0 |
| D | 0 | 12 | 0 |
| Mode SS | |||
|---|---|---|---|
| Quadrant | BADHDUFLAG | Total packets | Discarded packets |
| A | 0 | 18 | 0 |
| B | 0 | 18 | 0 |
| C | 0 | 18 | 0 |
| D | 0 | 18 | 0 |
| Quadrant | Total seconds | Saturated seconds | Saturation percentage |
|---|---|---|---|
| A | 713 | 11 | 1.542777% |
| B | 713 | 75 | 10.518934% |
| C | 713 | 7 | 0.981767% |
| D | 713 | 279 | 39.130435% |
Noise dominated data is calculated using 1-second bins in cleaned event files. If a bin has >2000 counts, and if more than 50% of those come from <1% of pixels, then it is considered to be noise-dominated and hence unusable.
| Quadrant | # 1 sec bins | Bins with >0 counts | Bins with >2000 counts | High rate bins dominated by noise | Noise dominated (total time) | Noise dominated (detector-on time) | Marked lightcurve |
|---|---|---|---|---|---|---|---|
| A | 1988 | 715 | 0 | 0 | 0.00% | 0.00% | 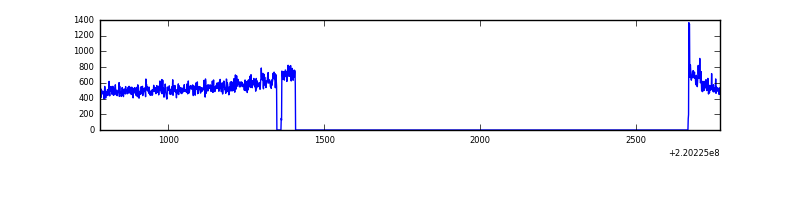 |
| B | 1988 | 715 | 9 | 9 | 0.45% | 1.26% | 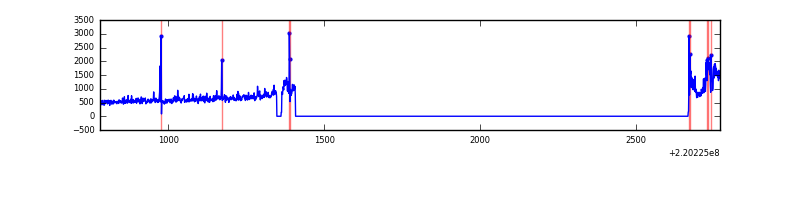 |
| C | 1988 | 715 | 0 | 0 | 0.00% | 0.00% | 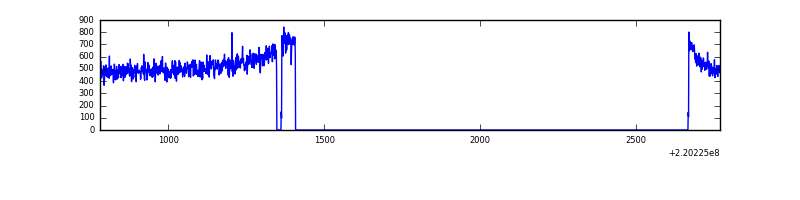 |
| D | 1988 | 715 | 160 | 160 | 8.05% | 22.38% | 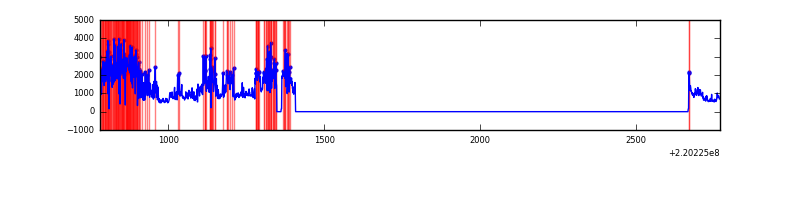 |
Top three noisy pixels from each quadrant. If the there are fewer than three noisy pixels in the level2.evt file, extra rows are filled as -1
| Pixel properties | Quadrant properties | ||||||
|---|---|---|---|---|---|---|---|
| Quadrant | DetID | PixID | Counts | Sigma | Mean | Median | Sigma |
| A | 8 | 15 | 5583 | 235.21 | 100 | 97 | 23.3 |
| A | 14 | 111 | 4448 | 186.55 | 100 | 97 | 23.3 |
| A | 0 | 226 | 966 | 37.26 | 100 | 97 | 23.3 |
| B | 4 | 80 | 62397 | 2983.88 | 98 | 96 | 20.9 |
| B | 0 | 214 | 25541 | 1218.68 | 98 | 96 | 20.9 |
| B | 0 | 228 | 18627 | 887.53 | 98 | 96 | 20.9 |
| C | 8 | 128 | 1102 | 41.38 | 96 | 96 | 24.3 |
| C | 7 | 159 | 927 | 34.18 | 96 | 96 | 24.3 |
| C | 8 | 112 | 909 | 33.44 | 96 | 96 | 24.3 |
| D | 2 | 33 | 435362 | 20418.33 | 79 | 75 | 21.3 |
| D | 2 | 63 | 205157 | 9619.93 | 79 | 75 | 21.3 |
| D | 2 | 152 | 53192 | 2491.6 | 79 | 75 | 21.3 |
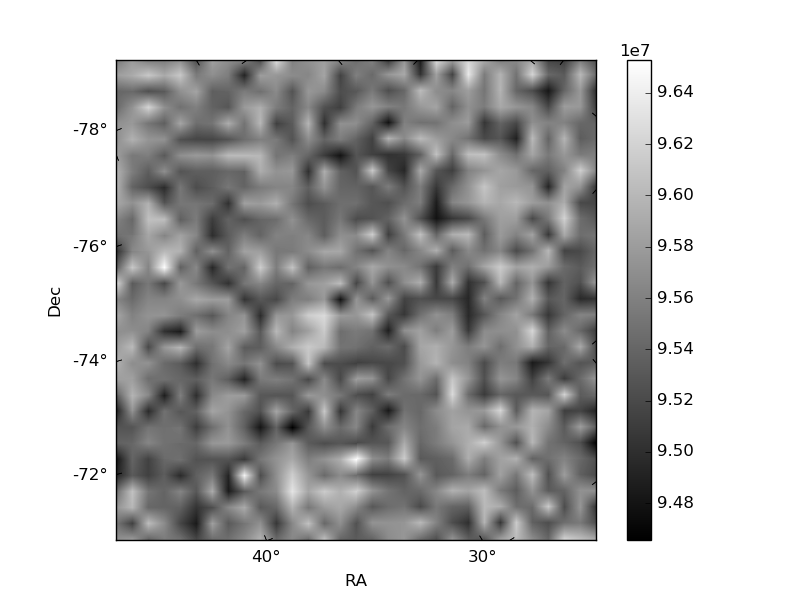
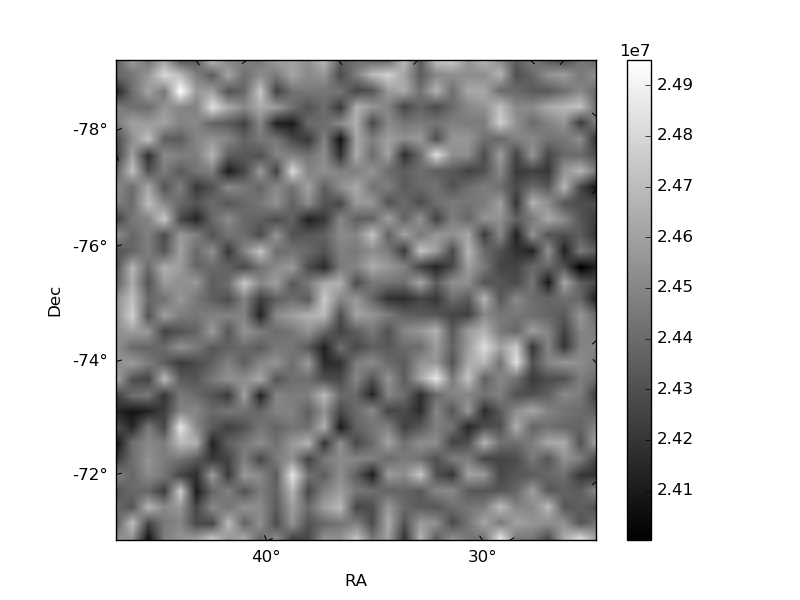
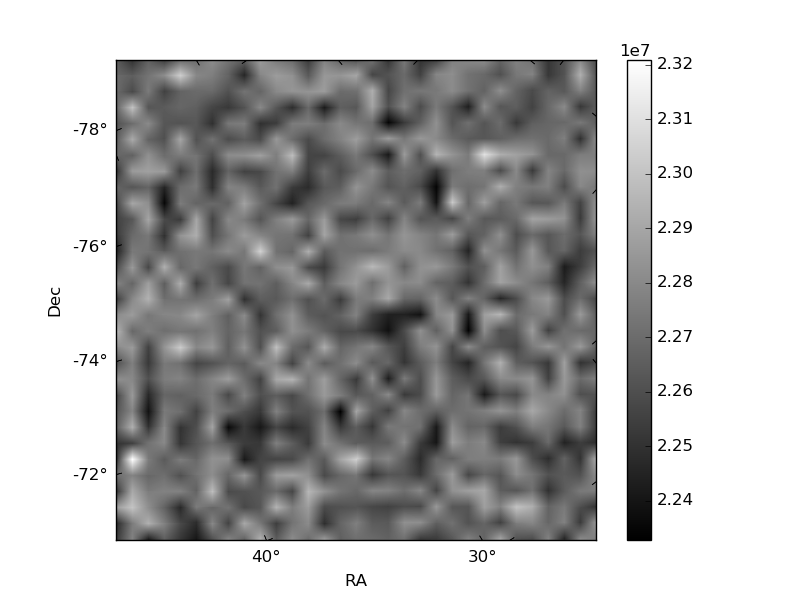
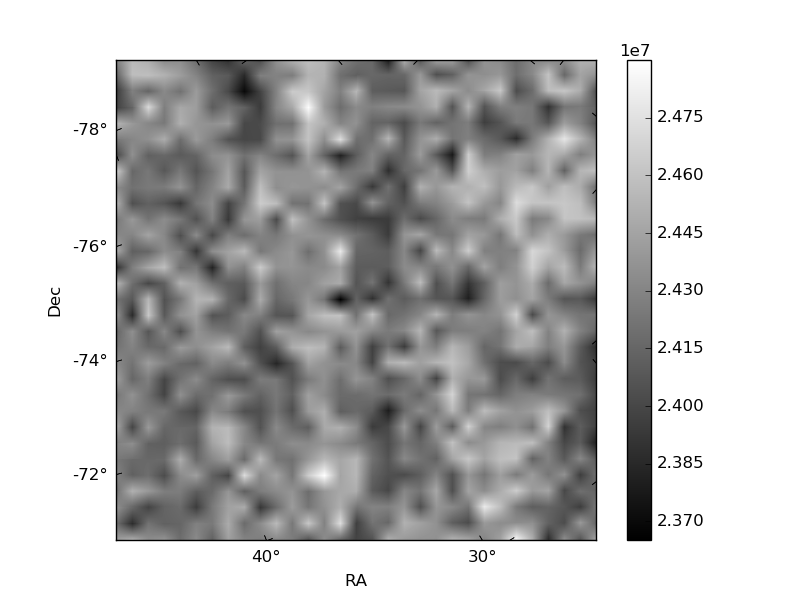
Histogram calculated using DETX and DETY for each event in the final _common_clean file
| Quadrant A | 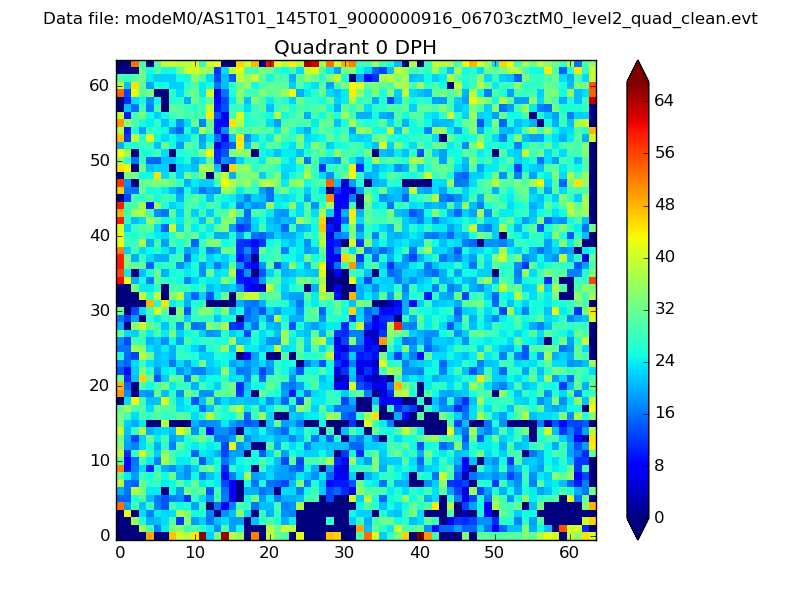 |
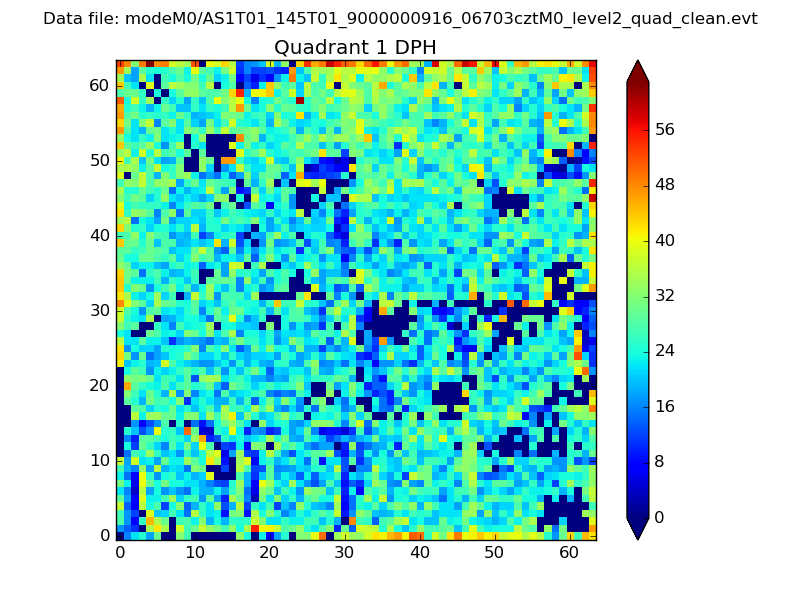 |
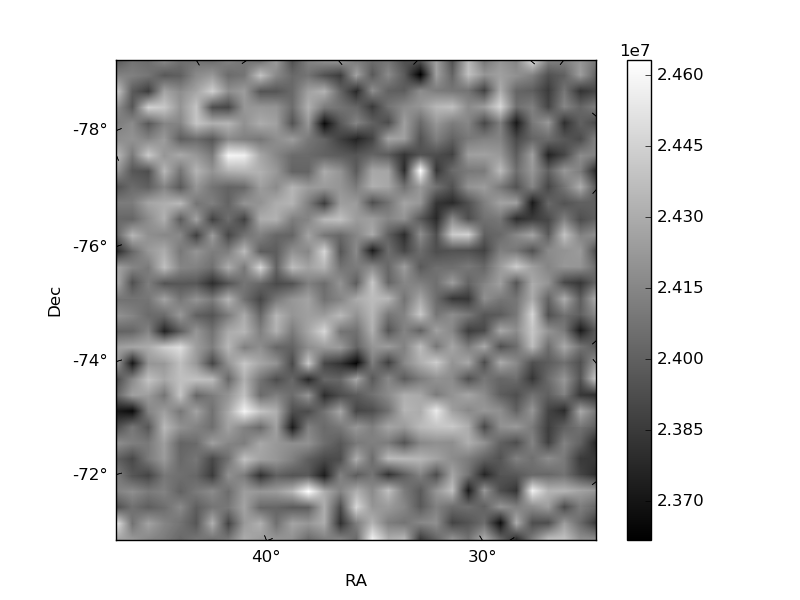
Quadrant B |
|---|---|---|---|
| Quadrant D | 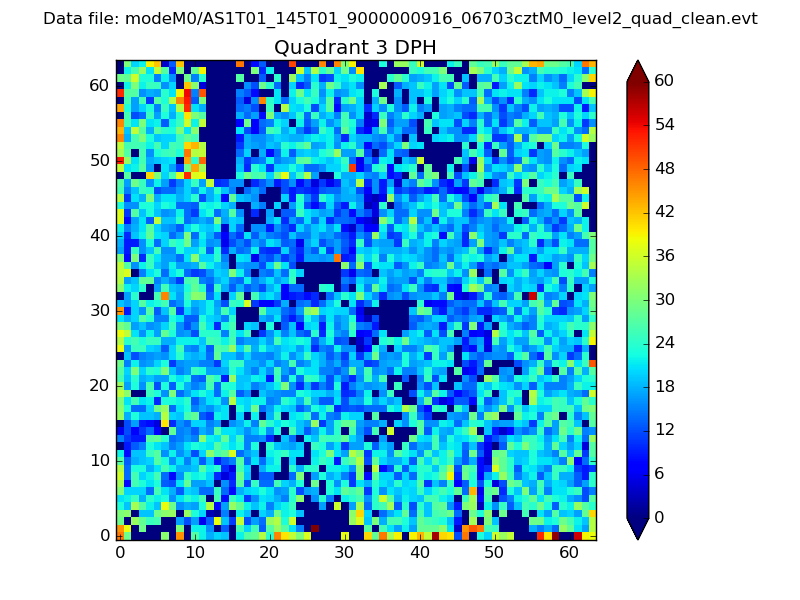 |
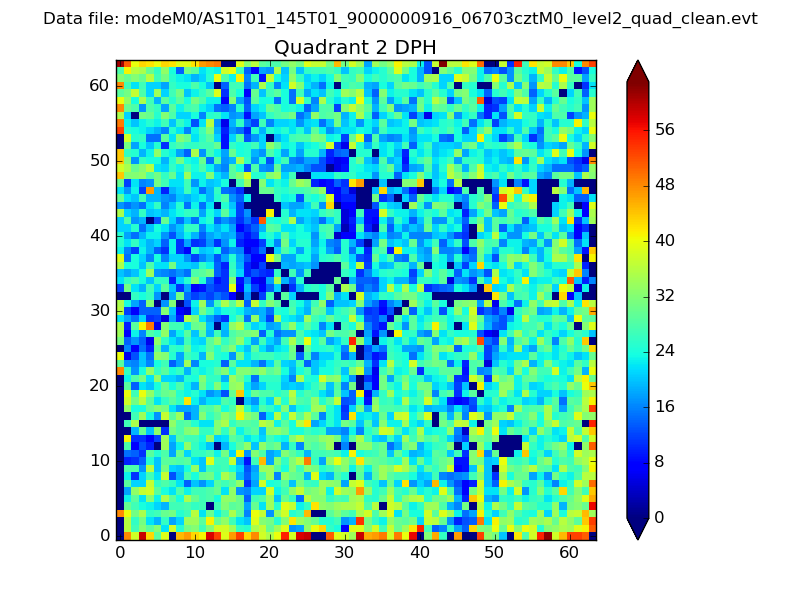 |
Quadrant C |
| Plot type | Count rate plots | Images |
|---|---|---|
| Comparison with Poisson distribution Blue bars denote a histogram of data divided into 1 sec bins. Red curve is a Poisson curve with rate = median count rate of data. |
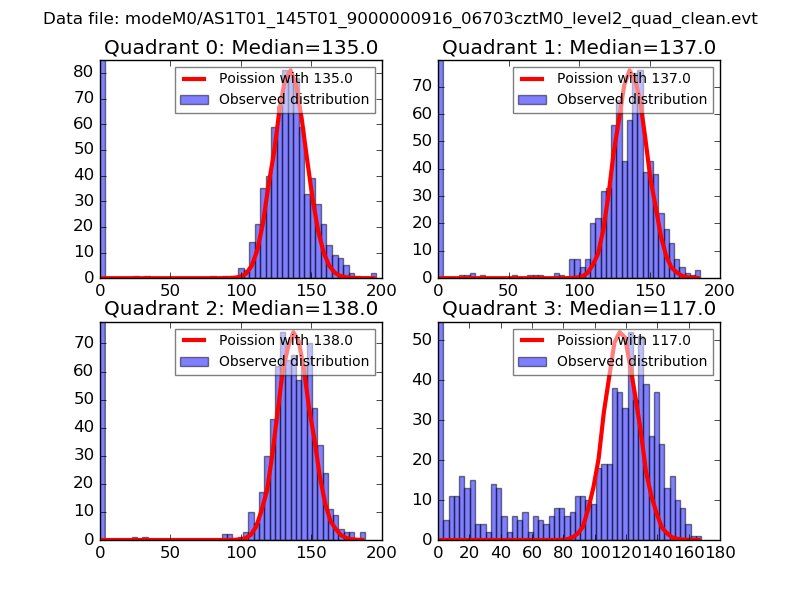 |
 |
| Quadrant-wise count rates Data is divided into 100 sec bins |
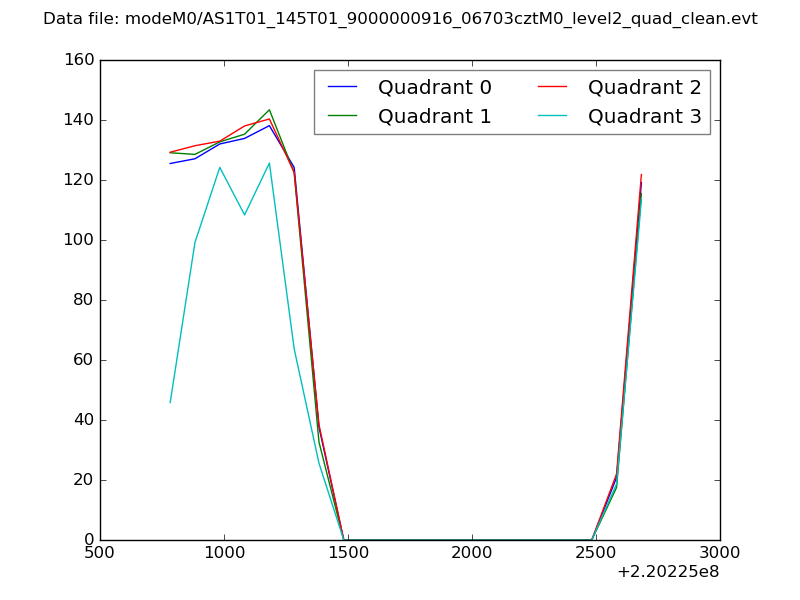 |
|
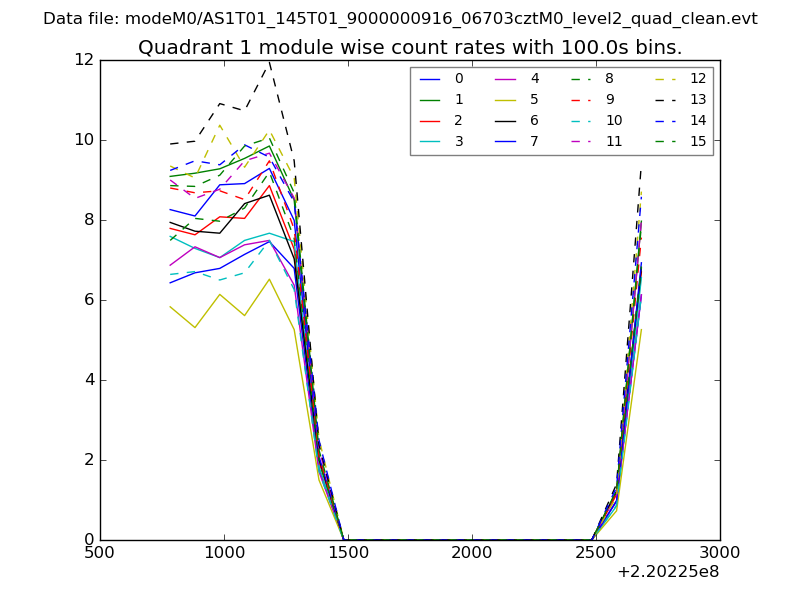
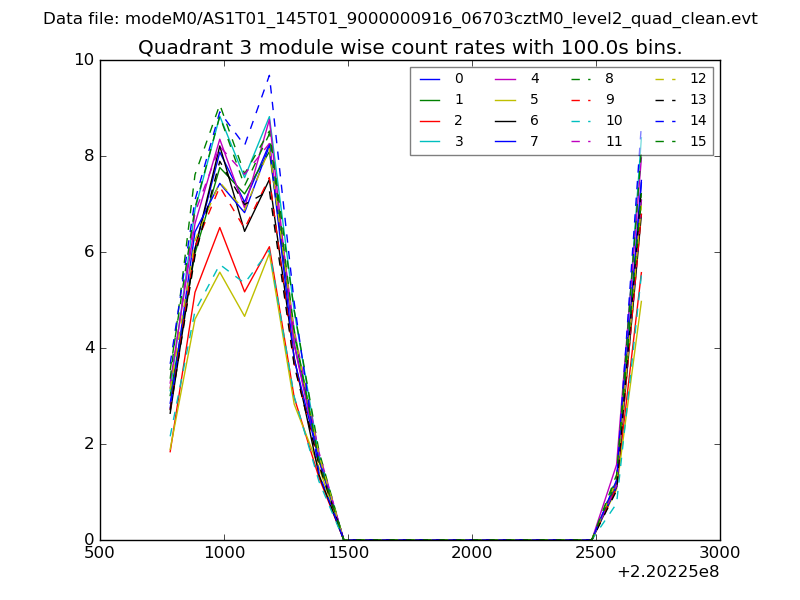
| Module-wise count rates for Quadrant A Data is divided into 100 sec bins |
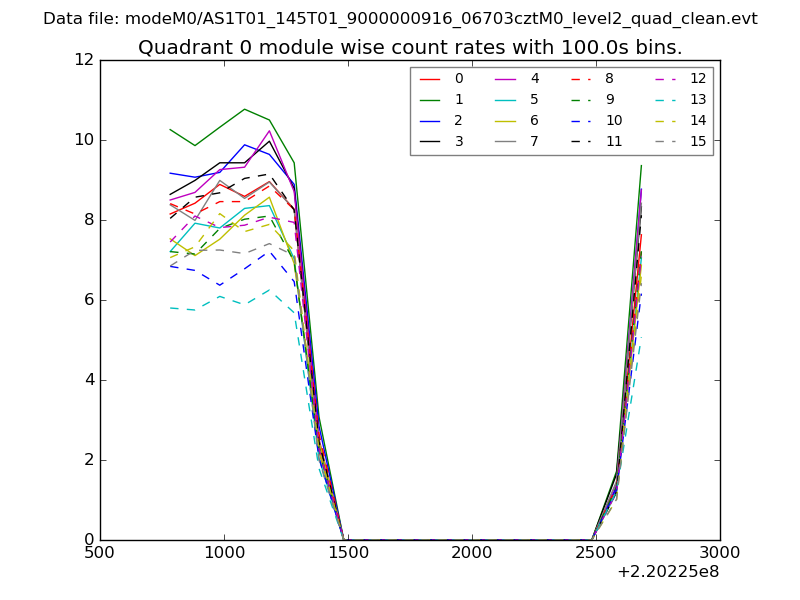 |
 |
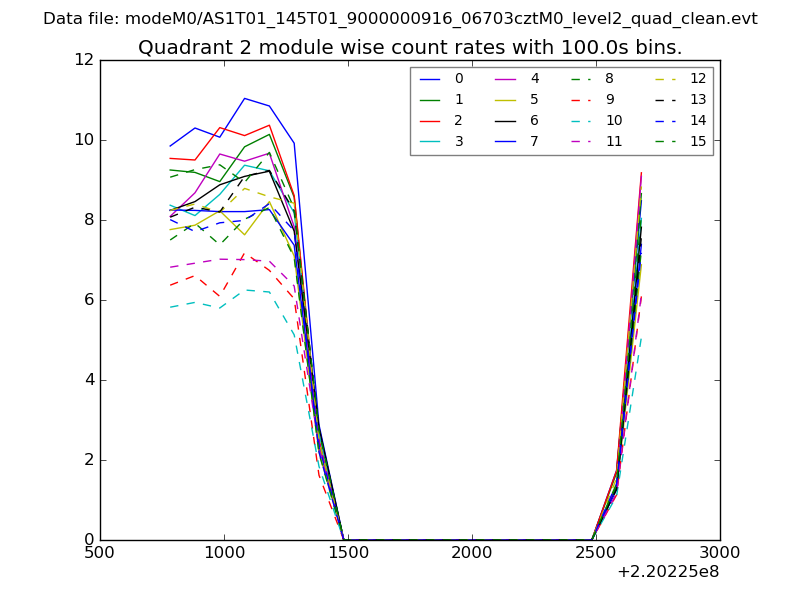
| Module-wise count rates for Quadrant B Data is divided into 100 sec bins |
 |
 |
| Module-wise count rates for Quadrant C Data is divided into 100 sec bins |
 |
 |
| Module-wise count rates for Quadrant D Data is divided into 100 sec bins |
 |
 |
| Parameter | Plot |
|---|---|
| CZT HV Monitor | 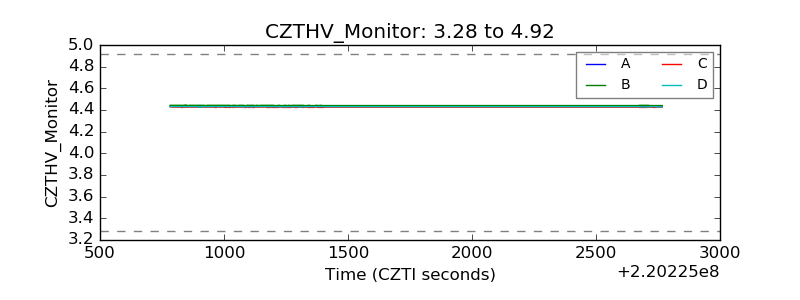 |
| D_VDD | 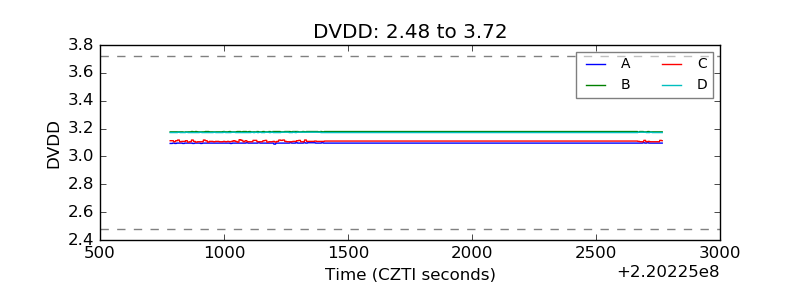 |
| Temperature 1 | 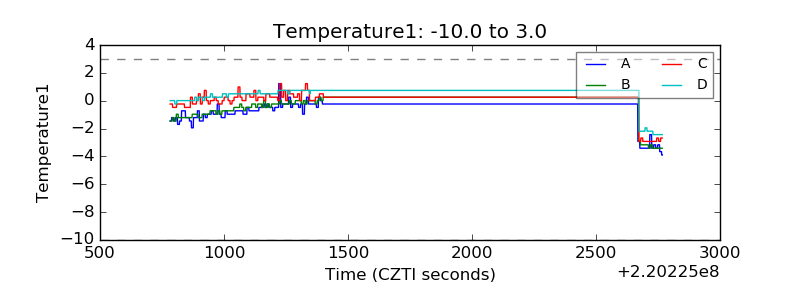 |
| Veto HV Monitor | 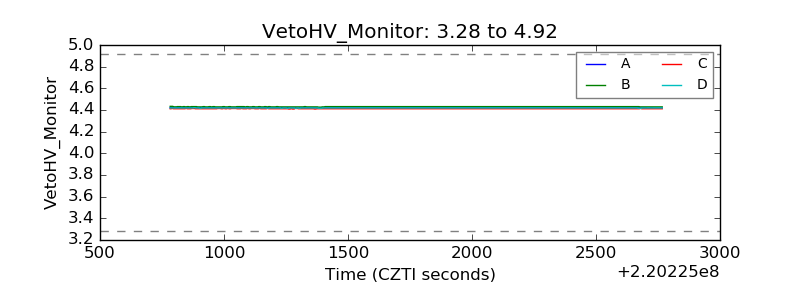 |
| Veto LLD | 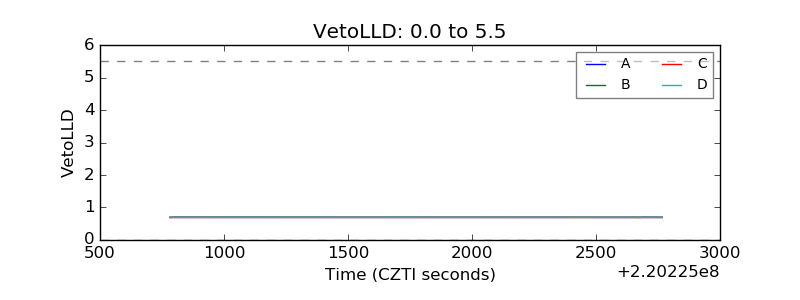 |
| Alpha Counter | 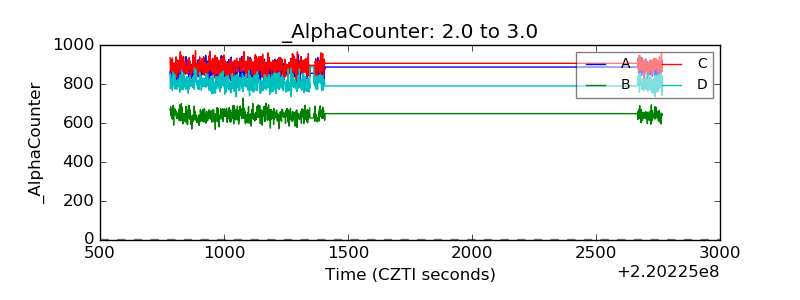 |
| _CPM_Rate | 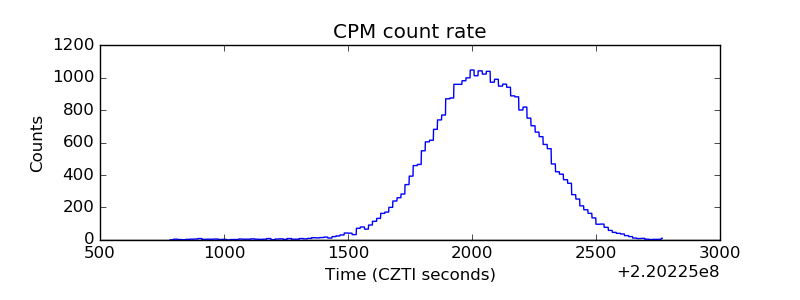 |
| CZT Counter | 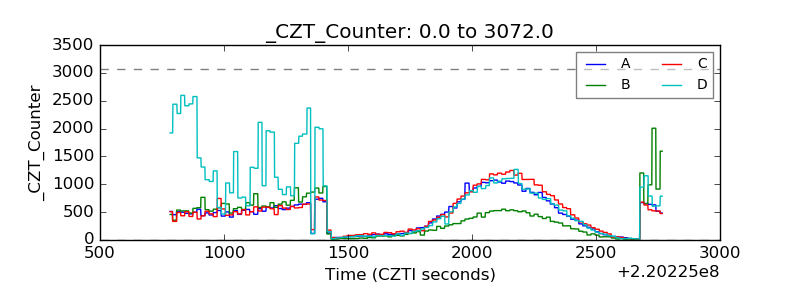 |
| +2.5 Volts monitor |  |
| +5 Volts monitor |  |
| _ROLL_ROT | 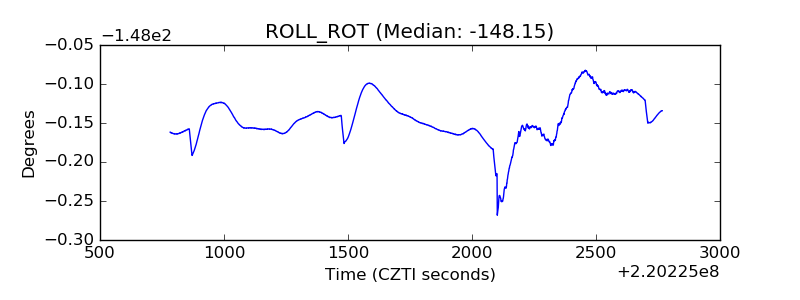 |
| _Roll_DEC | 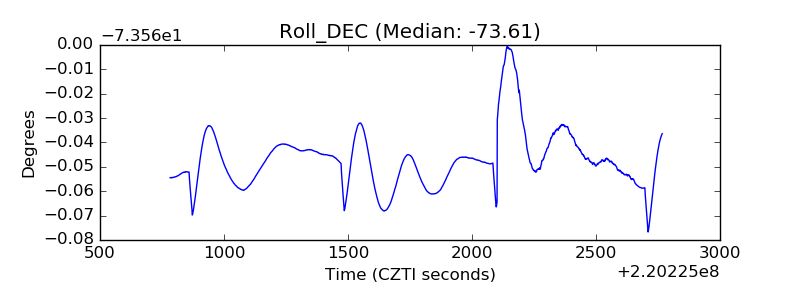 |
| _Roll_RA | 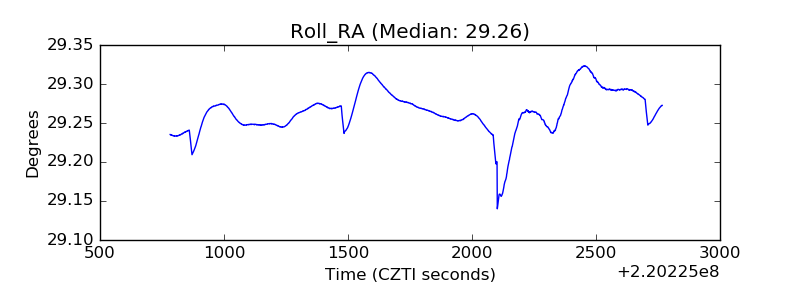 |
| Veto Counter | 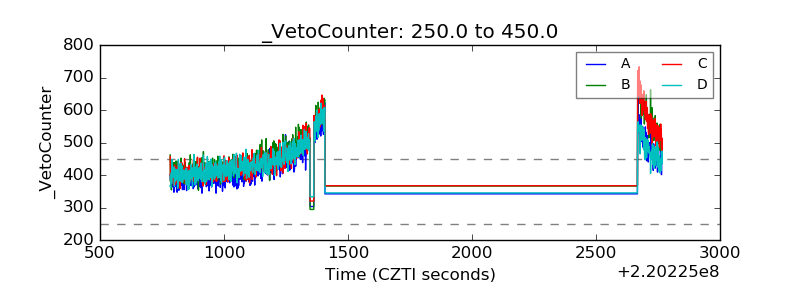 |