| Param | Original file | Final file |
|---|---|---|
| Filename | modeM0/AS1G06_135T02_9000000918cztM0_level2.fits | modeM0/AS1G06_135T02_9000000918cztM0_level2_quad_clean.evt |
| Size (bytes) | 228,127,680 | 212,339,520 |
| Size | 217.6 MB | 202.5 MB |
| Events in quadrant A | 1,304,256 | 1,177,609 |
| Events in quadrant B | 1,345,654 | 1,269,854 |
| Events in quadrant C | 1,379,040 | 1,218,641 |
| Events in quadrant D | 1,056,898 | 943,820 |
| Mode SS | |||
|---|---|---|---|
| Quadrant | BADHDUFLAG | Total packets | Discarded packets |
| A | 0 | 540 | 0 |
| B | 0 | 540 | 0 |
| C | 0 | 540 | 0 |
| D | 0 | 540 | 0 |
| Mode M9 | |||
|---|---|---|---|
| Quadrant | BADHDUFLAG | Total packets | Discarded packets |
| A | 0 | 21 | 0 |
| B | 0 | 21 | 0 |
| C | 0 | 21 | 0 |
| D | 0 | 21 | 0 |
| Mode M0 | |||
|---|---|---|---|
| Quadrant | BADHDUFLAG | Total packets | Discarded packets |
| A | 0 | 70961 | 0 |
| B | 0 | 55823 | 0 |
| C | 0 | 54277 | 0 |
| D | 0 | 88217 | 0 |
| Quadrant | Total seconds | Saturated seconds | Saturation percentage |
|---|---|---|---|
| A | 26458 | 2396 | 9.055862% |
| B | 26458 | 456 | 1.723486% |
| C | 26458 | 205 | 0.774813% |
| D | 26458 | 4597 | 17.374707% |
Noise dominated data is calculated using 1-second bins in cleaned event files. If a bin has >2000 counts, and if more than 50% of those come from <1% of pixels, then it is considered to be noise-dominated and hence unusable.
| Quadrant | # 1 sec bins | Bins with >0 counts | Bins with >2000 counts | High rate bins dominated by noise | Noise dominated (total time) | Noise dominated (detector-on time) | Marked lightcurve |
|---|---|---|---|---|---|---|---|
| A | 28568 | 26154 | 0 | 0 | 0.00% | 0.00% | 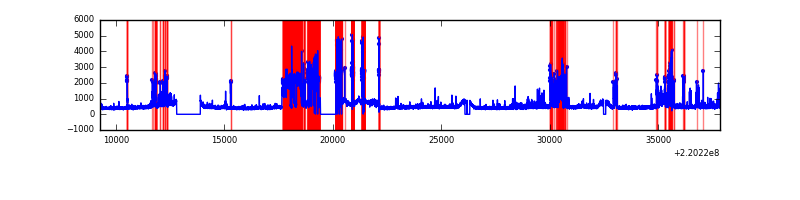 |
| B | 28568 | 26457 | 0 | 0 | 0.00% | 0.00% | 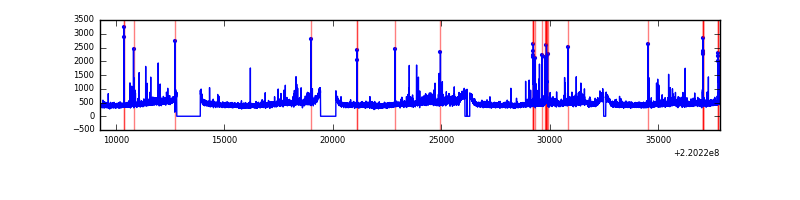 |
| C | 28568 | 26458 | 0 | 0 | 0.00% | 0.00% |  |
| D | 28568 | 26290 | 0 | 0 | 0.00% | 0.00% |  |
Top three noisy pixels from each quadrant. If the there are fewer than three noisy pixels in the level2.evt file, extra rows are filled as -1
| Pixel properties | Quadrant properties | ||||||
|---|---|---|---|---|---|---|---|
| Quadrant | DetID | PixID | Counts | Sigma | Mean | Median | Sigma |
| A | 14 | 188 | 1299 | 11.27 | 338 | 318 | 87.1 |
| A | 0 | 29 | 1259 | 10.81 | 338 | 318 | 87.1 |
| A | 14 | 204 | 1161 | 9.68 | 338 | 318 | 87.1 |
| B | 2 | 9 | 1168 | 11.1 | 355 | 337 | 74.9 |
| B | 12 | 226 | 987 | 8.68 | 355 | 337 | 74.9 |
| B | 5 | 128 | 939 | 8.04 | 355 | 337 | 74.9 |
| C | 1 | 80 | 1063 | 7.47 | 363 | 336 | 97.3 |
| C | 1 | 81 | 1024 | 7.07 | 363 | 336 | 97.3 |
| C | 12 | 241 | 997 | 6.79 | 363 | 336 | 97.3 |
| D | 7 | 5 | 822 | 6.55 | 302 | 274 | 83.6 |
| D | 3 | 14 | 814 | 6.46 | 302 | 274 | 83.6 |
| D | 6 | 231 | 806 | 6.36 | 302 | 274 | 83.6 |
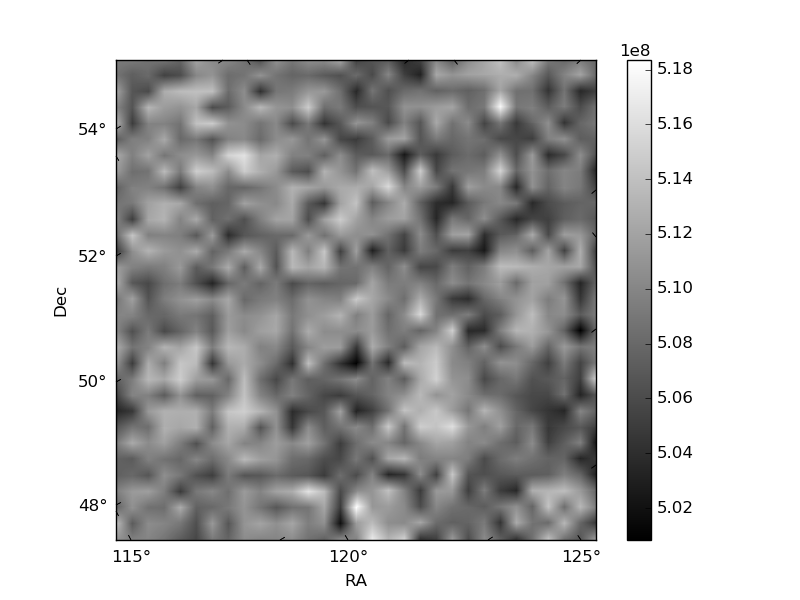
Histogram calculated using DETX and DETY for each event in the final _common_clean file
| Quadrant A | 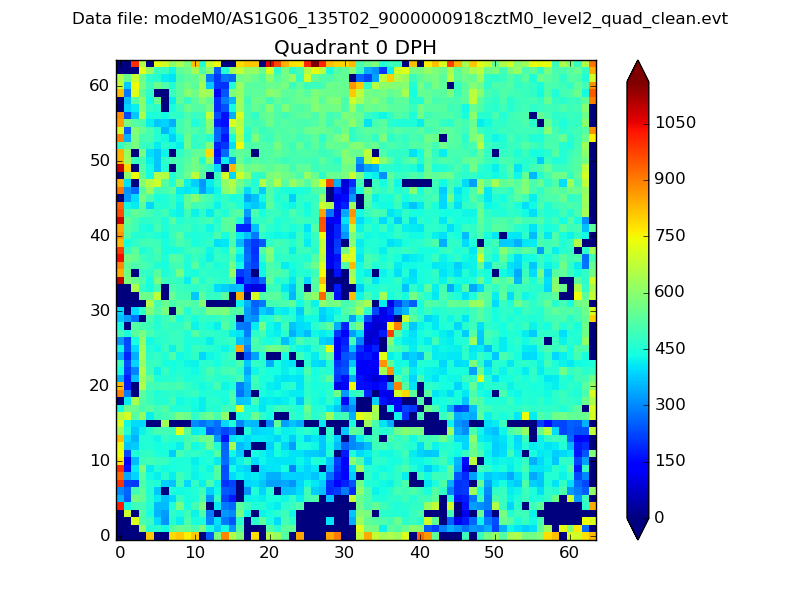 |
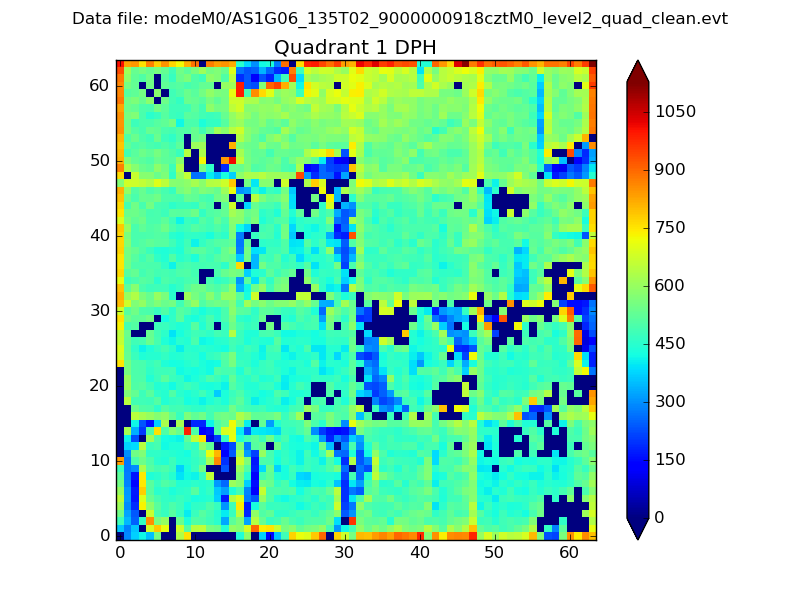 |
Quadrant B |
|---|---|---|---|
| Quadrant D |  |
 |
Quadrant C |
| Plot type | Count rate plots | Images |
|---|---|---|
| Comparison with Poisson distribution Blue bars denote a histogram of data divided into 1 sec bins. Red curve is a Poisson curve with rate = median count rate of data. |
 |
 |
| Quadrant-wise count rates Data is divided into 100 sec bins |
 |
|
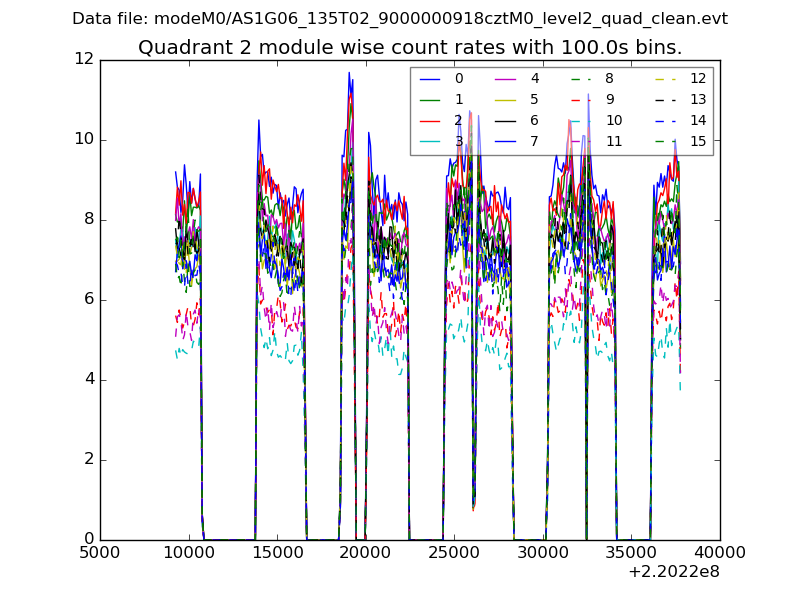
| Module-wise count rates for Quadrant A Data is divided into 100 sec bins |
 |
 |
| Module-wise count rates for Quadrant B Data is divided into 100 sec bins |
 |
 |
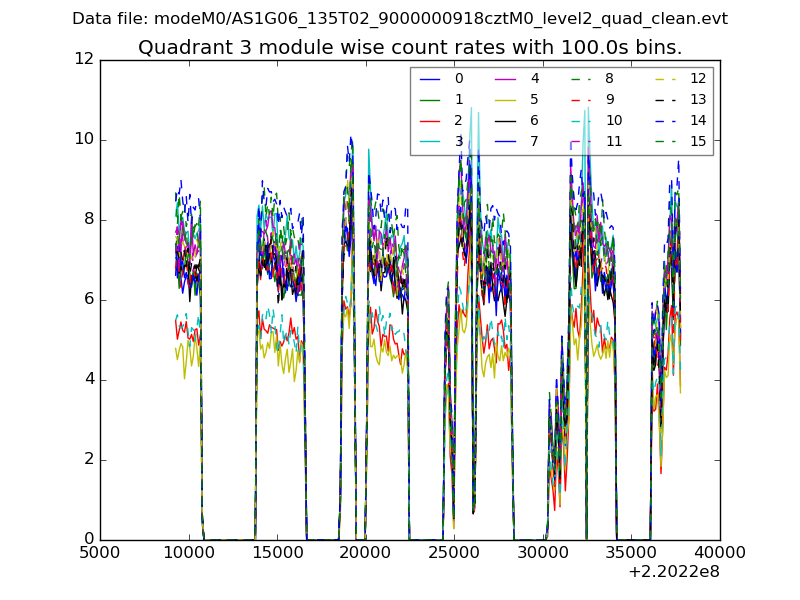
| Module-wise count rates for Quadrant C Data is divided into 100 sec bins |
 |
 |
| Module-wise count rates for Quadrant D Data is divided into 100 sec bins |
 |
 |
| Parameter | Plot |
|---|---|
| CZT HV Monitor | 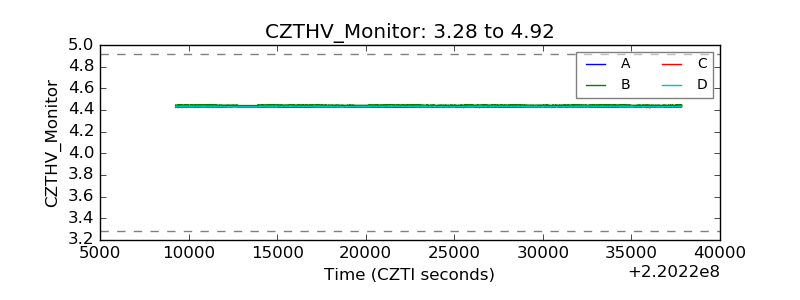 |
| D_VDD | 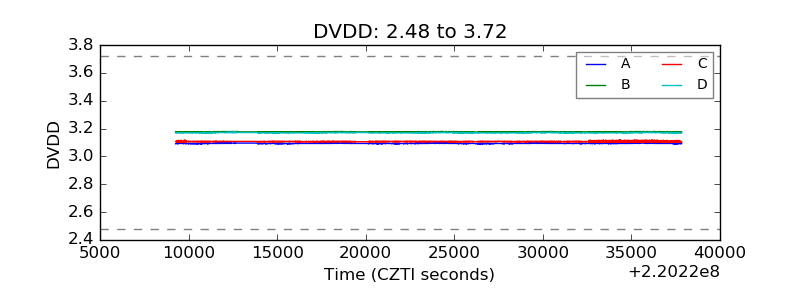 |
| Temperature 1 | 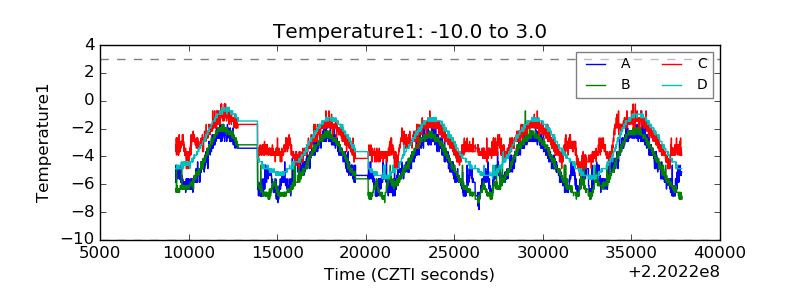 |
| Veto HV Monitor |  |
| Veto LLD |  |
| Alpha Counter |  |
| _CPM_Rate |  |
| CZT Counter |  |
| +2.5 Volts monitor |  |
| +5 Volts monitor | 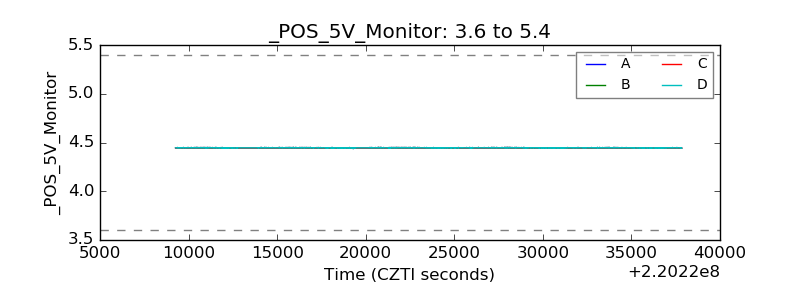 |
| _ROLL_ROT |  |
| _Roll_DEC | 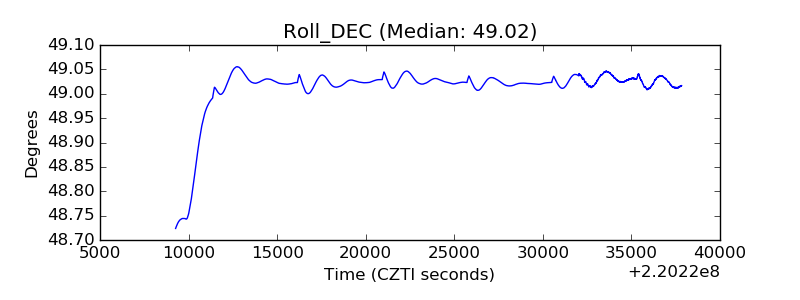 |
| _Roll_RA |  |
| Veto Counter |  |