| Param | Original file | Final file |
|---|---|---|
| Filename | modeM0/AS1G06_135T02_9000000918_06703cztM0_level2.evt | modeM0/AS1G06_135T02_9000000918_06703cztM0_level2_quad_clean.evt |
| Size (bytes) | 360,731,520 | 55,676,160 |
| Size | 344.0 MB | 53.1 MB |
| Events in quadrant A | 2,569,354 | 337,440 |
| Events in quadrant B | 2,309,810 | 342,312 |
| Events in quadrant C | 2,123,194 | 337,373 |
| Events in quadrant D | 3,586,442 | 322,699 |
| Mode SS | |||
|---|---|---|---|
| Quadrant | BADHDUFLAG | Total packets | Discarded packets |
| A | 0 | 102 | 0 |
| B | 0 | 102 | 0 |
| C | 0 | 102 | 0 |
| D | 0 | 102 | 0 |
| Mode M9 | |||
|---|---|---|---|
| Quadrant | BADHDUFLAG | Total packets | Discarded packets |
| A | 0 | 10 | 0 |
| B | 0 | 10 | 0 |
| C | 0 | 10 | 0 |
| D | 0 | 10 | 0 |
| Mode M0 | |||
|---|---|---|---|
| Quadrant | BADHDUFLAG | Total packets | Discarded packets |
| A | 0 | 11324 | 2 |
| B | 0 | 10411 | 1 |
| C | 0 | 10065 | 1 |
| D | 0 | 14216 | 1 |
| Quadrant | Total seconds | Saturated seconds | Saturation percentage |
|---|---|---|---|
| A | 4923 | 62 | 1.259395% |
| B | 4923 | 27 | 0.548446% |
| C | 4923 | 9 | 0.182815% |
| D | 4923 | 504 | 10.237660% |
Noise dominated data is calculated using 1-second bins in cleaned event files. If a bin has >2000 counts, and if more than 50% of those come from <1% of pixels, then it is considered to be noise-dominated and hence unusable.
| Quadrant | # 1 sec bins | Bins with >0 counts | Bins with >2000 counts | High rate bins dominated by noise | Noise dominated (total time) | Noise dominated (detector-on time) | Marked lightcurve |
|---|---|---|---|---|---|---|---|
| A | 6013 | 4924 | 35 | 35 | 0.58% | 0.71% | 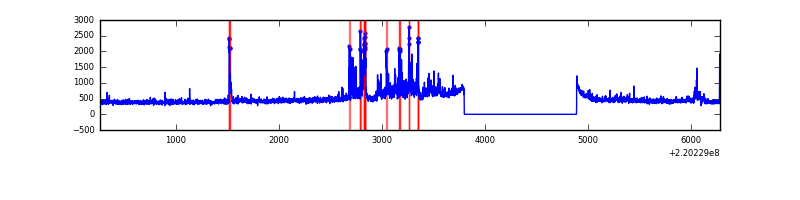 |
| B | 6013 | 4924 | 4 | 4 | 0.07% | 0.08% | 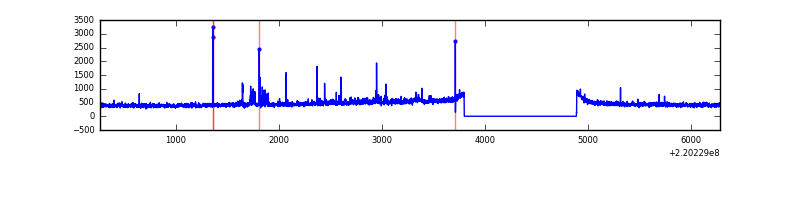 |
| C | 6013 | 4924 | 2 | 2 | 0.03% | 0.04% | 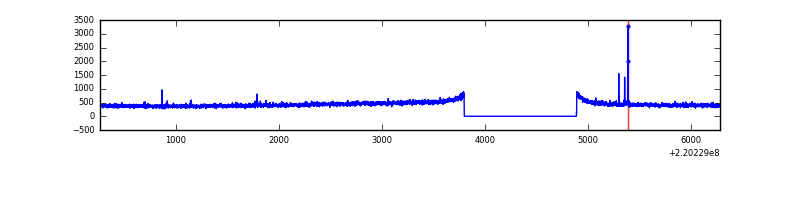 |
| D | 6013 | 4924 | 332 | 332 | 5.52% | 6.74% | 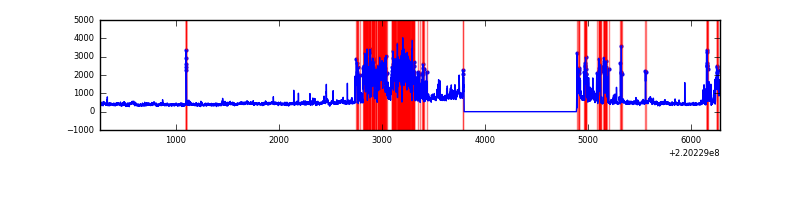 |
Top three noisy pixels from each quadrant. If the there are fewer than three noisy pixels in the level2.evt file, extra rows are filled as -1
| Pixel properties | Quadrant properties | ||||||
|---|---|---|---|---|---|---|---|
| Quadrant | DetID | PixID | Counts | Sigma | Mean | Median | Sigma |
| A | 14 | 207 | 294408 | 2583.08 | 556 | 543 | 113.8 |
| A | 15 | 234 | 44582 | 387.1 | 556 | 543 | 113.8 |
| A | 8 | 15 | 44519 | 386.55 | 556 | 543 | 113.8 |
| B | 3 | 220 | 34462 | 313.94 | 563 | 550 | 108.0 |
| B | 0 | 214 | 26452 | 239.78 | 563 | 550 | 108.0 |
| B | 0 | 228 | 22573 | 203.87 | 563 | 550 | 108.0 |
| C | 12 | 4 | 12869 | 97.85 | 540 | 542 | 126.0 |
| C | 13 | 61 | 4209 | 29.11 | 540 | 542 | 126.0 |
| C | 9 | 54 | 1999 | 11.57 | 540 | 542 | 126.0 |
| D | 2 | 33 | 1091492 | 8597.02 | 511 | 496 | 126.9 |
| D | 8 | 195 | 198207 | 1557.96 | 511 | 496 | 126.9 |
| D | 2 | 152 | 120004 | 941.72 | 511 | 496 | 126.9 |
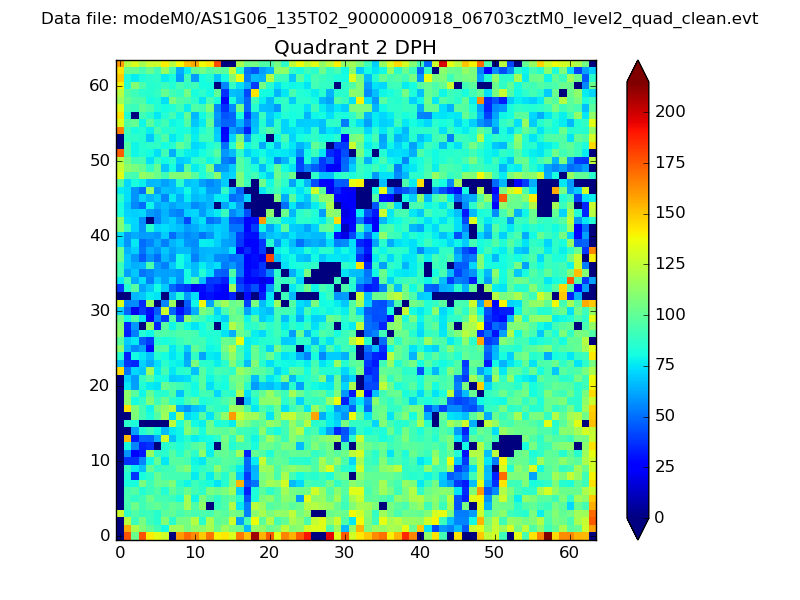
Histogram calculated using DETX and DETY for each event in the final _common_clean file
| Quadrant A | 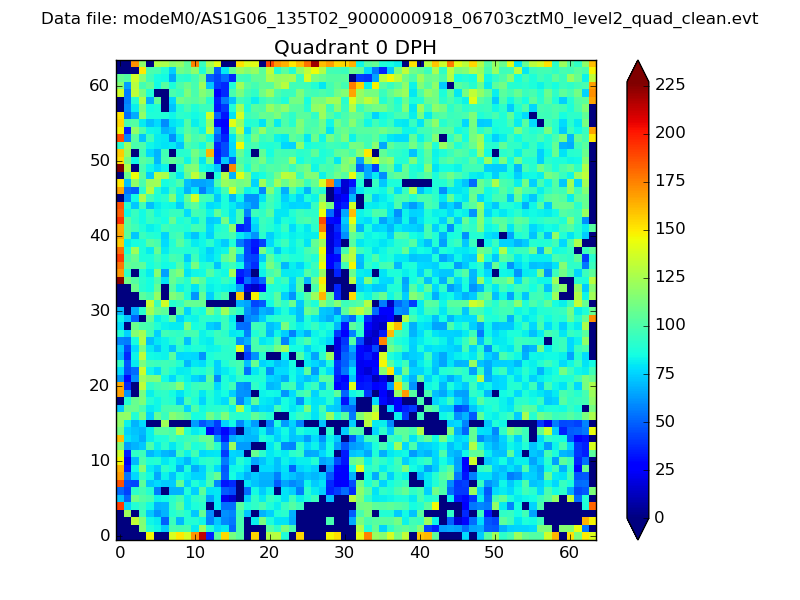 |
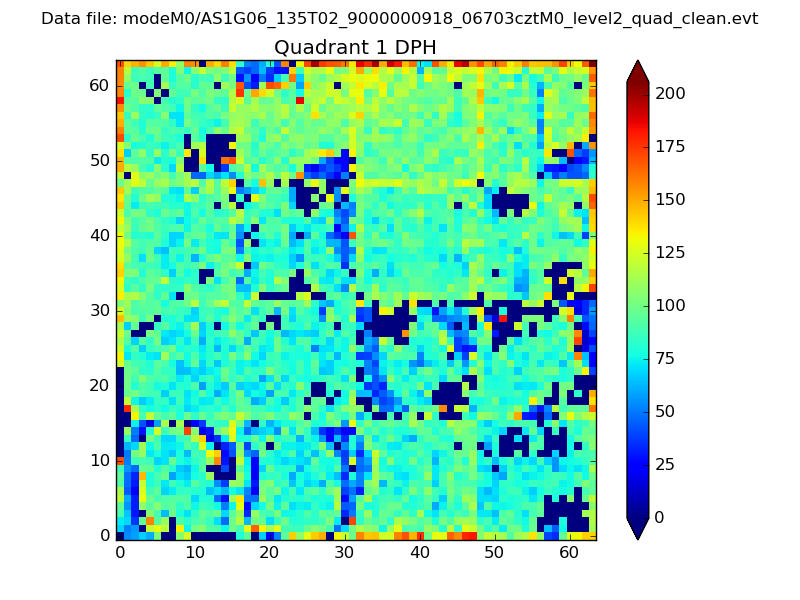 |
Quadrant B |
|---|---|---|---|
| Quadrant D | 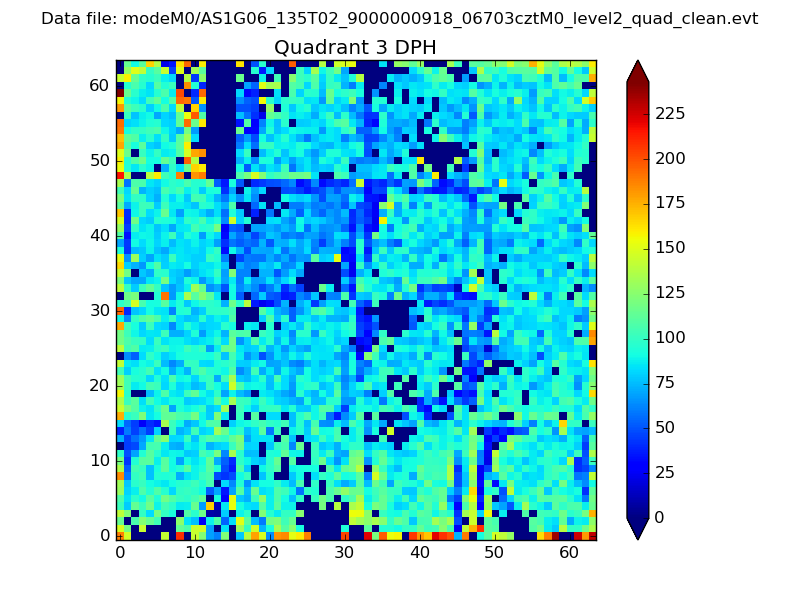 |
 |
Quadrant C |
| Plot type | Count rate plots | Images |
|---|---|---|
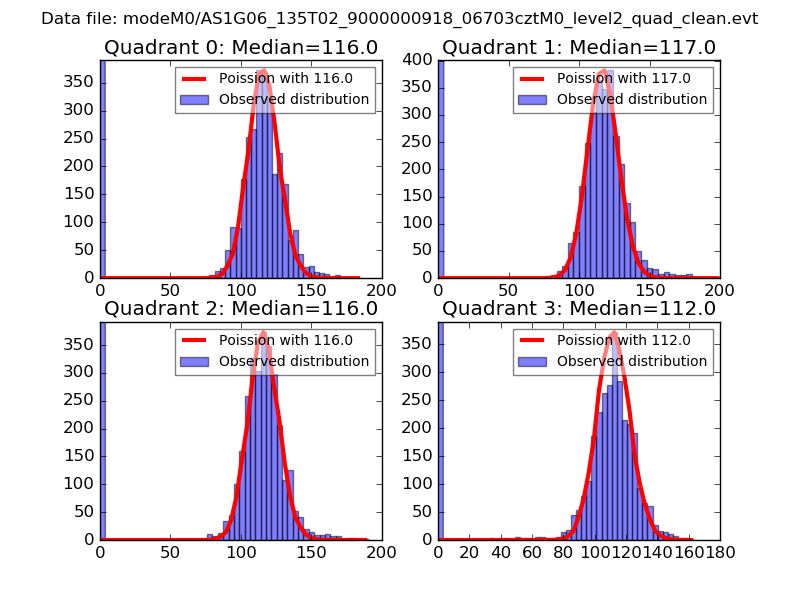
| Comparison with Poisson distribution Blue bars denote a histogram of data divided into 1 sec bins. Red curve is a Poisson curve with rate = median count rate of data. |
 |
 |
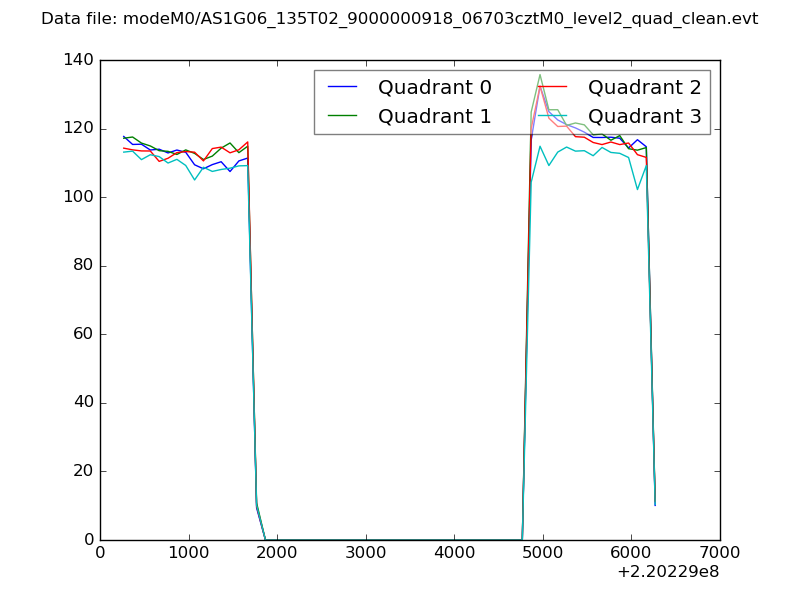
| Quadrant-wise count rates Data is divided into 100 sec bins |
 |
|
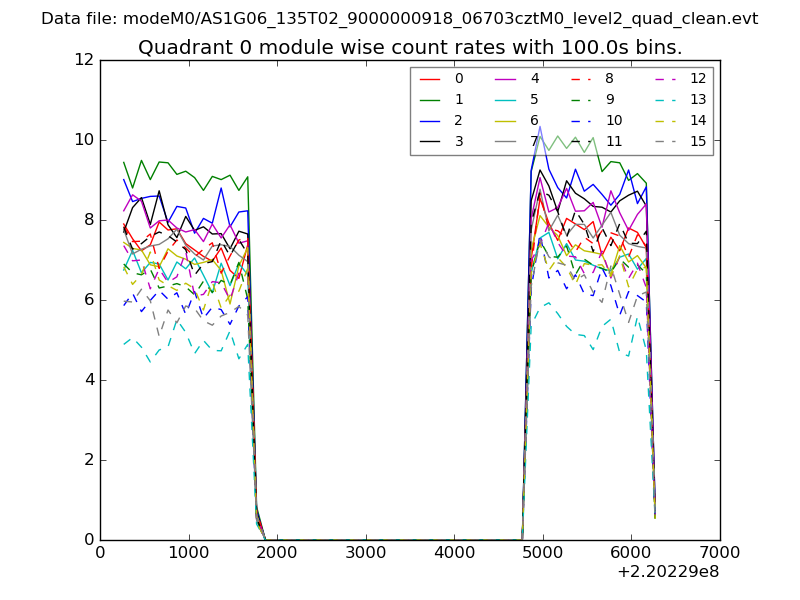
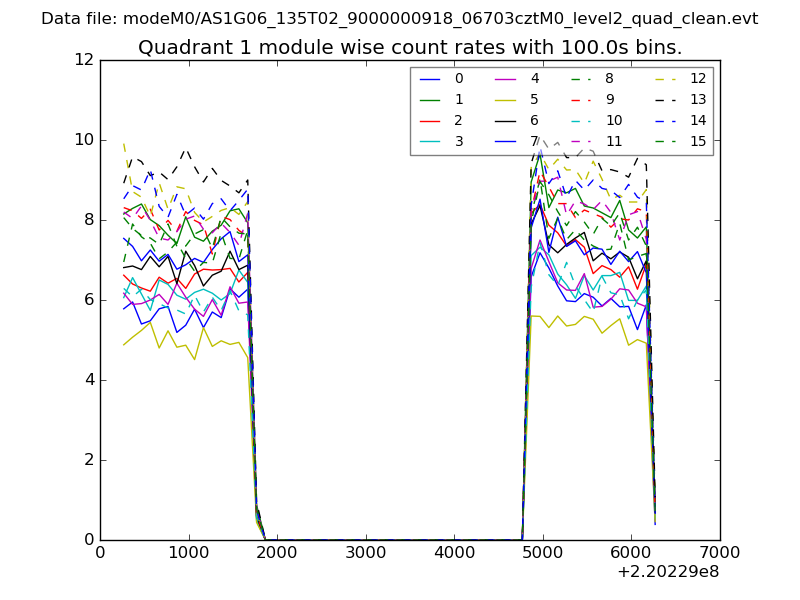
| Module-wise count rates for Quadrant A Data is divided into 100 sec bins |
 |
 |
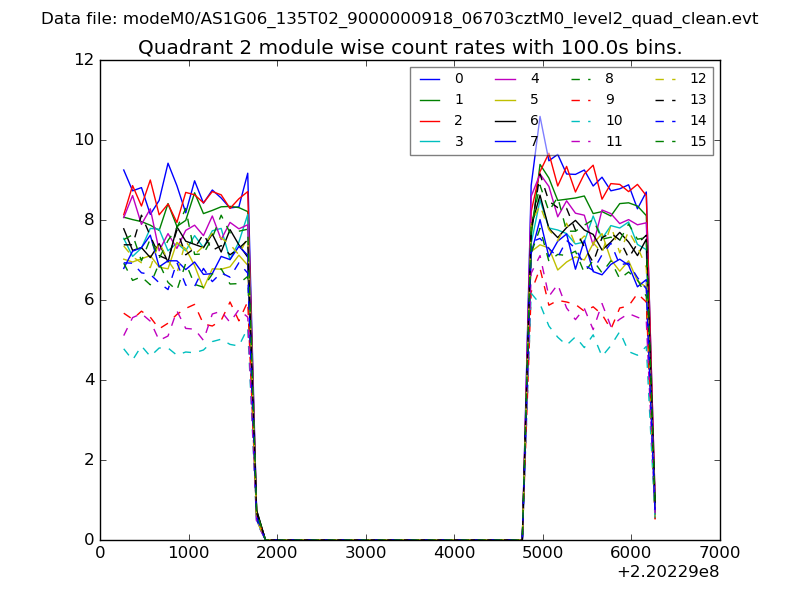
| Module-wise count rates for Quadrant B Data is divided into 100 sec bins |
 |
 |
| Module-wise count rates for Quadrant C Data is divided into 100 sec bins |
 |
 |
| Module-wise count rates for Quadrant D Data is divided into 100 sec bins |
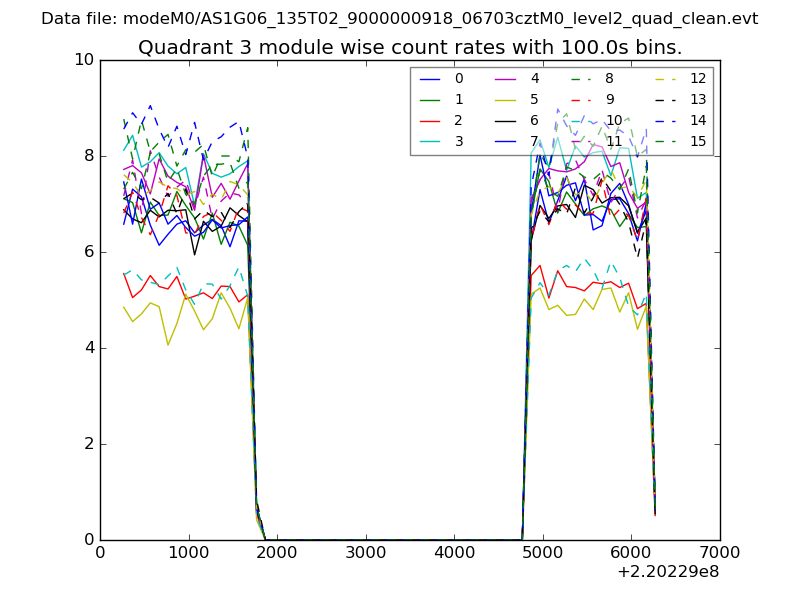 |
 |
| Parameter | Plot |
|---|---|
| CZT HV Monitor | 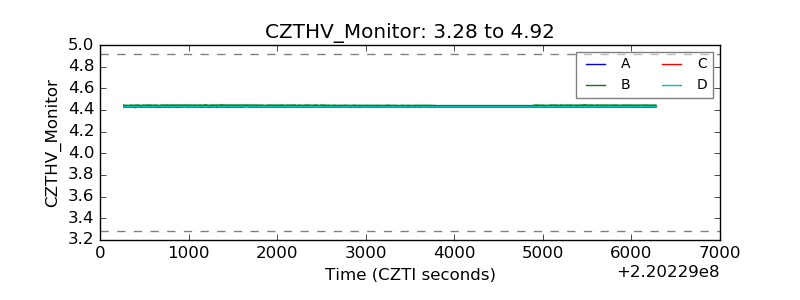 |
| D_VDD | 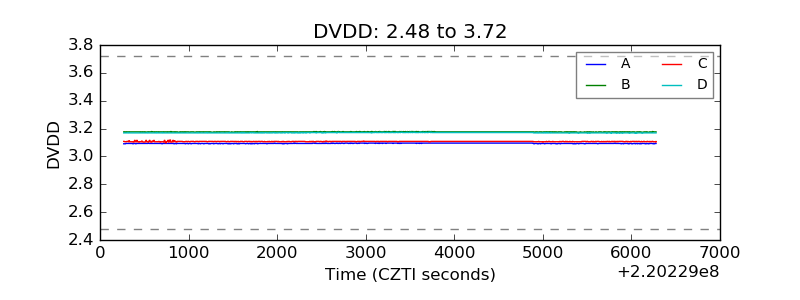 |
| Temperature 1 | 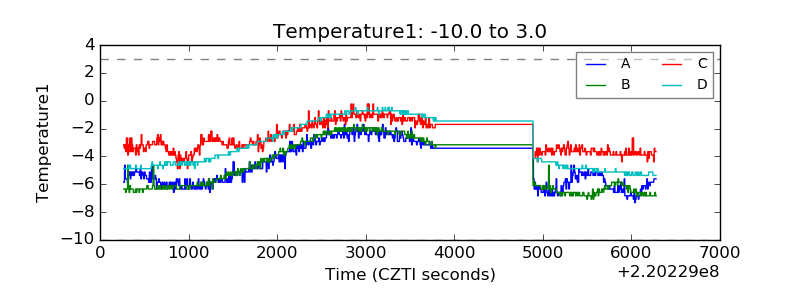 |
| Veto HV Monitor | 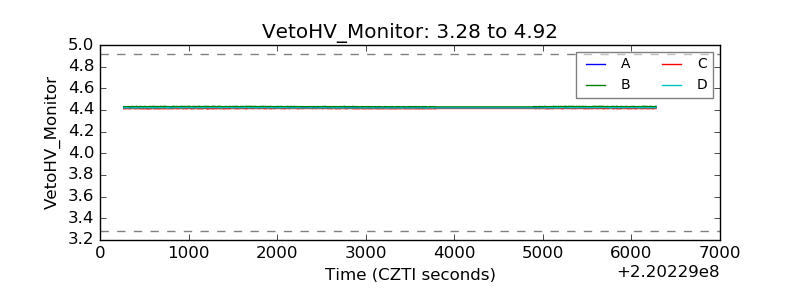 |
| Veto LLD | 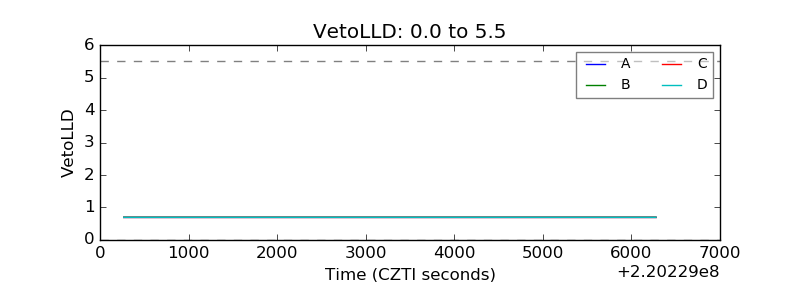 |
| Alpha Counter | 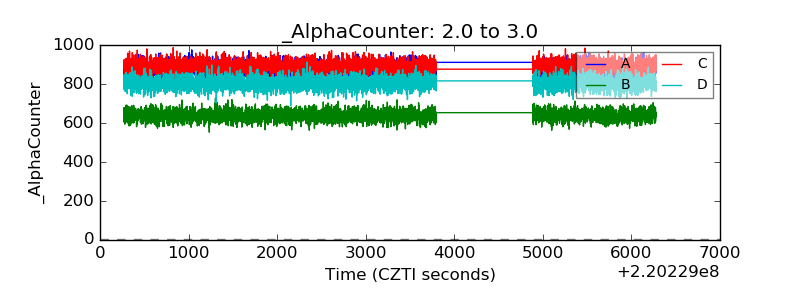 |
| _CPM_Rate | 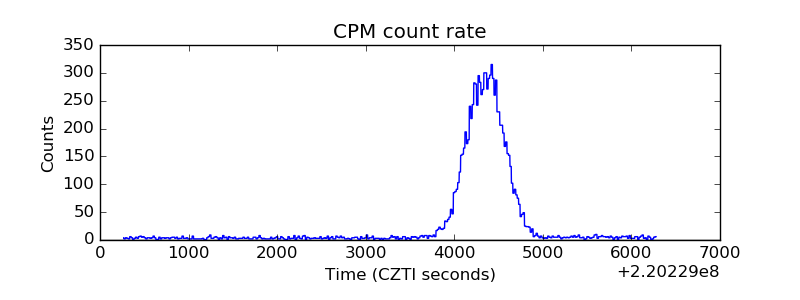 |
| CZT Counter | 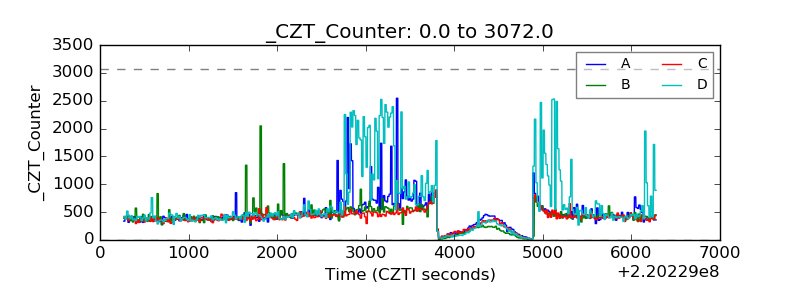 |
| +2.5 Volts monitor |  |
| +5 Volts monitor |  |
| _ROLL_ROT | 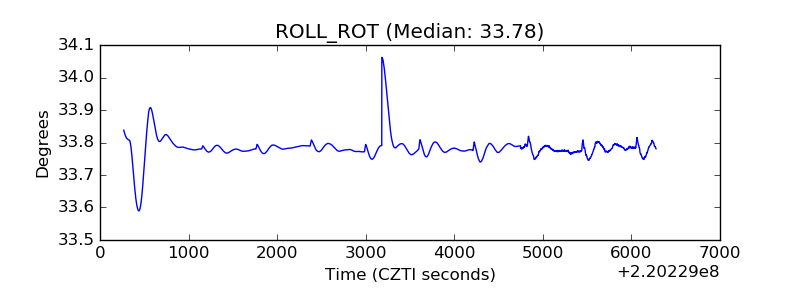 |
| _Roll_DEC | 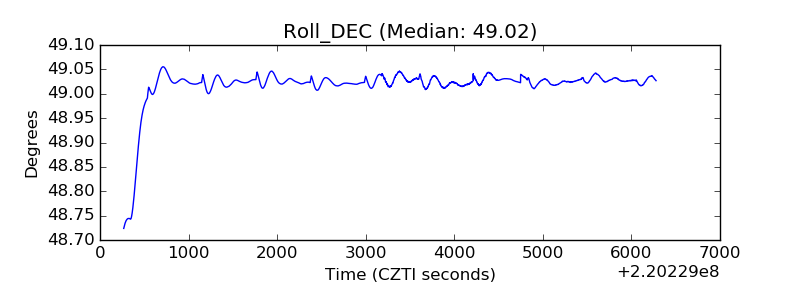 |
| _Roll_RA | 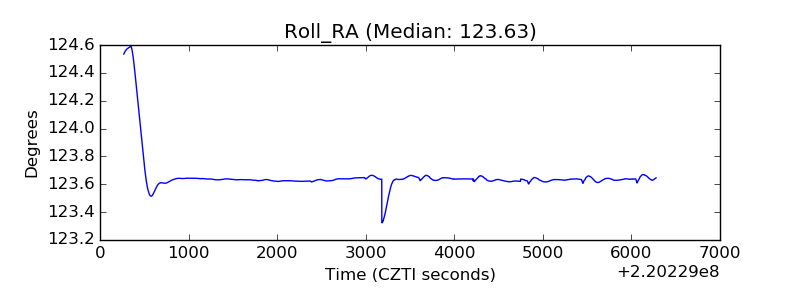 |
| Veto Counter | 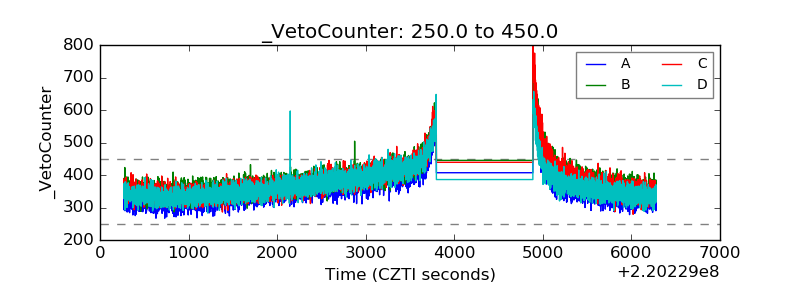 |