| Param | Original file | Final file |
|---|---|---|
| Filename | modeM0/AS1G06_135T02_9000000918_06704cztM0_level2.evt | modeM0/AS1G06_135T02_9000000918_06704cztM0_level2_quad_clean.evt |
| Size (bytes) | 635,443,200 | 93,657,600 |
| Size | 606.0 MB | 89.3 MB |
| Events in quadrant A | 6,949,179 | 508,142 |
| Events in quadrant B | 3,292,520 | 622,727 |
| Events in quadrant C | 3,141,033 | 616,483 |
| Events in quadrant D | 5,369,703 | 583,303 |
| Mode SS | |||
|---|---|---|---|
| Quadrant | BADHDUFLAG | Total packets | Discarded packets |
| A | 0 | 148 | 0 |
| B | 0 | 148 | 0 |
| C | 0 | 148 | 0 |
| D | 0 | 148 | 0 |
| Mode M9 | |||
|---|---|---|---|
| Quadrant | BADHDUFLAG | Total packets | Discarded packets |
| A | 0 | 11 | 0 |
| B | 0 | 11 | 0 |
| C | 0 | 11 | 0 |
| D | 0 | 12 | 0 |
| Mode M0 | |||
|---|---|---|---|
| Quadrant | BADHDUFLAG | Total packets | Discarded packets |
| A | 0 | 25980 | 3 |
| B | 0 | 15069 | 2 |
| C | 0 | 14900 | 2 |
| D | 0 | 21110 | 2 |
| Quadrant | Total seconds | Saturated seconds | Saturation percentage |
|---|---|---|---|
| A | 7252 | 1564 | 21.566464% |
| B | 7252 | 71 | 0.979040% |
| C | 7252 | 38 | 0.523993% |
| D | 7252 | 593 | 8.177055% |
Noise dominated data is calculated using 1-second bins in cleaned event files. If a bin has >2000 counts, and if more than 50% of those come from <1% of pixels, then it is considered to be noise-dominated and hence unusable.
| Quadrant | # 1 sec bins | Bins with >0 counts | Bins with >2000 counts | High rate bins dominated by noise | Noise dominated (total time) | Noise dominated (detector-on time) | Marked lightcurve |
|---|---|---|---|---|---|---|---|
| A | 7962 | 7253 | 1327 | 1327 | 16.67% | 18.30% |  |
| B | 7962 | 7253 | 3 | 3 | 0.04% | 0.04% | 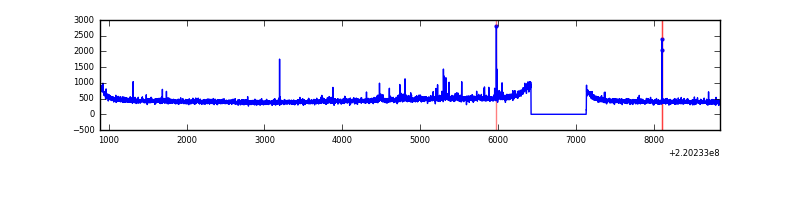 |
| C | 7962 | 7253 | 2 | 2 | 0.03% | 0.03% |  |
| D | 7962 | 7253 | 423 | 423 | 5.31% | 5.83% |  |
Top three noisy pixels from each quadrant. If the there are fewer than three noisy pixels in the level2.evt file, extra rows are filled as -1
| Pixel properties | Quadrant properties | ||||||
|---|---|---|---|---|---|---|---|
| Quadrant | DetID | PixID | Counts | Sigma | Mean | Median | Sigma |
| A | 14 | 111 | 4172032 | 29421.13 | 699 | 682 | 141.8 |
| A | 15 | 234 | 44981 | 312.44 | 699 | 682 | 141.8 |
| A | 8 | 15 | 16510 | 111.63 | 699 | 682 | 141.8 |
| B | 11 | 51 | 24459 | 147.96 | 827 | 807 | 159.9 |
| B | 0 | 214 | 24006 | 145.13 | 827 | 807 | 159.9 |
| B | 0 | 219 | 22968 | 138.63 | 827 | 807 | 159.9 |
| C | 9 | 247 | 22408 | 118.35 | 793 | 796 | 182.6 |
| C | 12 | 4 | 15837 | 82.36 | 793 | 796 | 182.6 |
| C | 13 | 61 | 6342 | 30.37 | 793 | 796 | 182.6 |
| D | 2 | 33 | 1554677 | 8390.54 | 764 | 739 | 185.2 |
| D | 8 | 195 | 298769 | 1609.22 | 764 | 739 | 185.2 |
| D | 2 | 136 | 241490 | 1299.94 | 764 | 739 | 185.2 |
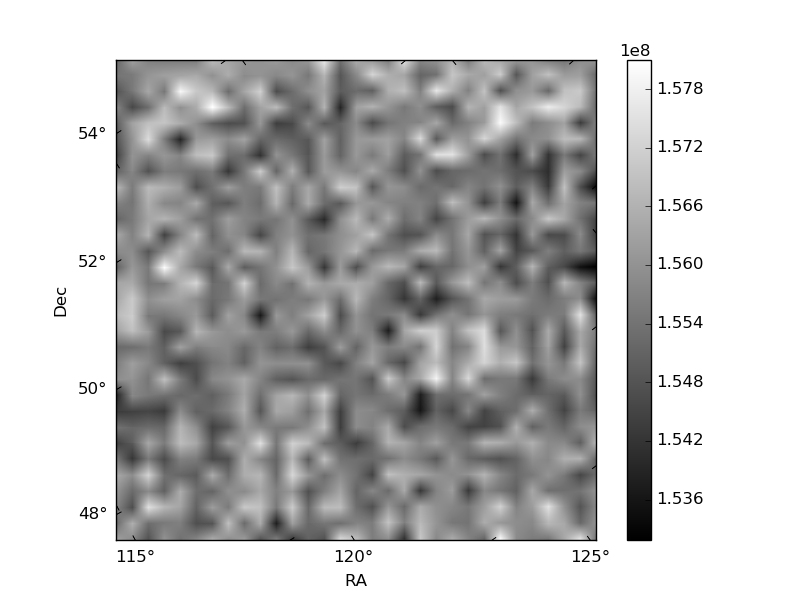
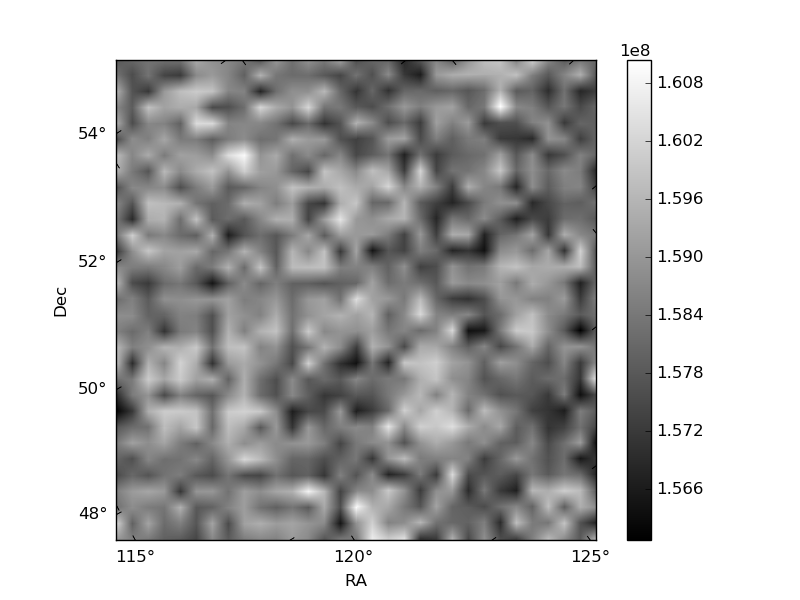
Histogram calculated using DETX and DETY for each event in the final _common_clean file
| Quadrant A | 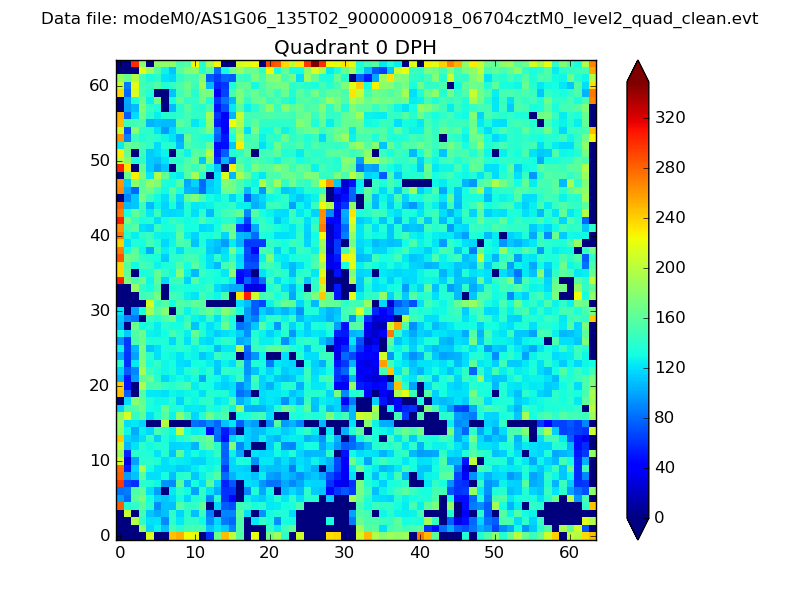 |
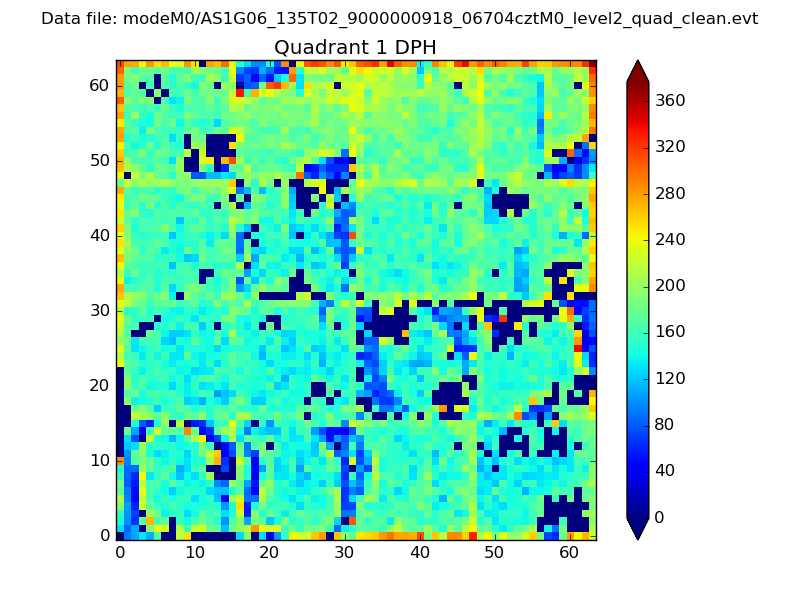 |
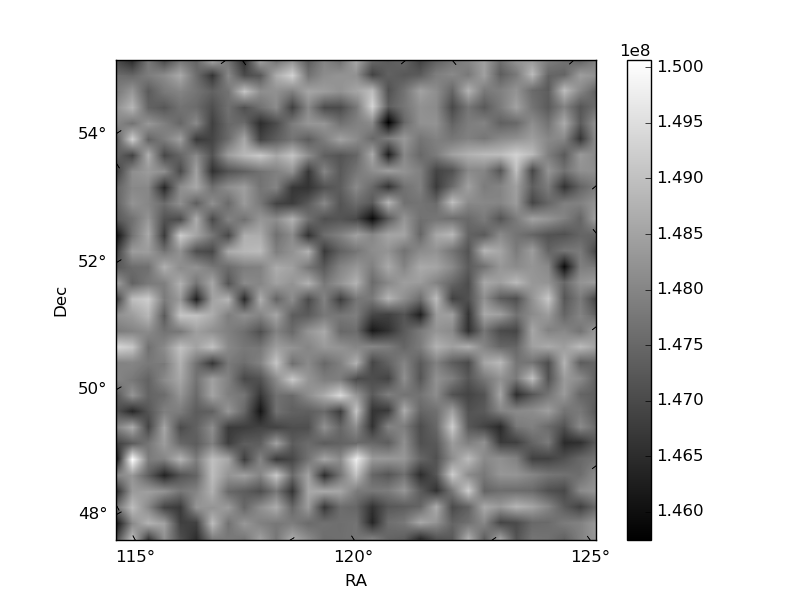
Quadrant B |
|---|---|---|---|
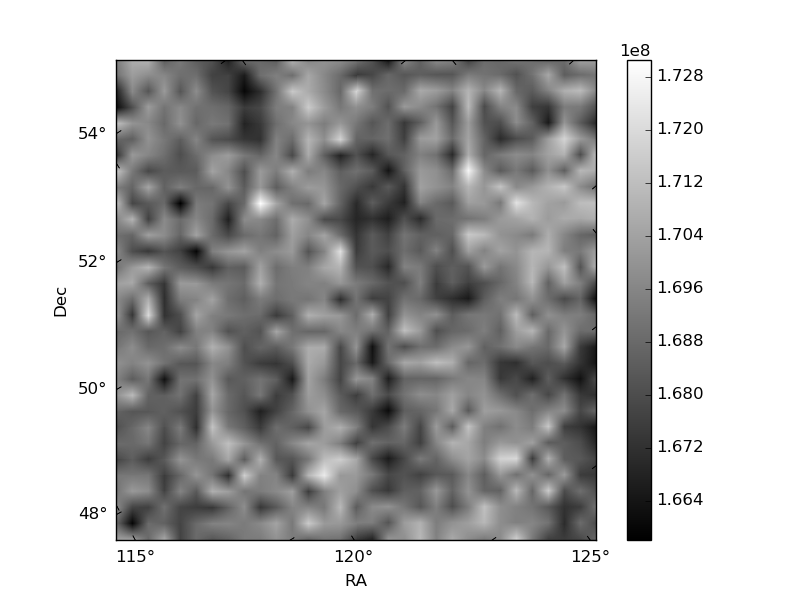
| Quadrant D | 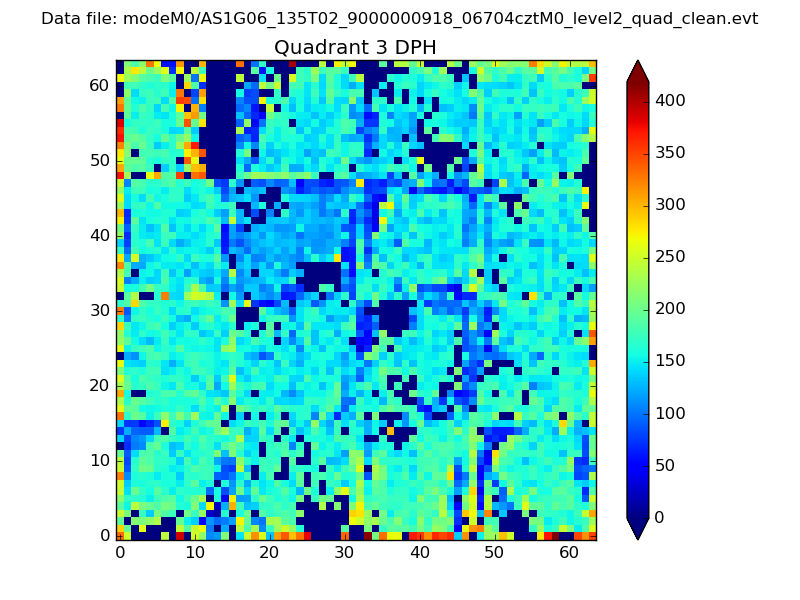 |
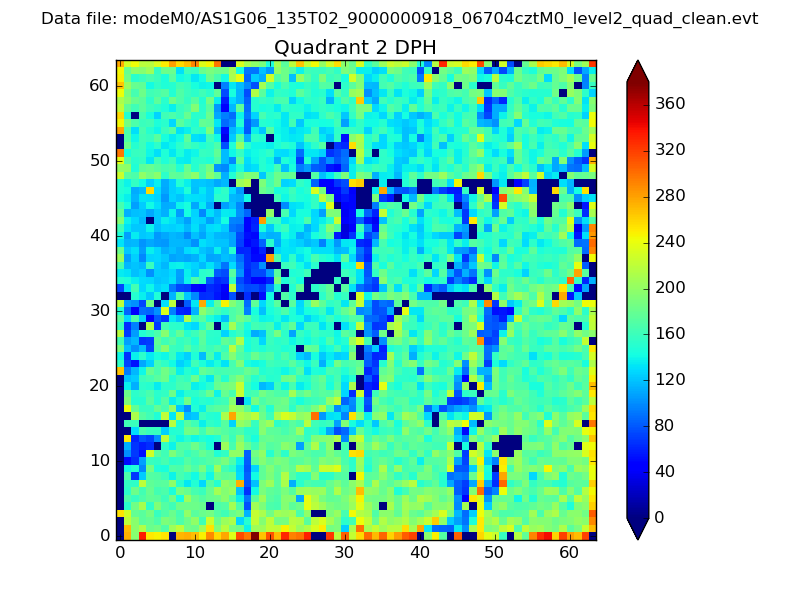 |
Quadrant C |
| Plot type | Count rate plots | Images |
|---|---|---|
| Comparison with Poisson distribution Blue bars denote a histogram of data divided into 1 sec bins. Red curve is a Poisson curve with rate = median count rate of data. |
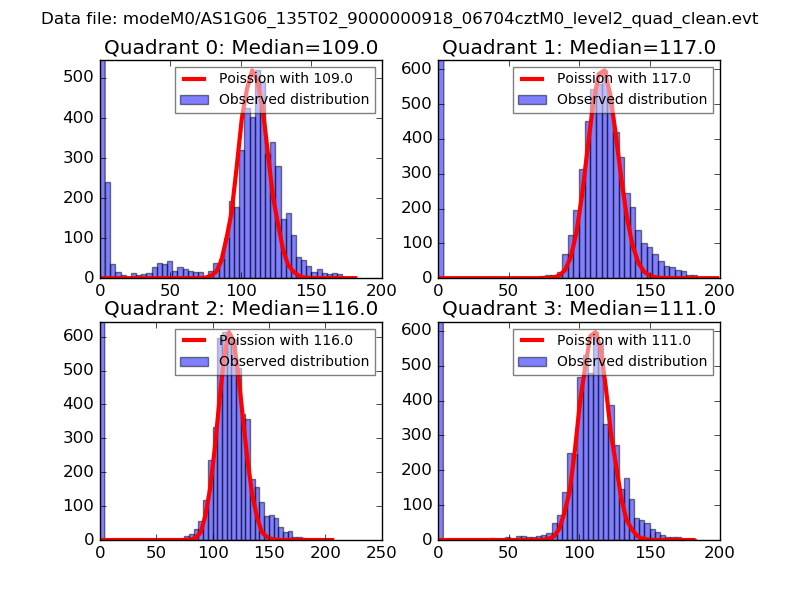 |
 |
| Quadrant-wise count rates Data is divided into 100 sec bins |
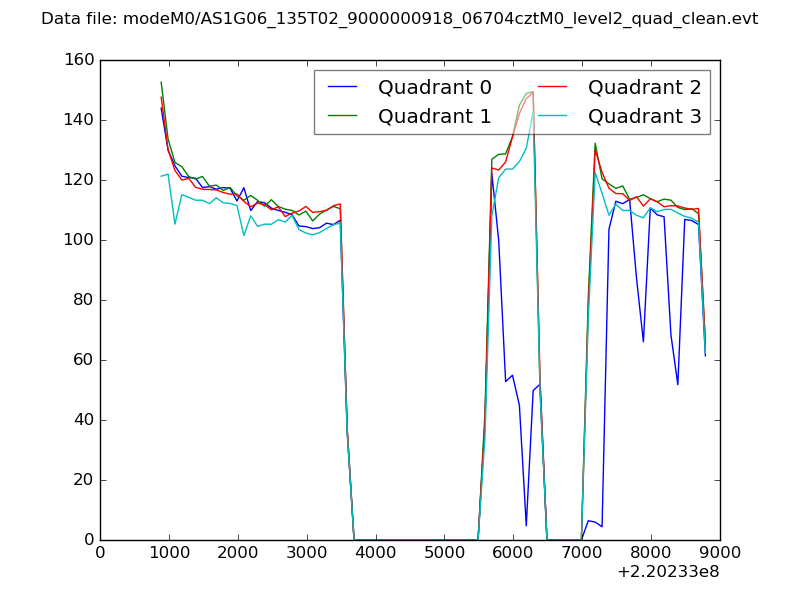 |
|
| Module-wise count rates for Quadrant A Data is divided into 100 sec bins |
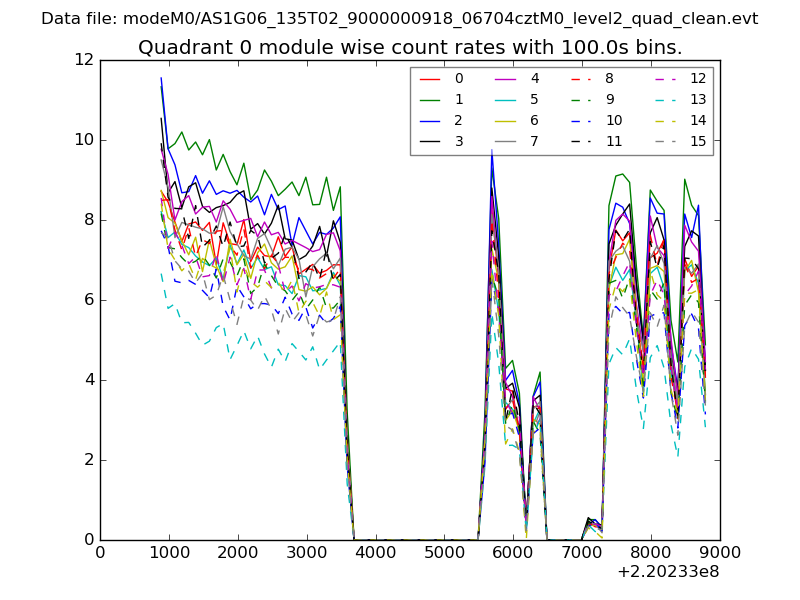 |
 |
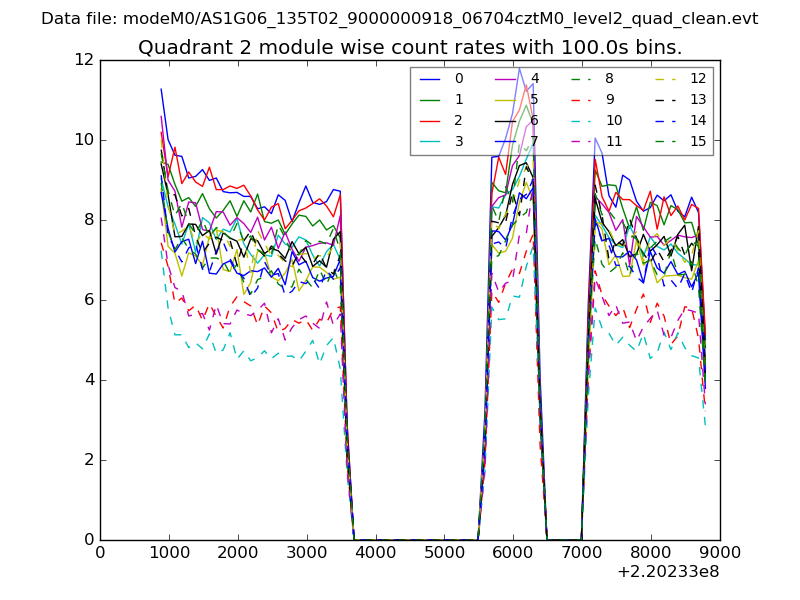
| Module-wise count rates for Quadrant B Data is divided into 100 sec bins |
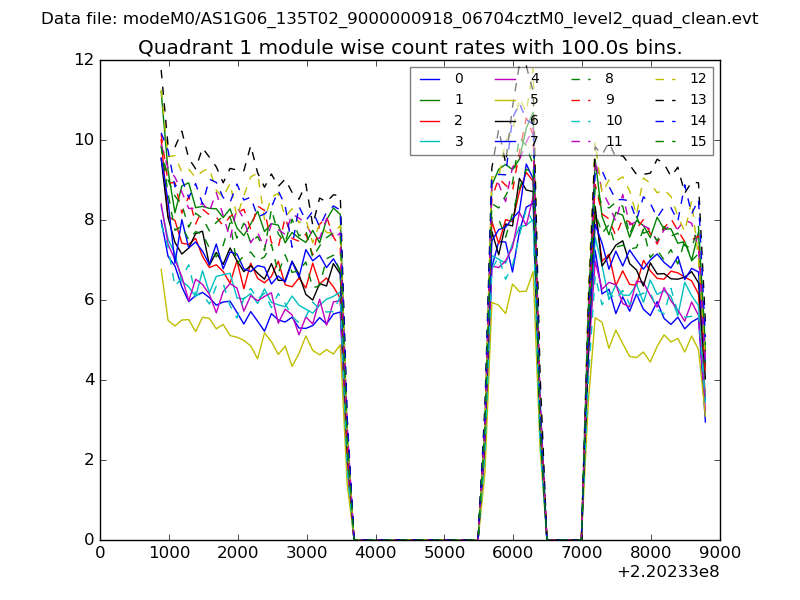 |
 |
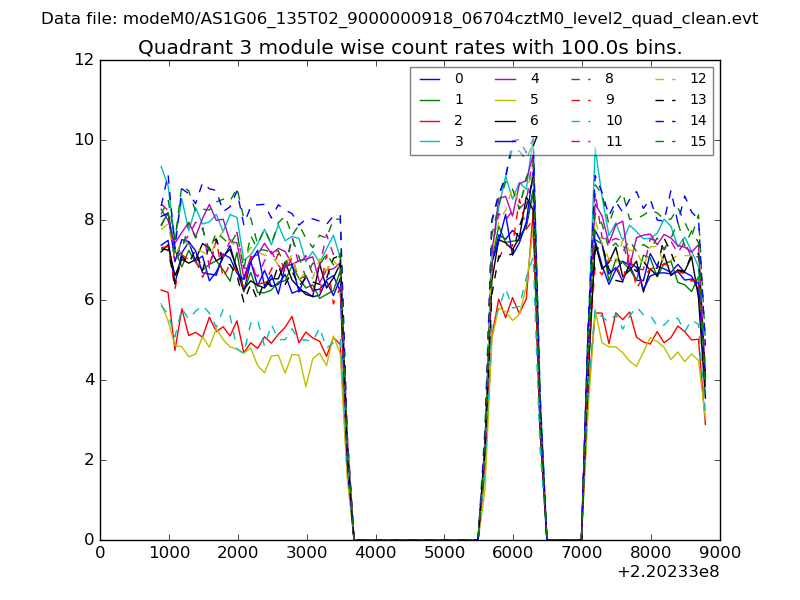
| Module-wise count rates for Quadrant C Data is divided into 100 sec bins |
 |
 |
| Module-wise count rates for Quadrant D Data is divided into 100 sec bins |
 |
 |
| Parameter | Plot |
|---|---|
| CZT HV Monitor | 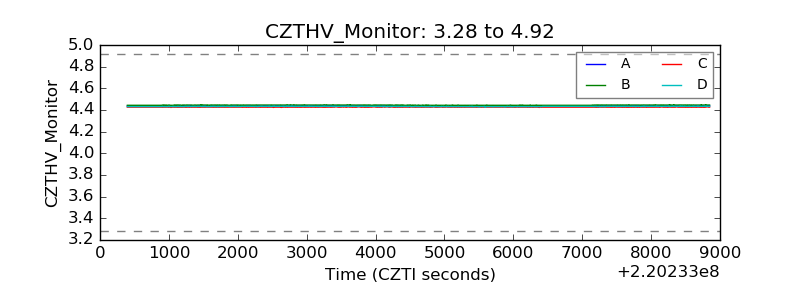 |
| D_VDD | 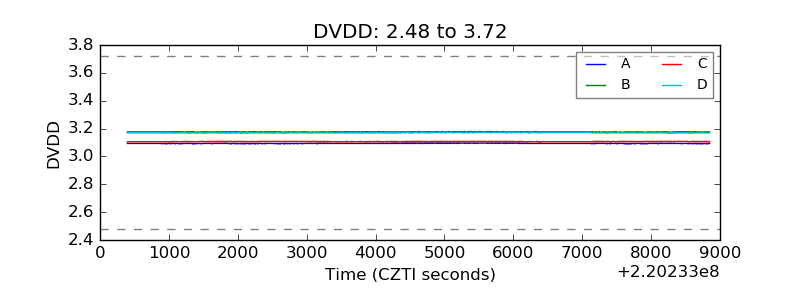 |
| Temperature 1 | 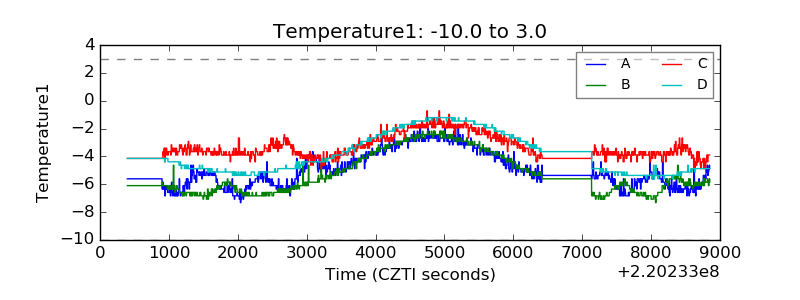 |
| Veto HV Monitor | 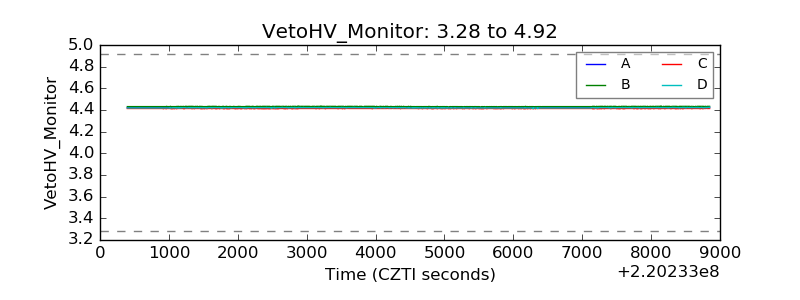 |
| Veto LLD | 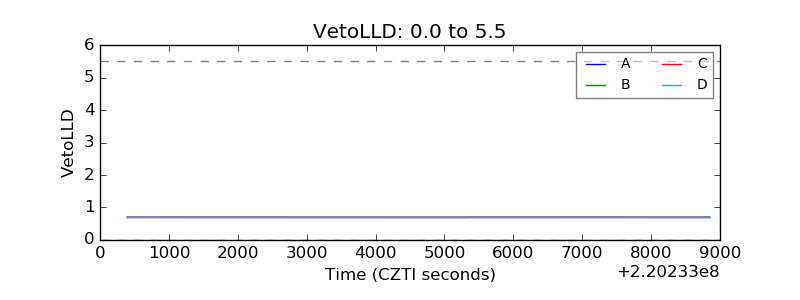 |
| Alpha Counter | 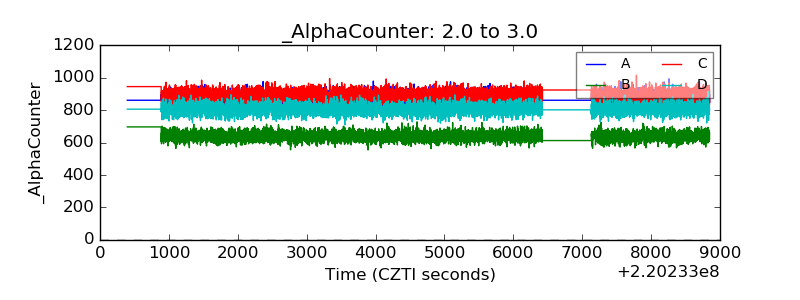 |
| _CPM_Rate | 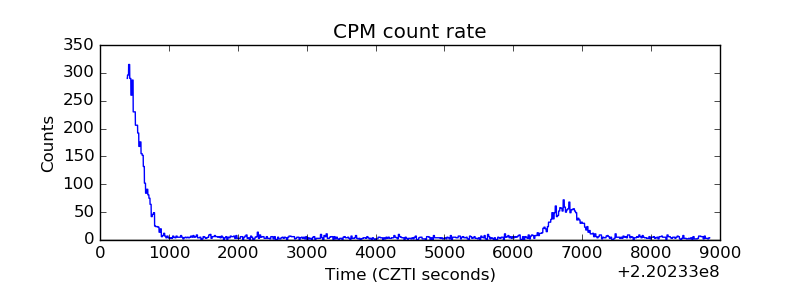 |
| CZT Counter | 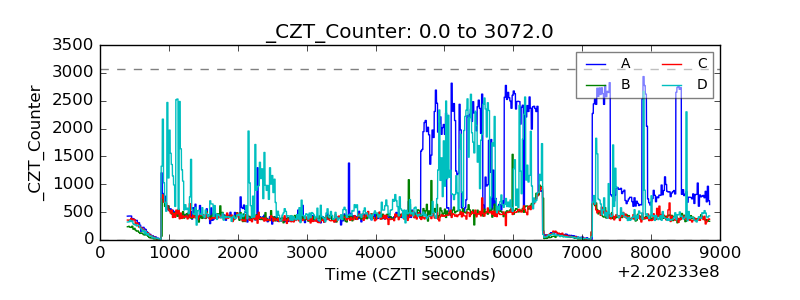 |
| +2.5 Volts monitor |  |
| +5 Volts monitor |  |
| _ROLL_ROT | 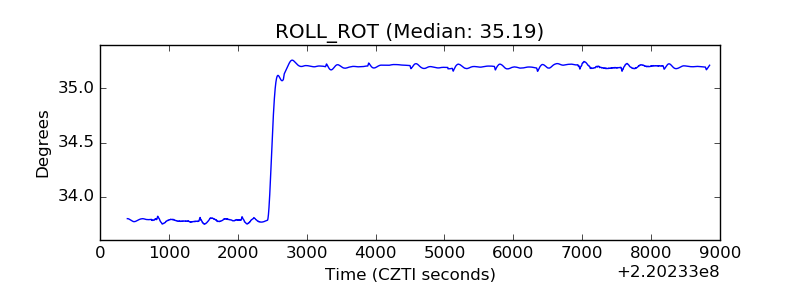 |
| _Roll_DEC | 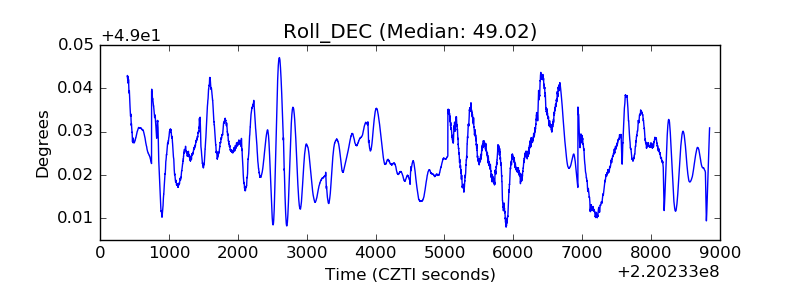 |
| _Roll_RA | 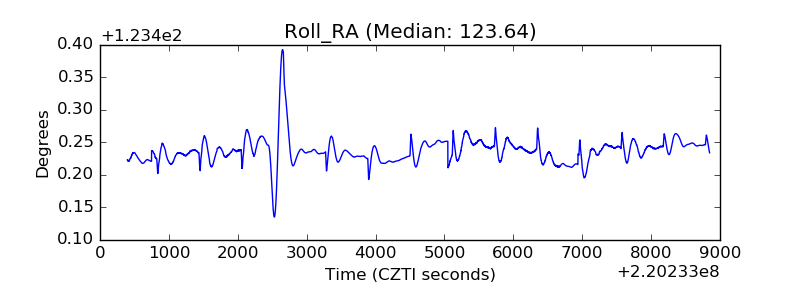 |
| Veto Counter | 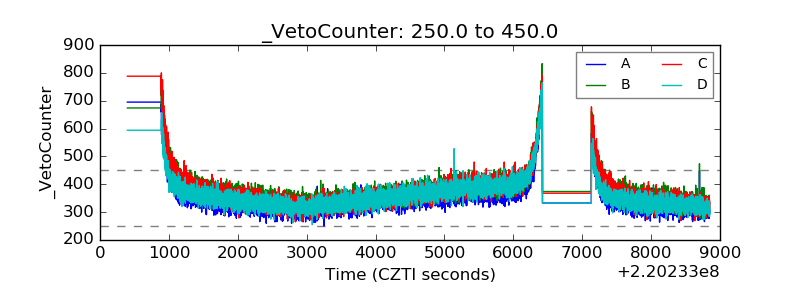 |