| Param | Original file | Final file |
|---|---|---|
| Filename | modeM0/AS1G06_135T02_9000000918_06705cztM0_level2.evt | modeM0/AS1G06_135T02_9000000918_06705cztM0_level2_quad_clean.evt |
| Size (bytes) | 577,725,120 | 97,453,440 |
| Size | 551.0 MB | 92.9 MB |
| Events in quadrant A | 4,301,283 | 603,899 |
| Events in quadrant B | 3,430,924 | 635,484 |
| Events in quadrant C | 3,220,169 | 630,744 |
| Events in quadrant D | 6,039,320 | 563,331 |
| Mode SS | |||
|---|---|---|---|
| Quadrant | BADHDUFLAG | Total packets | Discarded packets |
| A | 0 | 150 | 0 |
| B | 0 | 150 | 0 |
| C | 0 | 150 | 0 |
| D | 0 | 150 | 0 |
| Mode M9 | |||
|---|---|---|---|
| Quadrant | BADHDUFLAG | Total packets | Discarded packets |
| A | 0 | 3 | 0 |
| B | 0 | 3 | 0 |
| C | 0 | 3 | 0 |
| D | 0 | 3 | 0 |
| Mode M0 | |||
|---|---|---|---|
| Quadrant | BADHDUFLAG | Total packets | Discarded packets |
| A | 0 | 18120 | 2 |
| B | 0 | 15612 | 1 |
| C | 0 | 15282 | 1 |
| D | 0 | 23300 | 1 |
| Quadrant | Total seconds | Saturated seconds | Saturation percentage |
|---|---|---|---|
| A | 7442 | 336 | 4.514915% |
| B | 7442 | 166 | 2.230583% |
| C | 7442 | 79 | 1.061543% |
| D | 7442 | 1107 | 14.875034% |
Noise dominated data is calculated using 1-second bins in cleaned event files. If a bin has >2000 counts, and if more than 50% of those come from <1% of pixels, then it is considered to be noise-dominated and hence unusable.
| Quadrant | # 1 sec bins | Bins with >0 counts | Bins with >2000 counts | High rate bins dominated by noise | Noise dominated (total time) | Noise dominated (detector-on time) | Marked lightcurve |
|---|---|---|---|---|---|---|---|
| A | 7652 | 7444 | 171 | 171 | 2.23% | 2.30% | 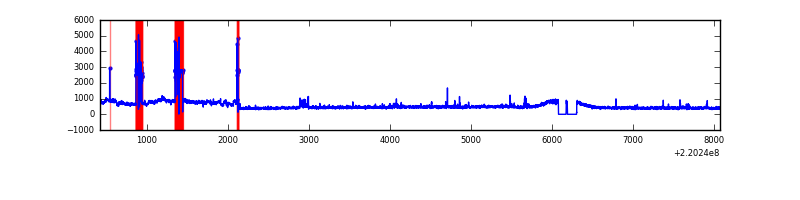 |
| B | 7652 | 7444 | 4 | 4 | 0.05% | 0.05% | 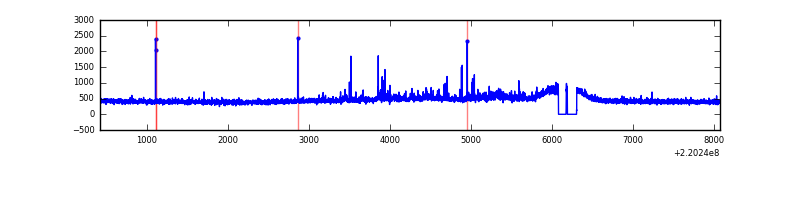 |
| C | 7652 | 7444 | 0 | 0 | 0.00% | 0.00% | 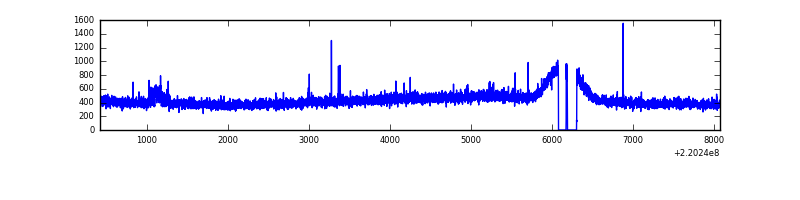 |
| D | 7652 | 7444 | 792 | 792 | 10.35% | 10.64% | 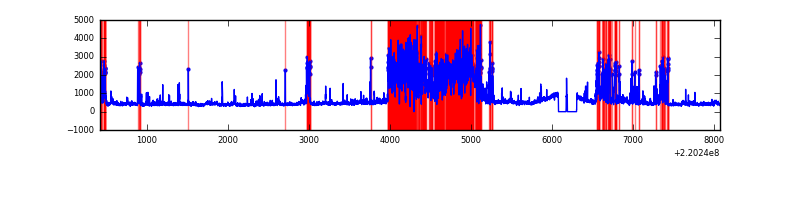 |
Top three noisy pixels from each quadrant. If the there are fewer than three noisy pixels in the level2.evt file, extra rows are filled as -1
| Pixel properties | Quadrant properties | ||||||
|---|---|---|---|---|---|---|---|
| Quadrant | DetID | PixID | Counts | Sigma | Mean | Median | Sigma |
| A | 14 | 111 | 1073937 | 6293.82 | 824 | 803 | 170.5 |
| A | 15 | 234 | 36416 | 208.87 | 824 | 803 | 170.5 |
| A | 8 | 15 | 11731 | 64.09 | 824 | 803 | 170.5 |
| B | 11 | 51 | 53449 | 317.94 | 847 | 825 | 165.5 |
| B | 0 | 197 | 24842 | 145.1 | 847 | 825 | 165.5 |
| B | 12 | 111 | 16535 | 94.92 | 847 | 825 | 165.5 |
| C | 9 | 247 | 29941 | 152.78 | 815 | 818 | 190.6 |
| C | 10 | 22 | 9505 | 45.57 | 815 | 818 | 190.6 |
| C | 13 | 61 | 6579 | 30.22 | 815 | 818 | 190.6 |
| D | 2 | 33 | 2616435 | 13949.28 | 752 | 724 | 187.5 |
| D | 8 | 195 | 234531 | 1246.87 | 752 | 724 | 187.5 |
| D | 2 | 14 | 147084 | 780.52 | 752 | 724 | 187.5 |
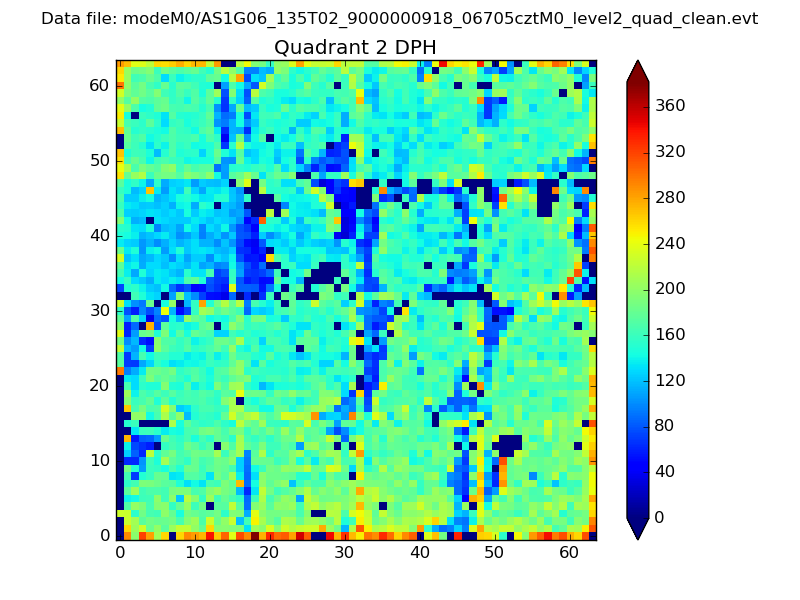
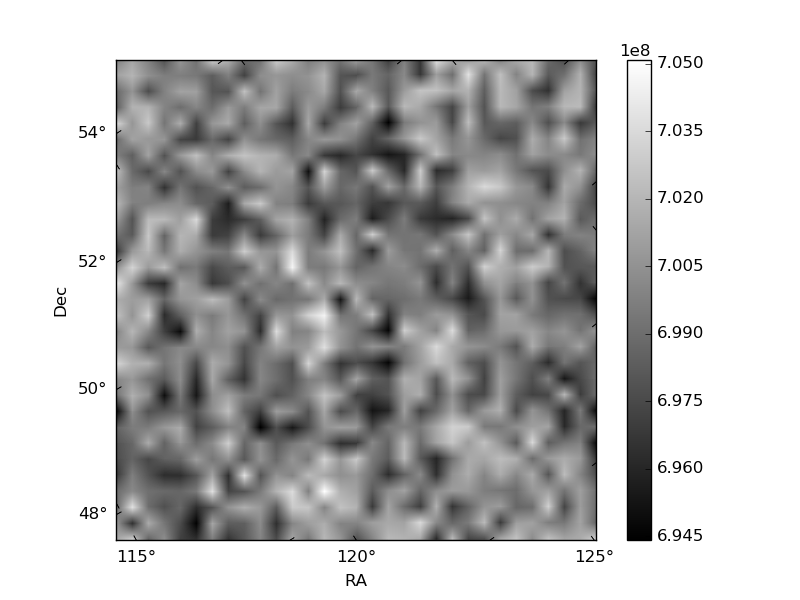
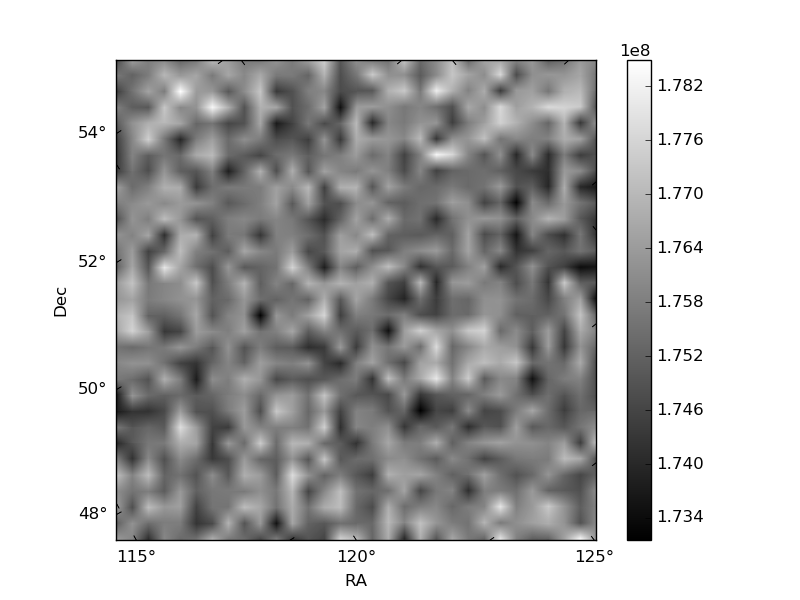
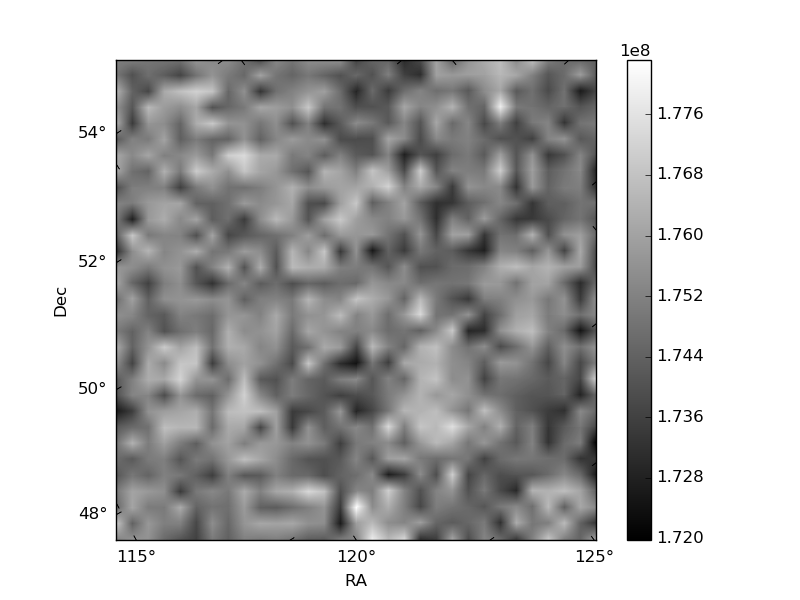
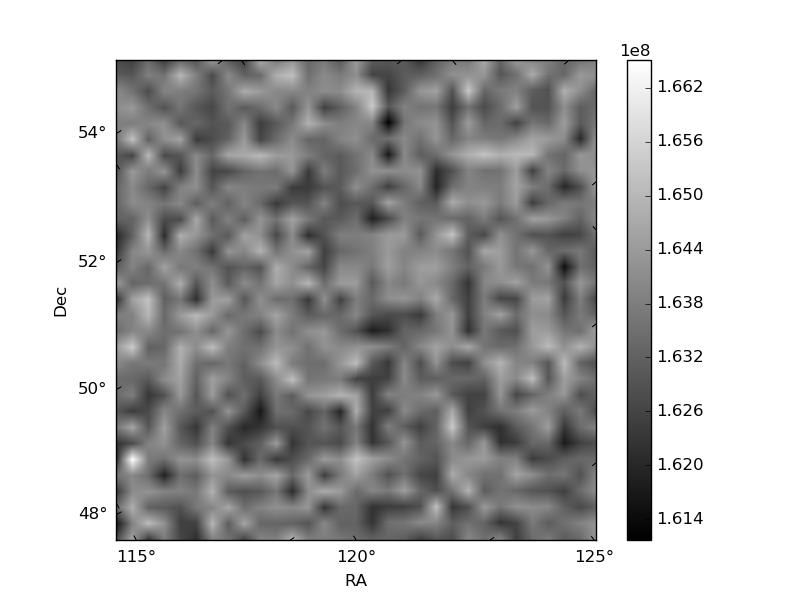
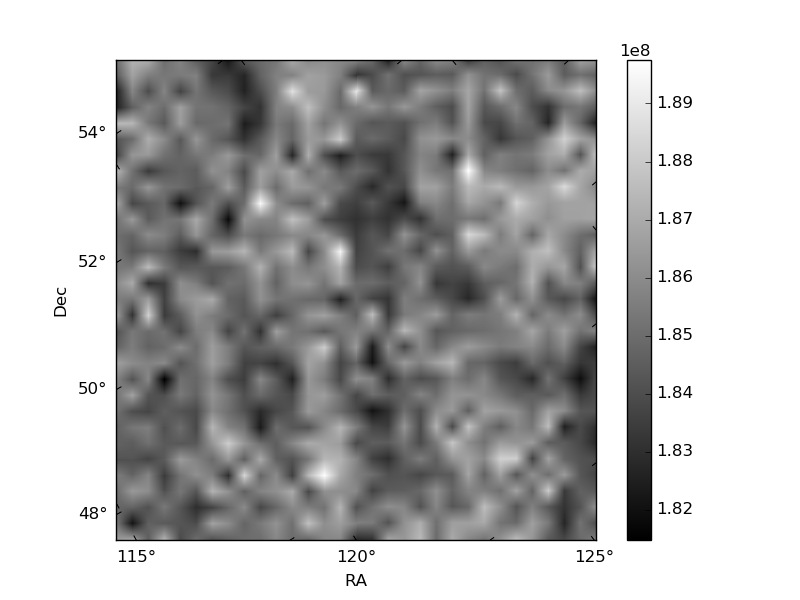
Histogram calculated using DETX and DETY for each event in the final _common_clean file
| Quadrant A |  |
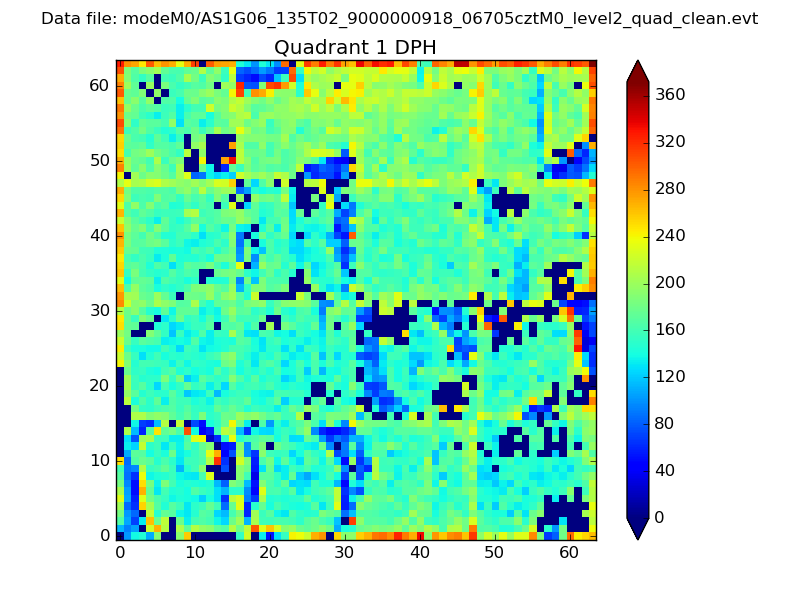 |
Quadrant B |
|---|---|---|---|
| Quadrant D | 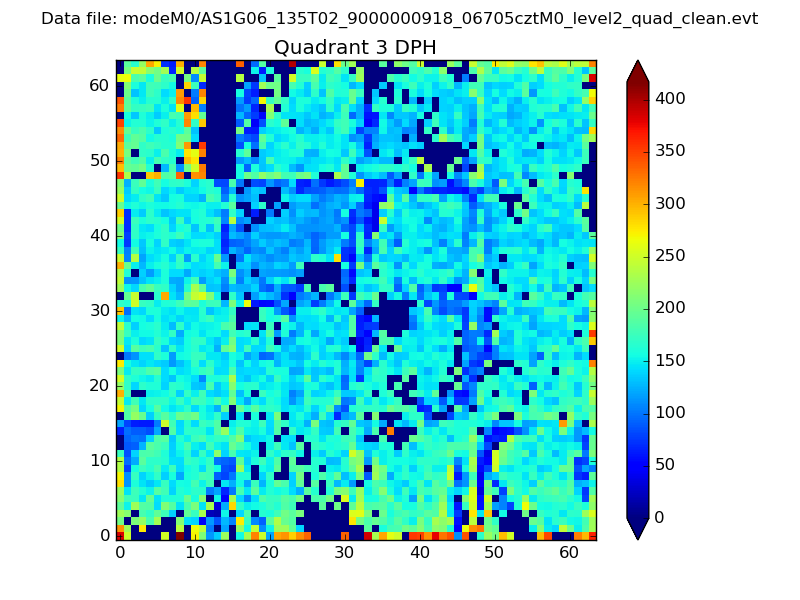 |
 |
Quadrant C |
| Plot type | Count rate plots | Images |
|---|---|---|
| Comparison with Poisson distribution Blue bars denote a histogram of data divided into 1 sec bins. Red curve is a Poisson curve with rate = median count rate of data. |
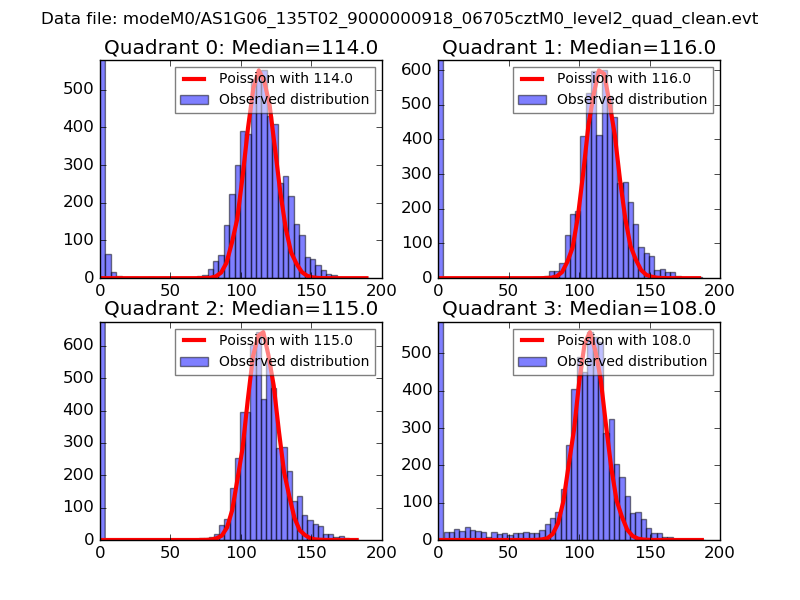 |
 |
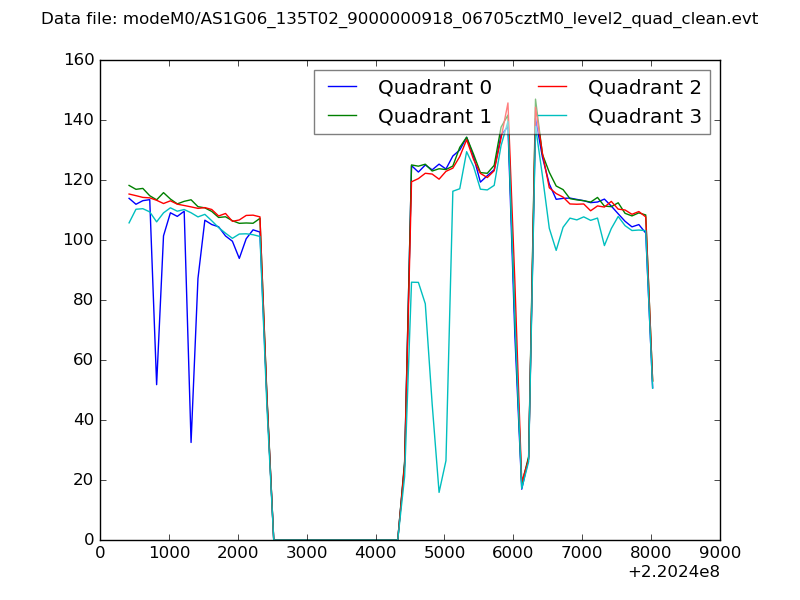
| Quadrant-wise count rates Data is divided into 100 sec bins |
 |
|
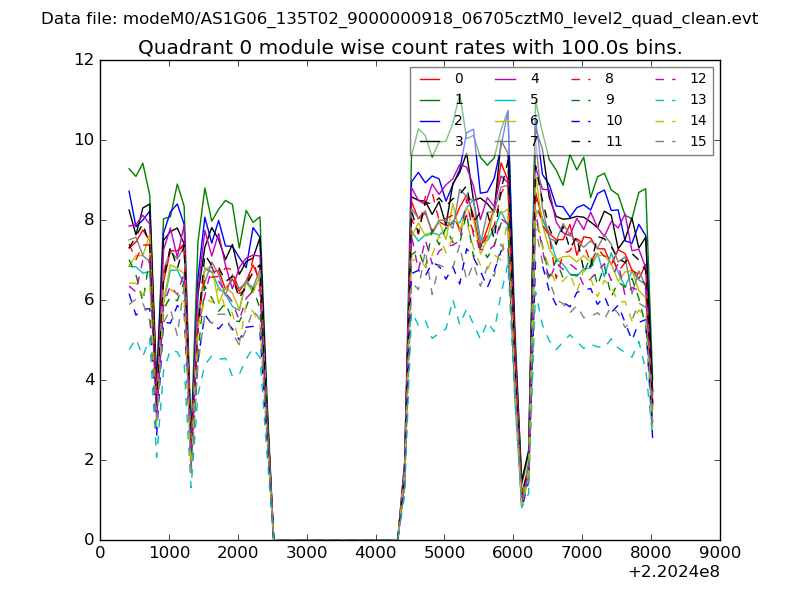
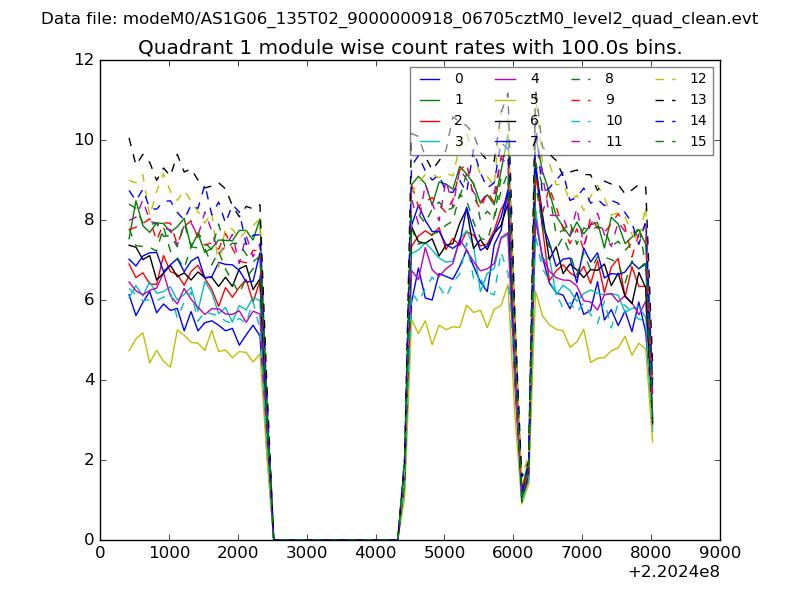
| Module-wise count rates for Quadrant A Data is divided into 100 sec bins |
 |
 |
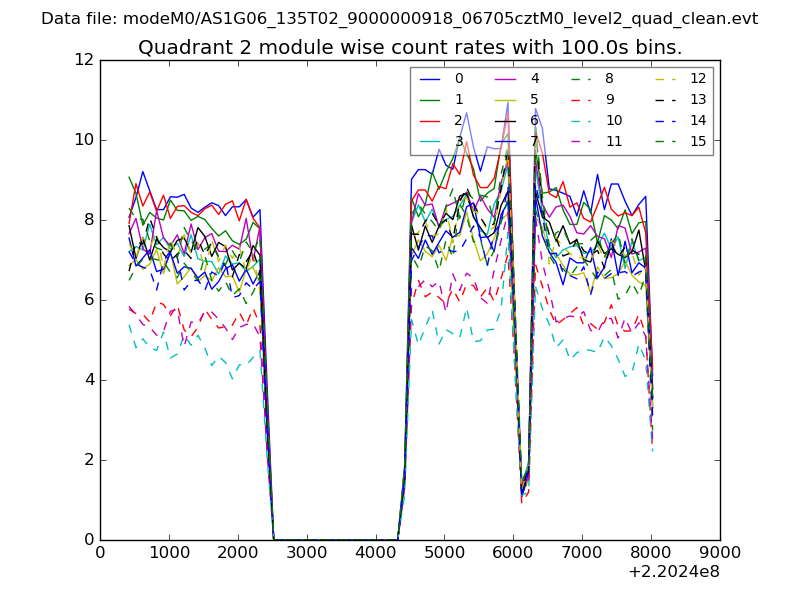
| Module-wise count rates for Quadrant B Data is divided into 100 sec bins |
 |
 |
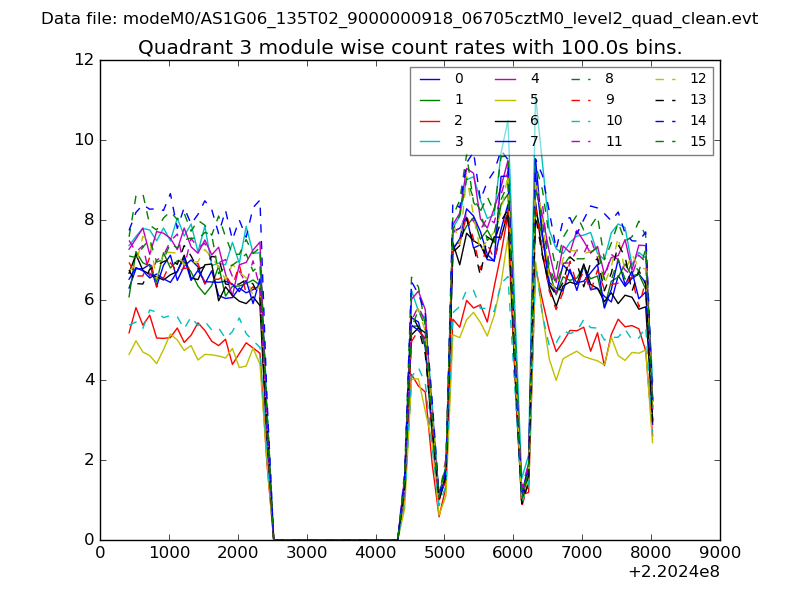
| Module-wise count rates for Quadrant C Data is divided into 100 sec bins |
 |
 |
| Module-wise count rates for Quadrant D Data is divided into 100 sec bins |
 |
 |
| Parameter | Plot |
|---|---|
| CZT HV Monitor | 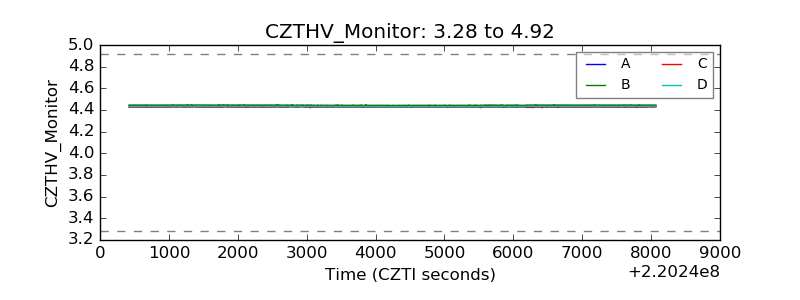 |
| D_VDD | 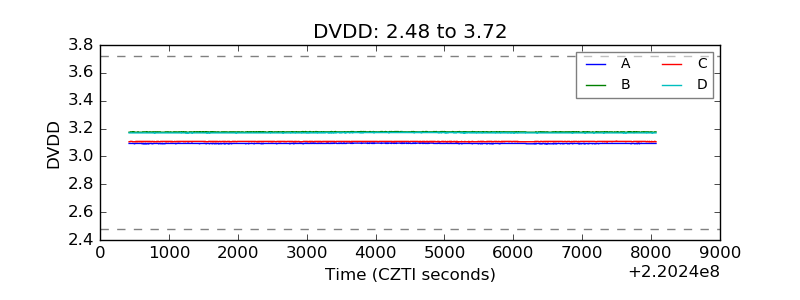 |
| Temperature 1 | 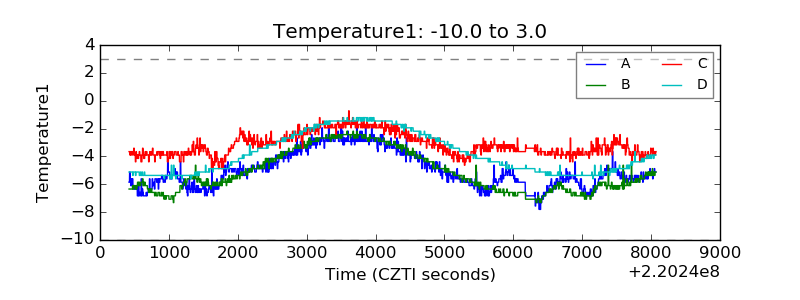 |
| Veto HV Monitor | 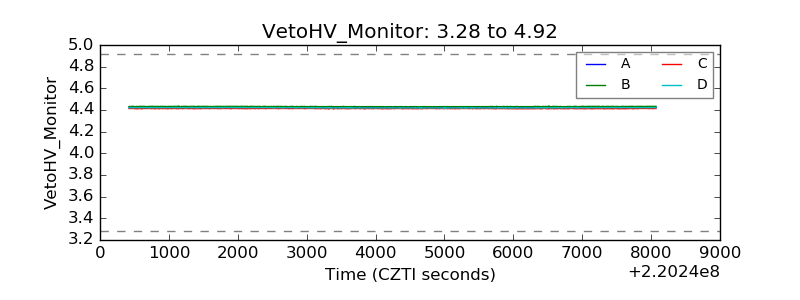 |
| Veto LLD | 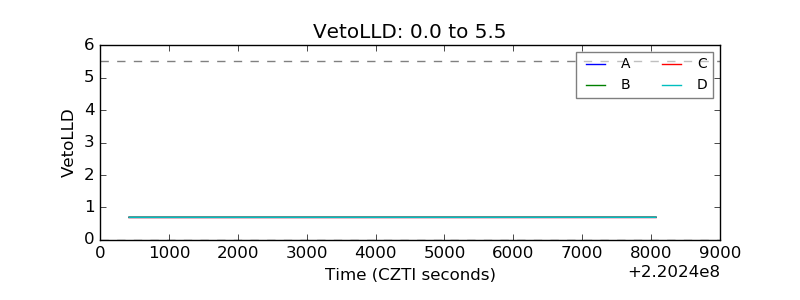 |
| Alpha Counter | 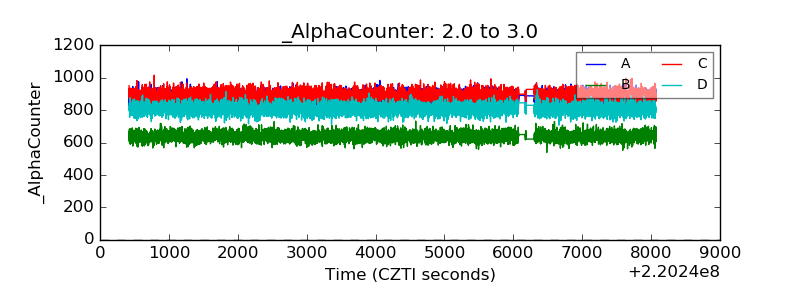 |
| _CPM_Rate | 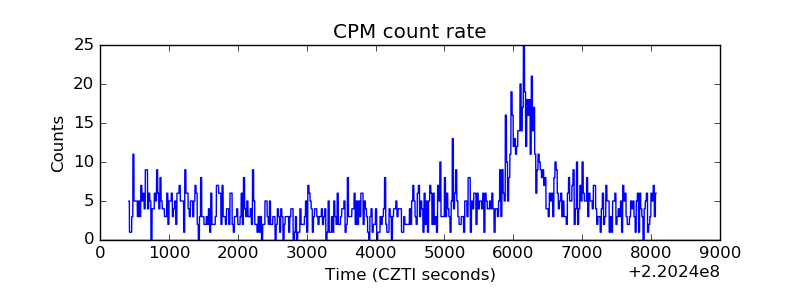 |
| CZT Counter | 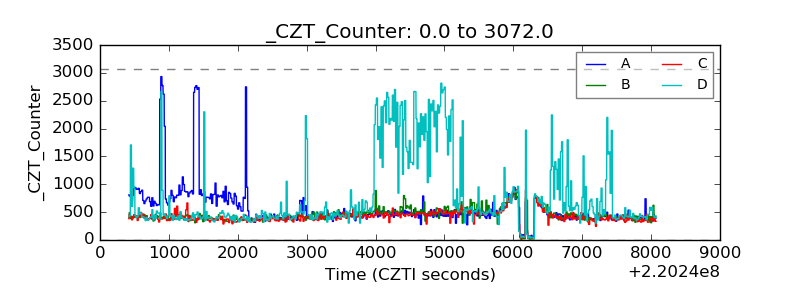 |
| +2.5 Volts monitor | 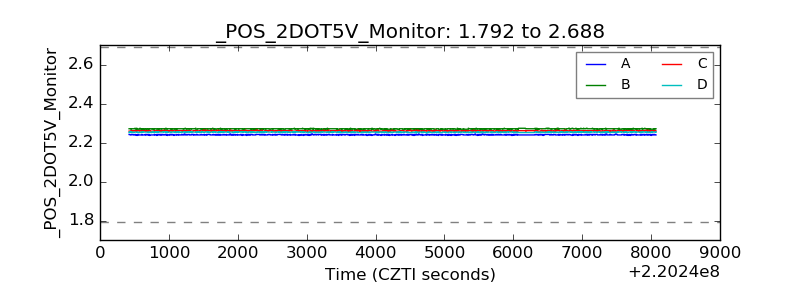 |
| +5 Volts monitor | 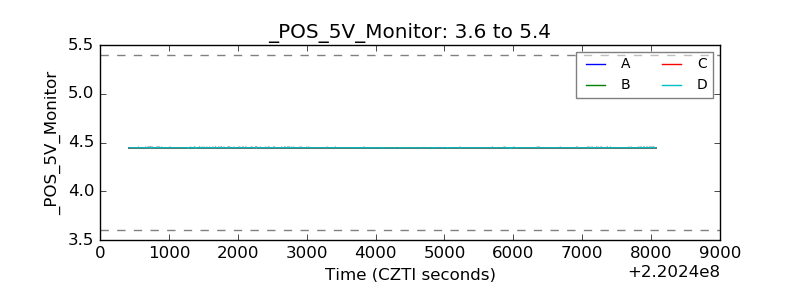 |
| _ROLL_ROT | 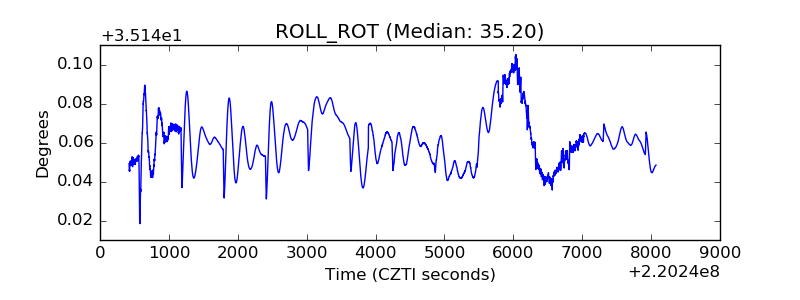 |
| _Roll_DEC | 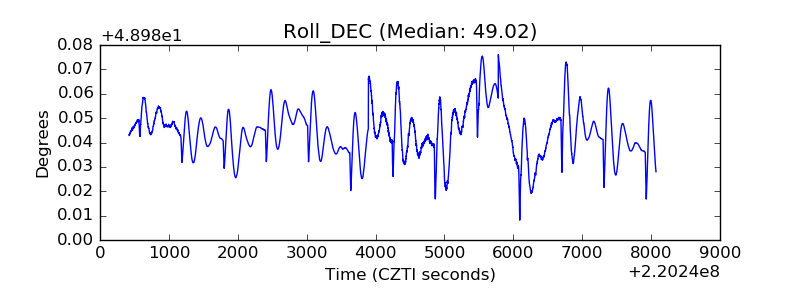 |
| _Roll_RA | 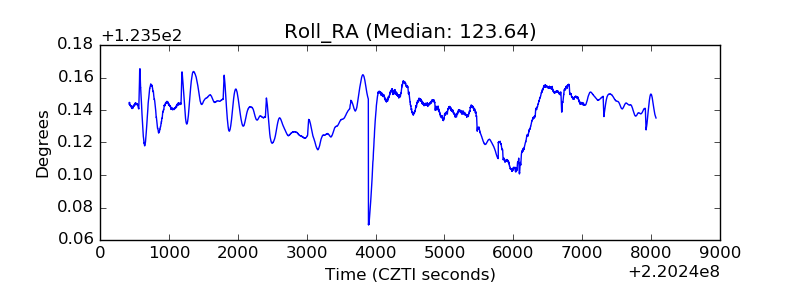 |
| Veto Counter | 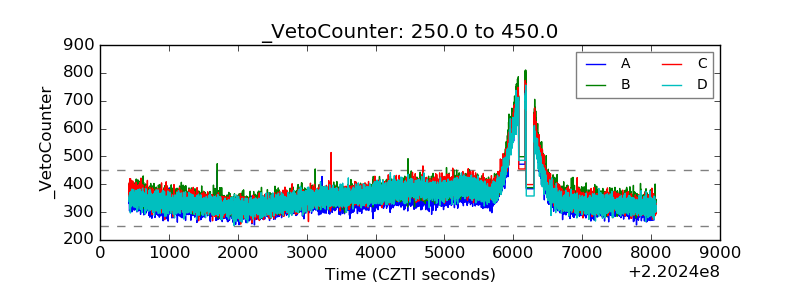 |