| Param | Original file | Final file |
|---|---|---|
| Filename | modeM0/AS1G06_135T02_9000000918_06706cztM0_level2.evt | modeM0/AS1G06_135T02_9000000918_06706cztM0_level2_quad_clean.evt |
| Size (bytes) | 579,075,840 | 86,639,040 |
| Size | 552.2 MB | 82.6 MB |
| Events in quadrant A | 3,867,636 | 549,995 |
| Events in quadrant B | 3,265,550 | 570,192 |
| Events in quadrant C | 3,036,370 | 563,832 |
| Events in quadrant D | 6,898,167 | 457,143 |
| Mode SS | |||
|---|---|---|---|
| Quadrant | BADHDUFLAG | Total packets | Discarded packets |
| A | 0 | 140 | 0 |
| B | 0 | 140 | 0 |
| C | 0 | 140 | 0 |
| D | 0 | 140 | 0 |
| Mode M9 | |||
|---|---|---|---|
| Quadrant | BADHDUFLAG | Total packets | Discarded packets |
| A | 0 | 1 | 0 |
| B | 0 | 1 | 0 |
| C | 0 | 1 | 0 |
| D | 0 | 1 | 0 |
| Mode M0 | |||
|---|---|---|---|
| Quadrant | BADHDUFLAG | Total packets | Discarded packets |
| A | 0 | 16363 | 2 |
| B | 0 | 14665 | 1 |
| C | 0 | 14291 | 1 |
| D | 0 | 25487 | 1 |
| Quadrant | Total seconds | Saturated seconds | Saturation percentage |
|---|---|---|---|
| A | 6913 | 447 | 6.466078% |
| B | 6913 | 185 | 2.676117% |
| C | 6913 | 79 | 1.142774% |
| D | 6913 | 1821 | 26.341675% |
Noise dominated data is calculated using 1-second bins in cleaned event files. If a bin has >2000 counts, and if more than 50% of those come from <1% of pixels, then it is considered to be noise-dominated and hence unusable.
| Quadrant | # 1 sec bins | Bins with >0 counts | Bins with >2000 counts | High rate bins dominated by noise | Noise dominated (total time) | Noise dominated (detector-on time) | Marked lightcurve |
|---|---|---|---|---|---|---|---|
| A | 7013 | 6914 | 101 | 101 | 1.44% | 1.46% | 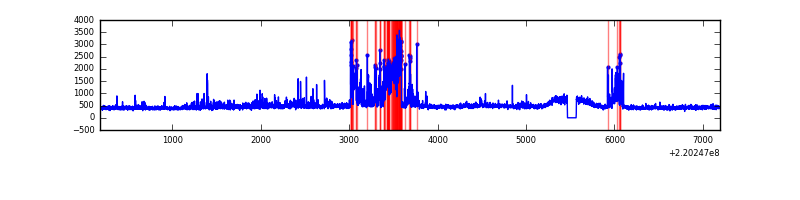 |
| B | 7013 | 6914 | 15 | 15 | 0.21% | 0.22% | 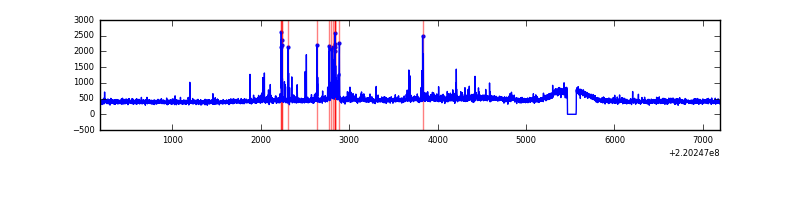 |
| C | 7013 | 6914 | 3 | 3 | 0.04% | 0.04% | 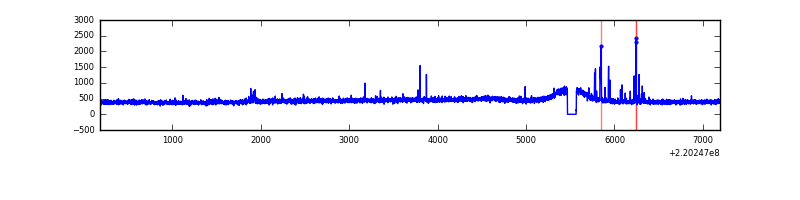 |
| D | 7013 | 6914 | 1343 | 1343 | 19.15% | 19.42% |  |
Top three noisy pixels from each quadrant. If the there are fewer than three noisy pixels in the level2.evt file, extra rows are filled as -1
| Pixel properties | Quadrant properties | ||||||
|---|---|---|---|---|---|---|---|
| Quadrant | DetID | PixID | Counts | Sigma | Mean | Median | Sigma |
| A | 14 | 111 | 630323 | 4011.93 | 765 | 747 | 156.9 |
| A | 8 | 15 | 196795 | 1249.3 | 765 | 747 | 156.9 |
| A | 15 | 234 | 64476 | 406.11 | 765 | 747 | 156.9 |
| B | 0 | 228 | 80347 | 518.75 | 787 | 766 | 153.4 |
| B | 11 | 51 | 68088 | 438.84 | 787 | 766 | 153.4 |
| B | 4 | 170 | 28524 | 180.94 | 787 | 766 | 153.4 |
| C | 9 | 247 | 65312 | 365.85 | 758 | 761 | 176.4 |
| C | 13 | 61 | 5983 | 29.6 | 758 | 761 | 176.4 |
| C | 8 | 128 | 5328 | 25.88 | 758 | 761 | 176.4 |
| D | 2 | 33 | 4108837 | 25765.29 | 641 | 617 | 159.4 |
| D | 8 | 195 | 204938 | 1281.43 | 641 | 617 | 159.4 |
| D | 2 | 14 | 110565 | 689.55 | 641 | 617 | 159.4 |
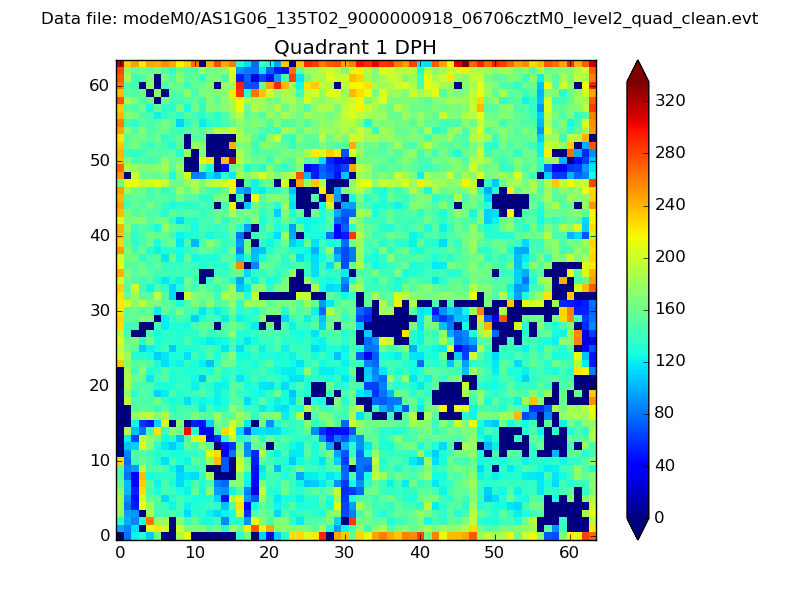
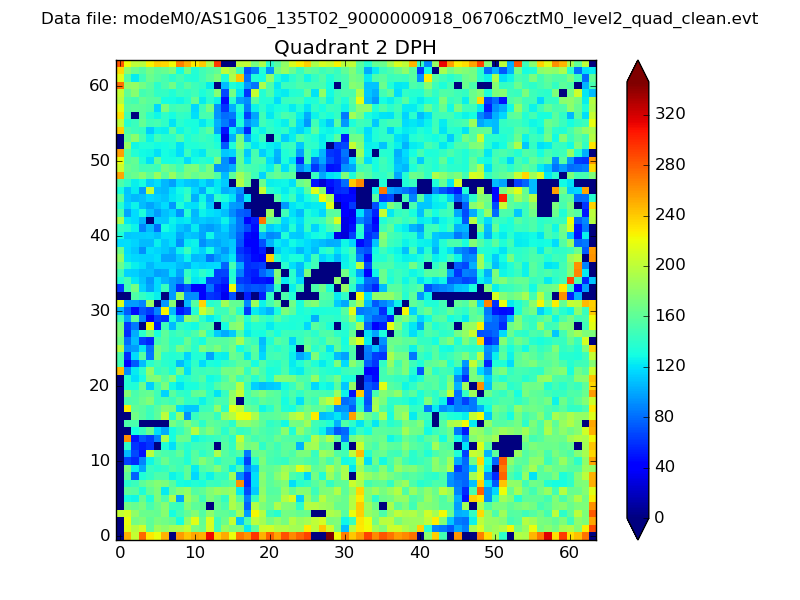
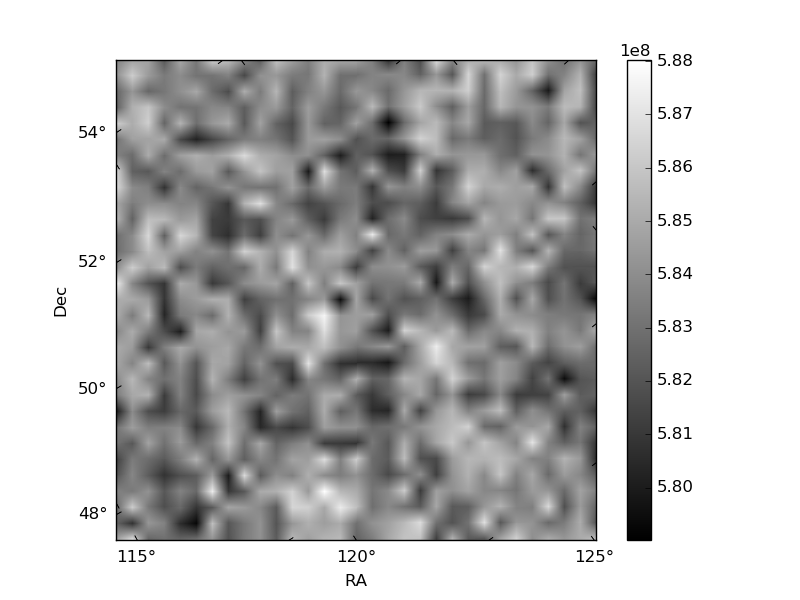
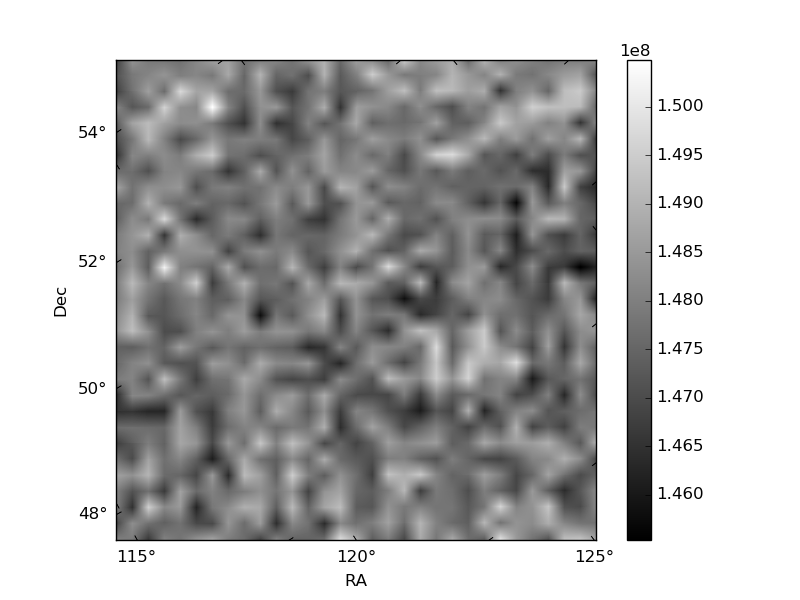
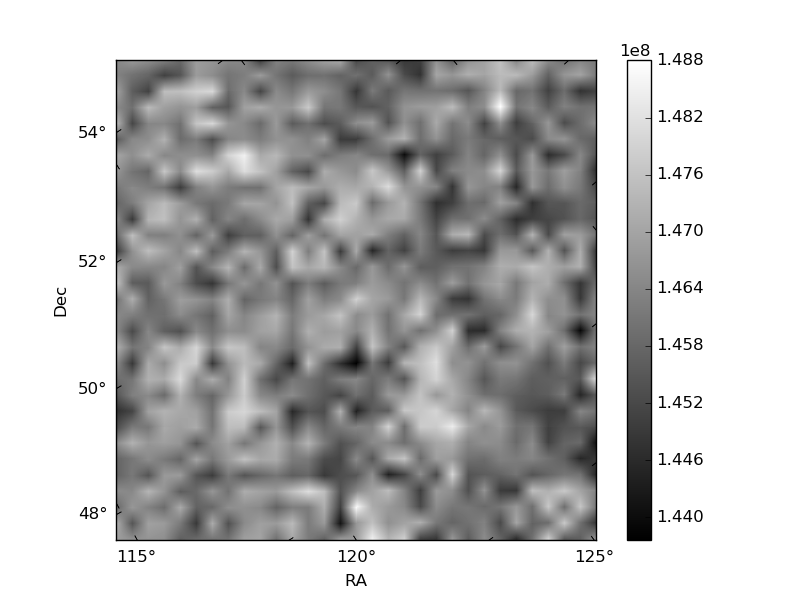
Histogram calculated using DETX and DETY for each event in the final _common_clean file
| Quadrant A | 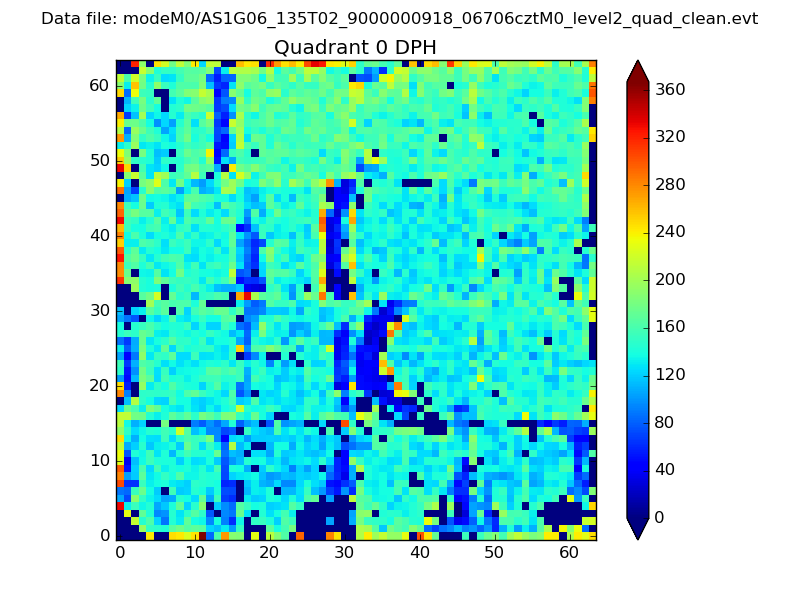 |
 |
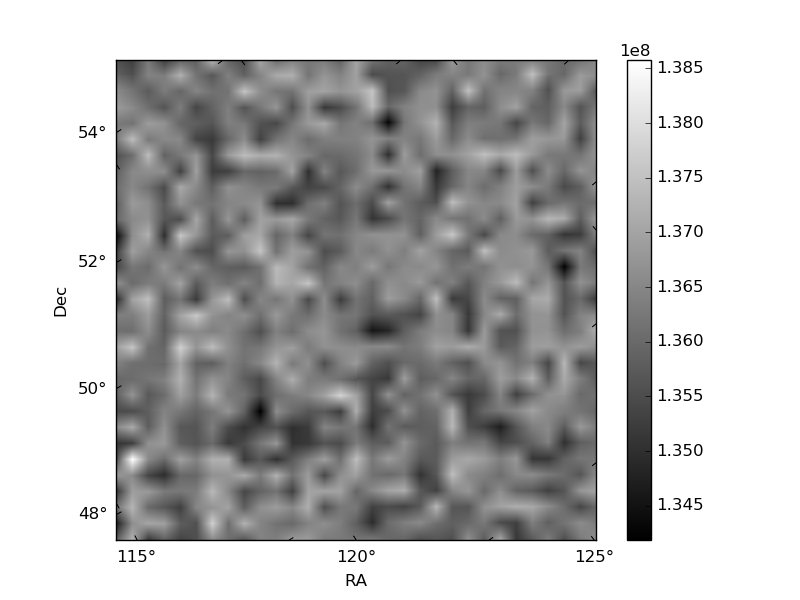
Quadrant B |
|---|---|---|---|
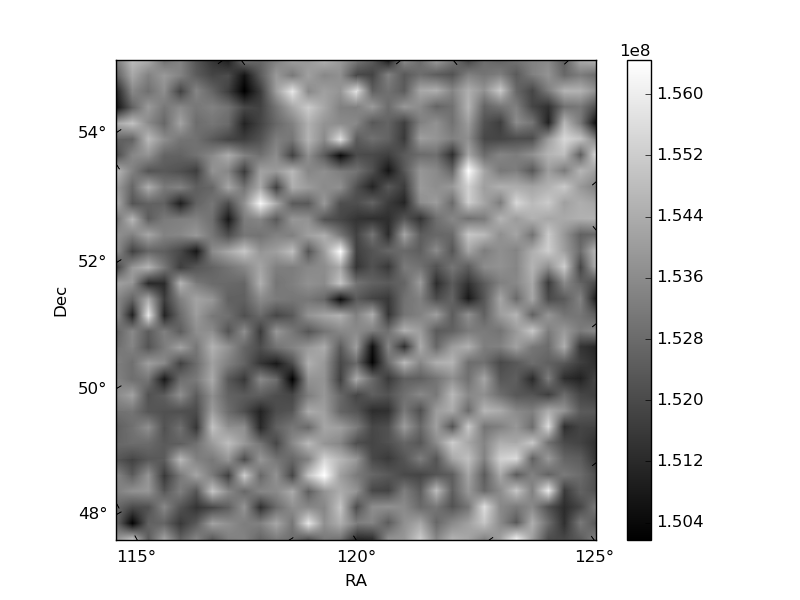
| Quadrant D | 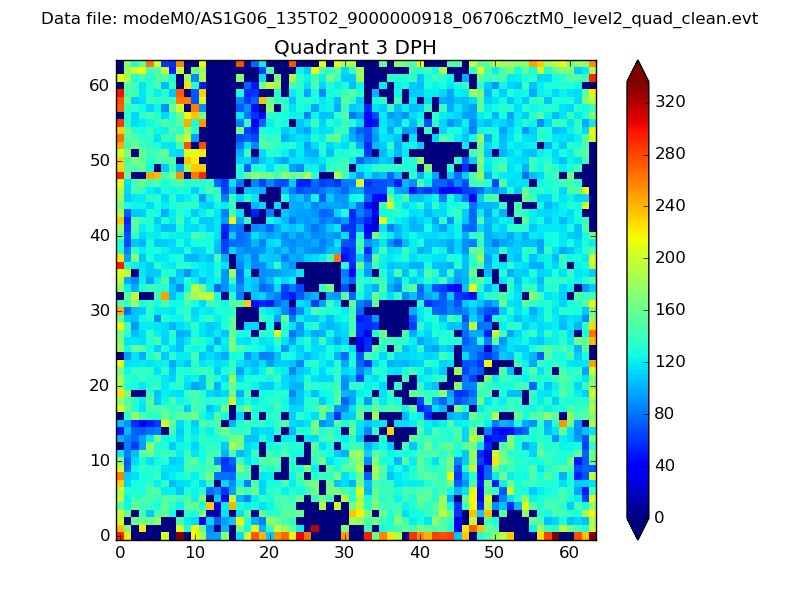 |
 |
Quadrant C |
| Plot type | Count rate plots | Images |
|---|---|---|
| Comparison with Poisson distribution Blue bars denote a histogram of data divided into 1 sec bins. Red curve is a Poisson curve with rate = median count rate of data. |
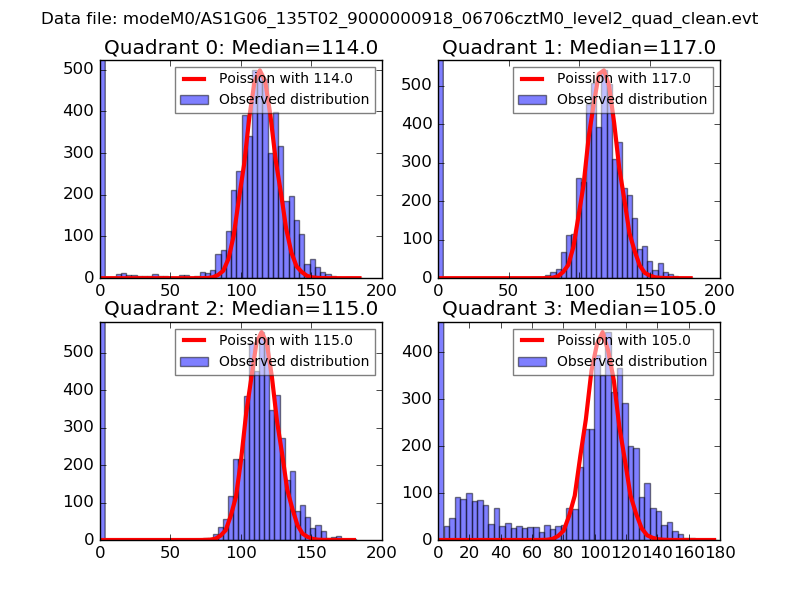 |
 |
| Quadrant-wise count rates Data is divided into 100 sec bins |
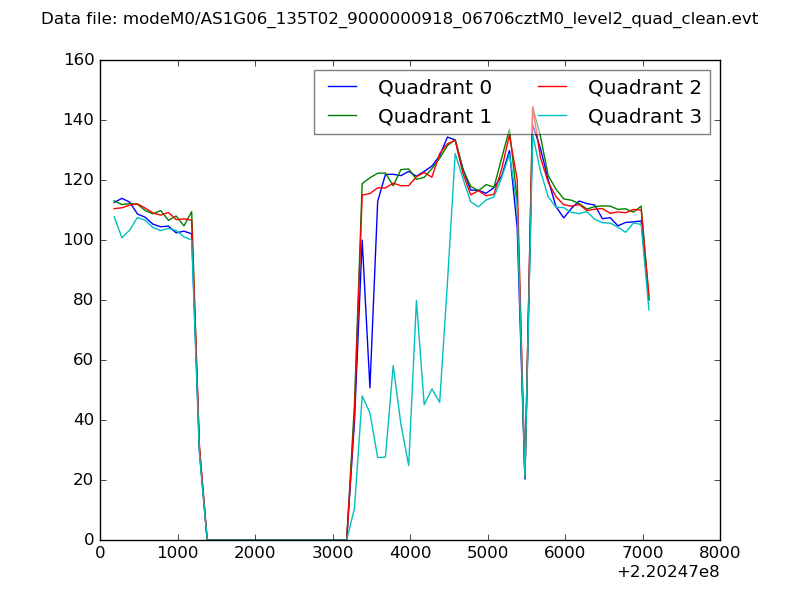 |
|
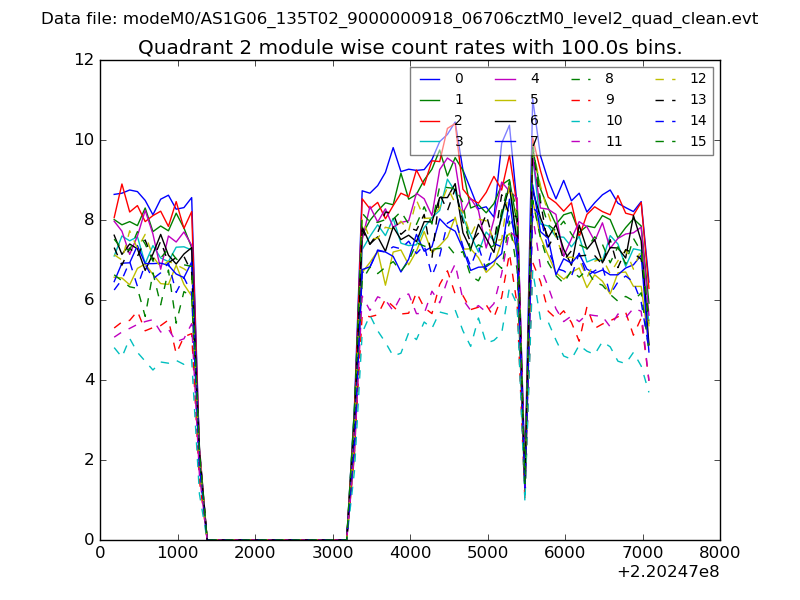
| Module-wise count rates for Quadrant A Data is divided into 100 sec bins |
 |
 |
| Module-wise count rates for Quadrant B Data is divided into 100 sec bins |
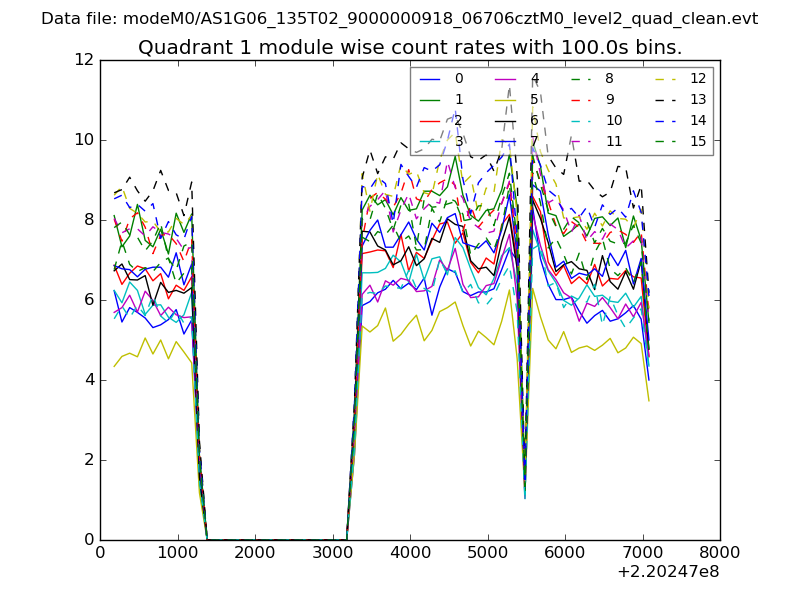 |
 |
| Module-wise count rates for Quadrant C Data is divided into 100 sec bins |
 |
 |
| Module-wise count rates for Quadrant D Data is divided into 100 sec bins |
 |
 |
| Parameter | Plot |
|---|---|
| CZT HV Monitor | 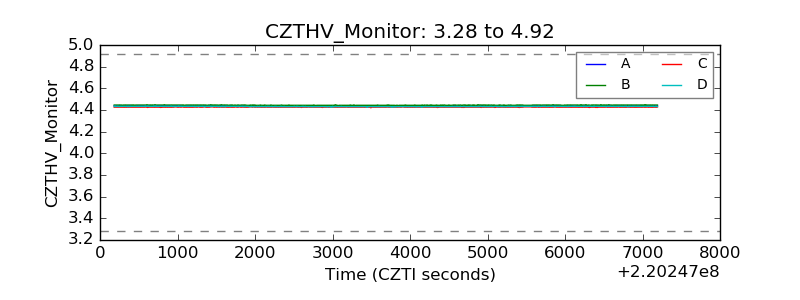 |
| D_VDD | 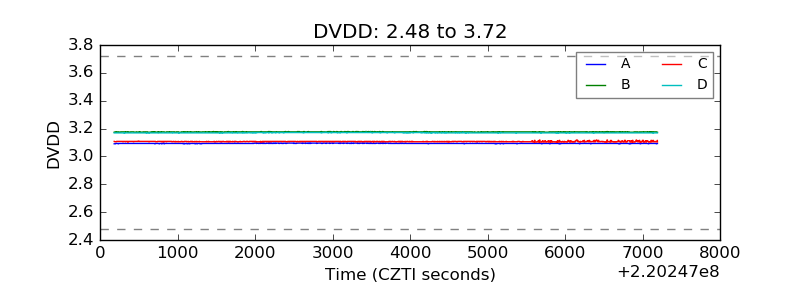 |
| Temperature 1 | 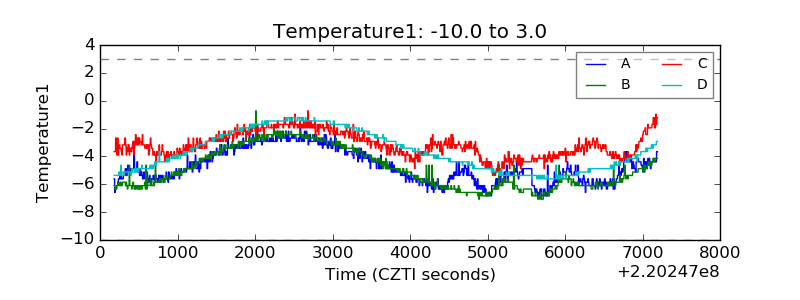 |
| Veto HV Monitor | 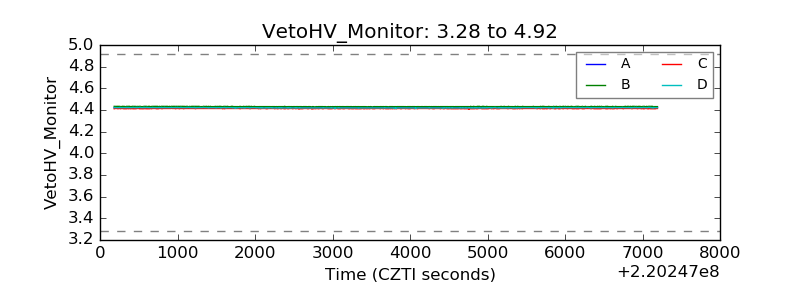 |
| Veto LLD | 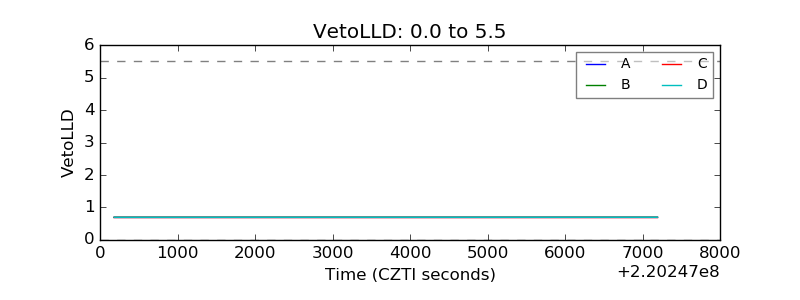 |
| Alpha Counter | 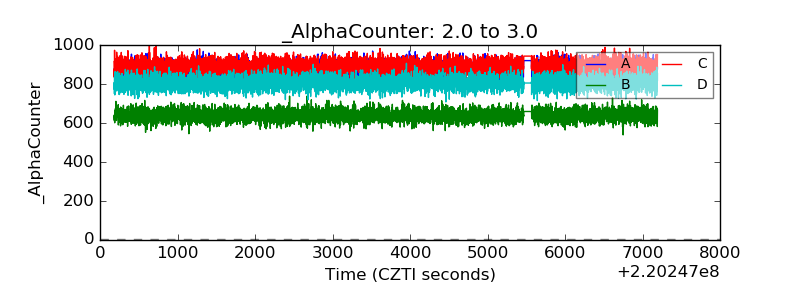 |
| _CPM_Rate | 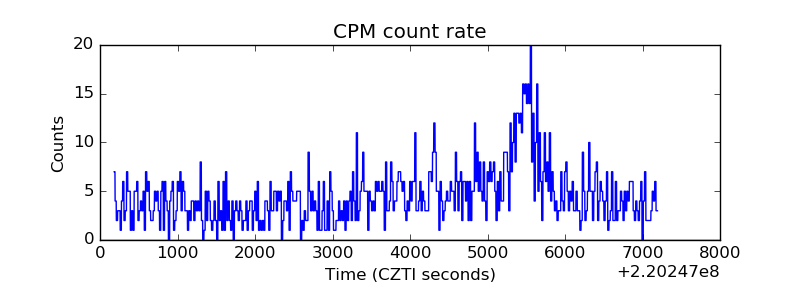 |
| CZT Counter | 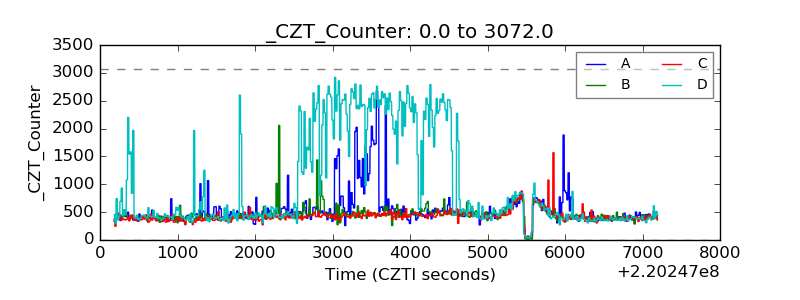 |
| +2.5 Volts monitor |  |
| +5 Volts monitor |  |
| _ROLL_ROT |  |
| _Roll_DEC | 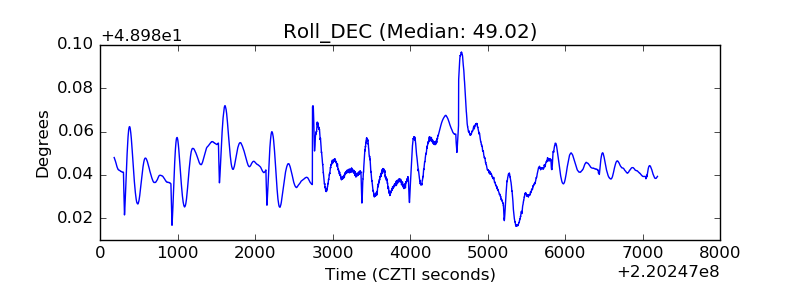 |
| _Roll_RA | 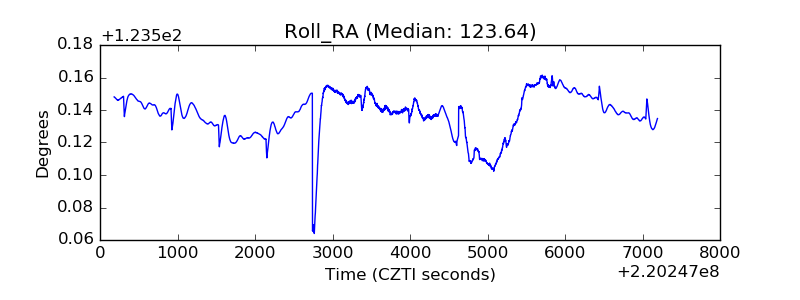 |
| Veto Counter | 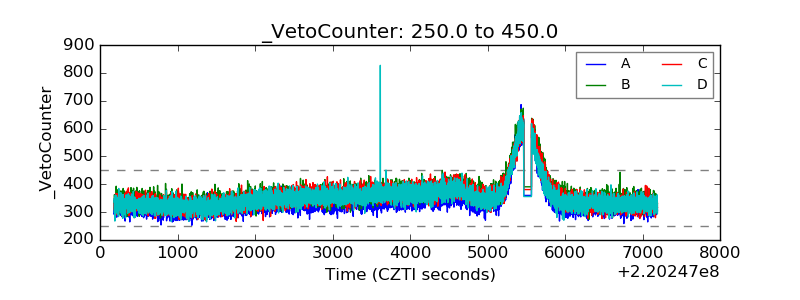 |