| Param | Original file | Final file |
|---|---|---|
| Filename | modeM0/AS1G06_135T02_9000000918_06707cztM0_level2.evt | modeM0/AS1G06_135T02_9000000918_06707cztM0_level2_quad_clean.evt |
| Size (bytes) | 253,644,480 | 25,660,800 |
| Size | 241.9 MB | 24.5 MB |
| Events in quadrant A | 1,978,360 | 139,785 |
| Events in quadrant B | 1,462,771 | 142,576 |
| Events in quadrant C | 1,344,351 | 139,893 |
| Events in quadrant D | 2,670,348 | 120,066 |
| Mode SS | |||
|---|---|---|---|
| Quadrant | BADHDUFLAG | Total packets | Discarded packets |
| A | 0 | 66 | 0 |
| B | 0 | 66 | 0 |
| C | 0 | 66 | 0 |
| D | 0 | 66 | 0 |
| Mode M0 | |||
|---|---|---|---|
| Quadrant | BADHDUFLAG | Total packets | Discarded packets |
| A | 0 | 8237 | 1 |
| B | 0 | 6719 | 0 |
| C | 0 | 6588 | 0 |
| D | 0 | 10389 | 0 |
| Quadrant | Total seconds | Saturated seconds | Saturation percentage |
|---|---|---|---|
| A | 3295 | 169 | 5.128983% |
| B | 3295 | 3 | 0.091047% |
| C | 3295 | 2 | 0.060698% |
| D | 3295 | 436 | 13.232170% |
Noise dominated data is calculated using 1-second bins in cleaned event files. If a bin has >2000 counts, and if more than 50% of those come from <1% of pixels, then it is considered to be noise-dominated and hence unusable.
| Quadrant | # 1 sec bins | Bins with >0 counts | Bins with >2000 counts | High rate bins dominated by noise | Noise dominated (total time) | Noise dominated (detector-on time) | Marked lightcurve |
|---|---|---|---|---|---|---|---|
| A | 3295 | 3295 | 50 | 50 | 1.52% | 1.52% | 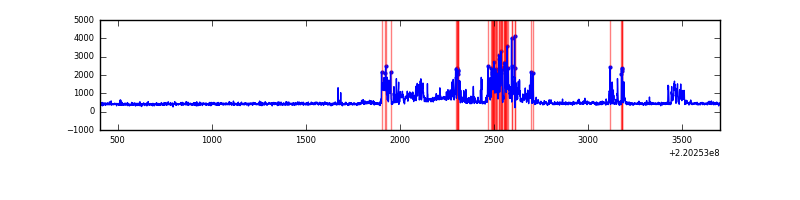 |
| B | 3295 | 3295 | 1 | 1 | 0.03% | 0.03% | 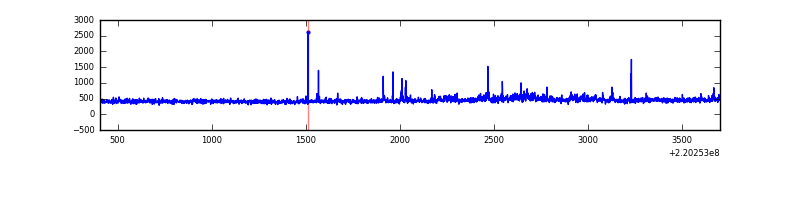 |
| C | 3295 | 3295 | 0 | 0 | 0.00% | 0.00% | 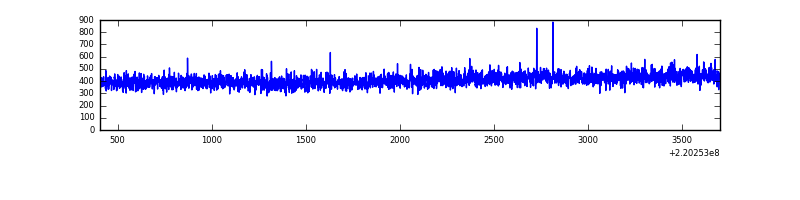 |
| D | 3295 | 3295 | 349 | 349 | 10.59% | 10.59% | 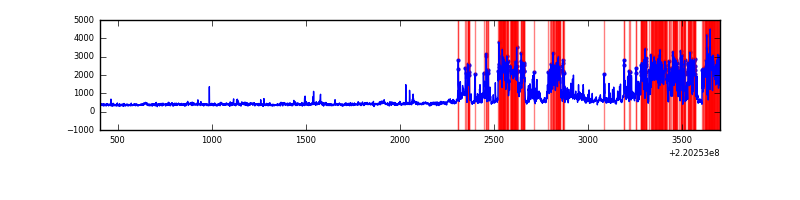 |
Top three noisy pixels from each quadrant. If the there are fewer than three noisy pixels in the level2.evt file, extra rows are filled as -1
| Pixel properties | Quadrant properties | ||||||
|---|---|---|---|---|---|---|---|
| Quadrant | DetID | PixID | Counts | Sigma | Mean | Median | Sigma |
| A | 14 | 111 | 578945 | 7964.84 | 350 | 343 | 72.6 |
| A | 8 | 15 | 49789 | 680.66 | 350 | 343 | 72.6 |
| A | 0 | 226 | 3246 | 39.96 | 350 | 343 | 72.6 |
| B | 0 | 214 | 47201 | 665.15 | 356 | 348 | 70.4 |
| B | 11 | 51 | 15257 | 211.65 | 356 | 348 | 70.4 |
| B | 4 | 173 | 8081 | 109.78 | 356 | 348 | 70.4 |
| C | 8 | 128 | 6742 | 79.21 | 340 | 340 | 80.8 |
| C | 8 | 112 | 3848 | 43.4 | 340 | 340 | 80.8 |
| C | 13 | 61 | 2824 | 30.73 | 340 | 340 | 80.8 |
| D | 2 | 33 | 1205729 | 14685.33 | 325 | 315 | 82.1 |
| D | 8 | 195 | 171824 | 2089.46 | 325 | 315 | 82.1 |
| D | 2 | 152 | 21542 | 258.6 | 325 | 315 | 82.1 |
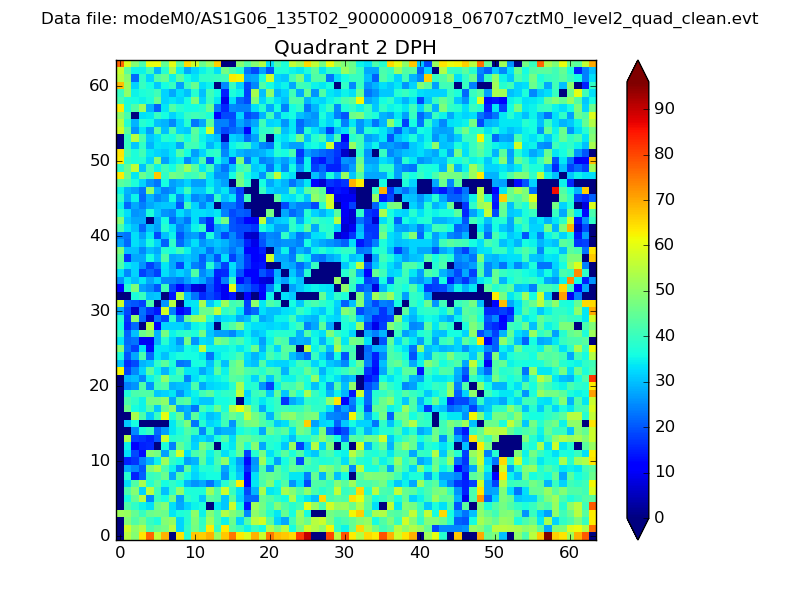
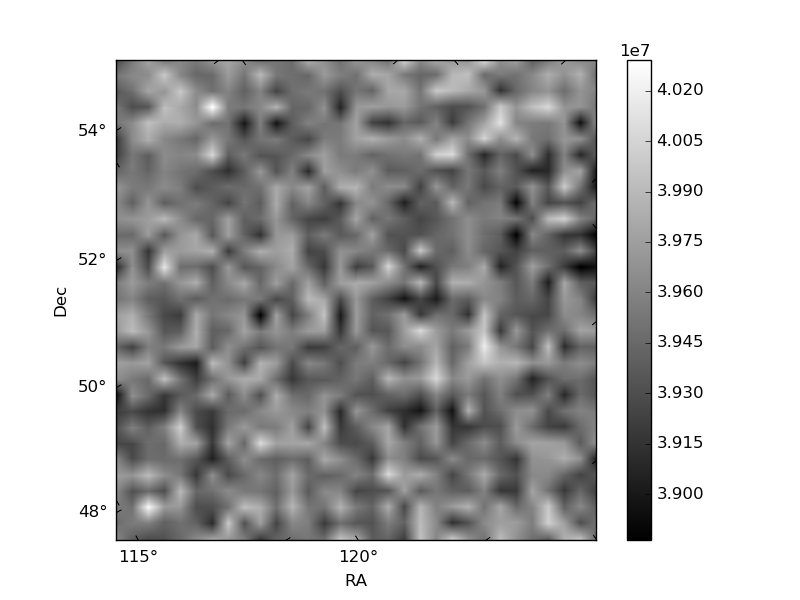
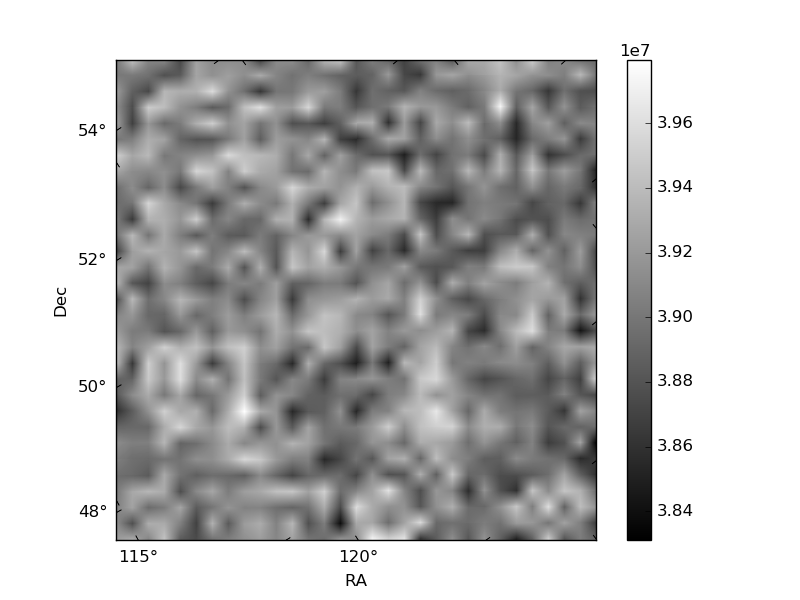
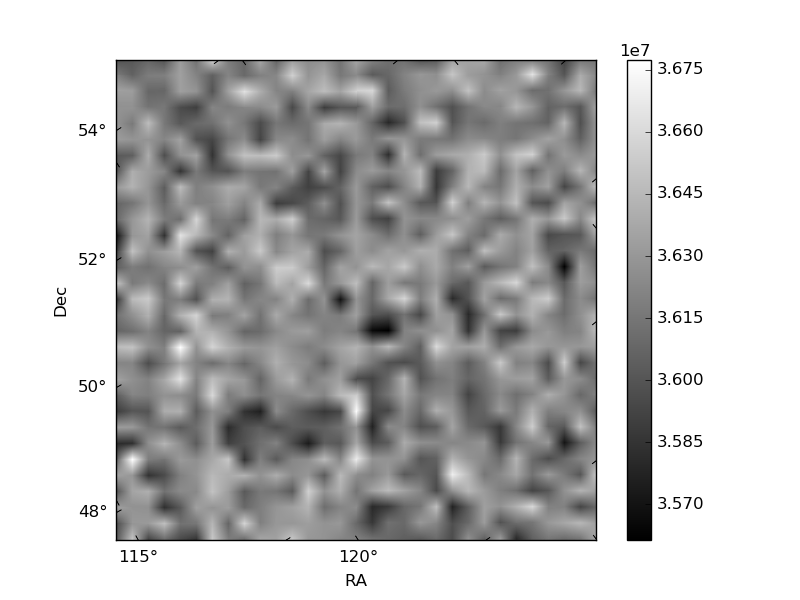
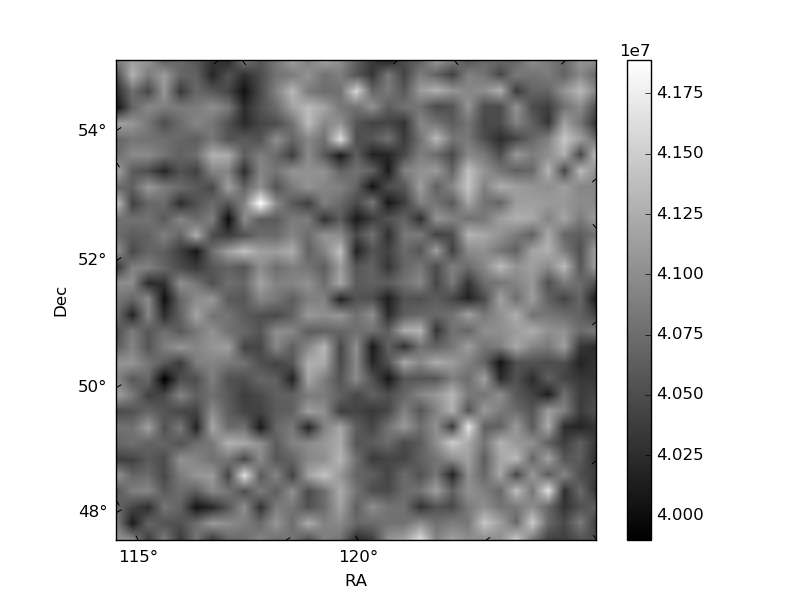
Histogram calculated using DETX and DETY for each event in the final _common_clean file
| Quadrant A | 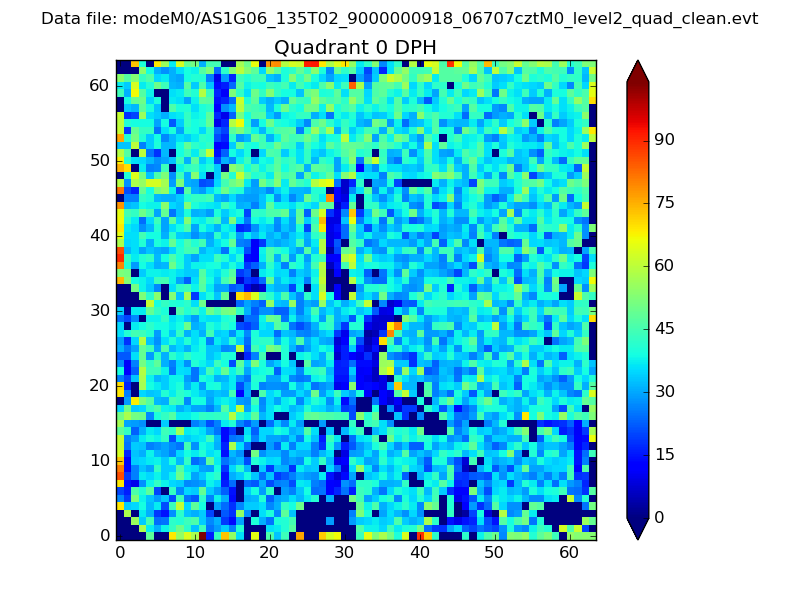 |
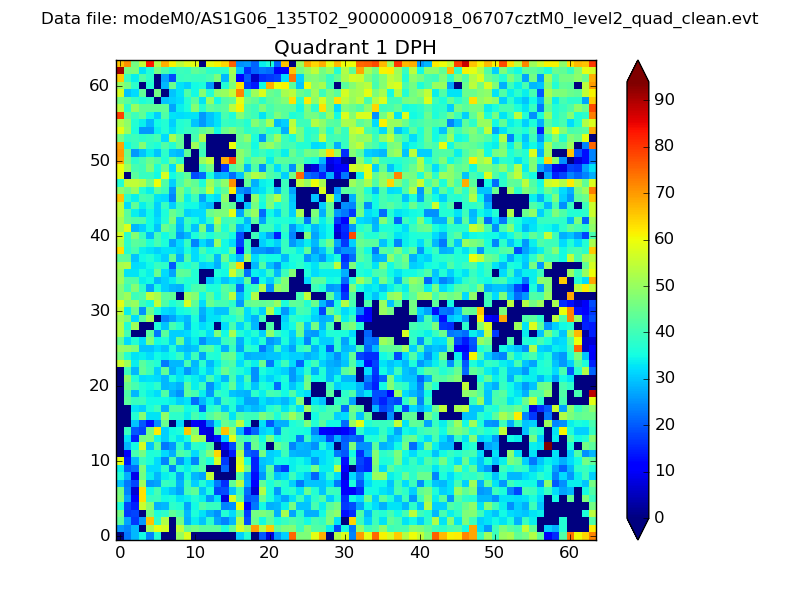 |
Quadrant B |
|---|---|---|---|
| Quadrant D | 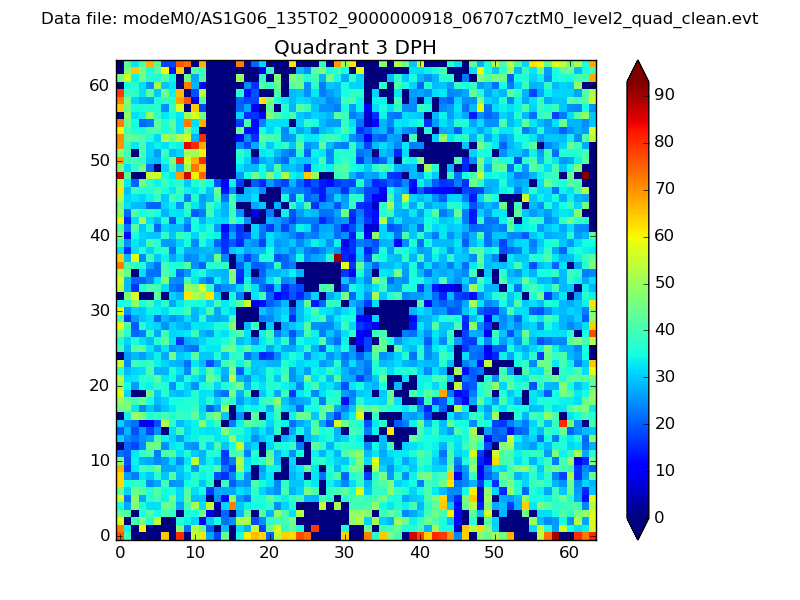 |
 |
Quadrant C |
| Plot type | Count rate plots | Images |
|---|---|---|
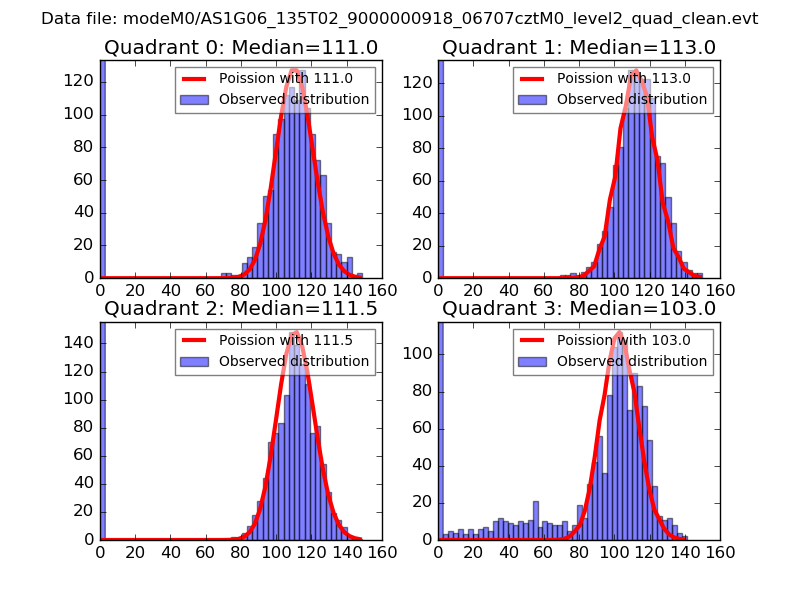
| Comparison with Poisson distribution Blue bars denote a histogram of data divided into 1 sec bins. Red curve is a Poisson curve with rate = median count rate of data. |
 |
 |
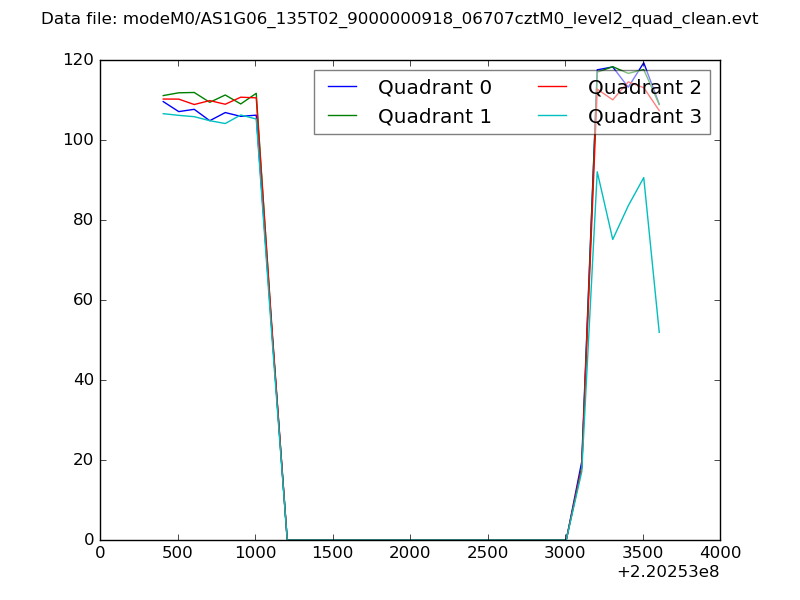
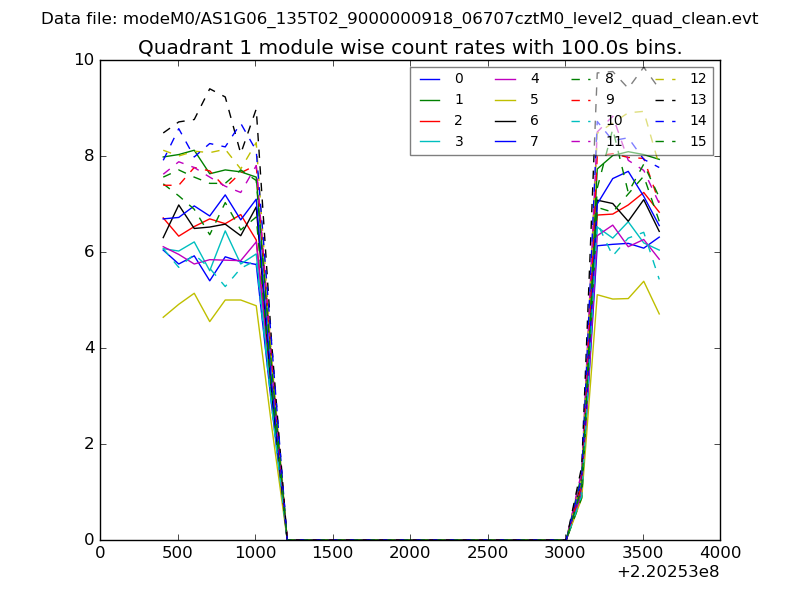
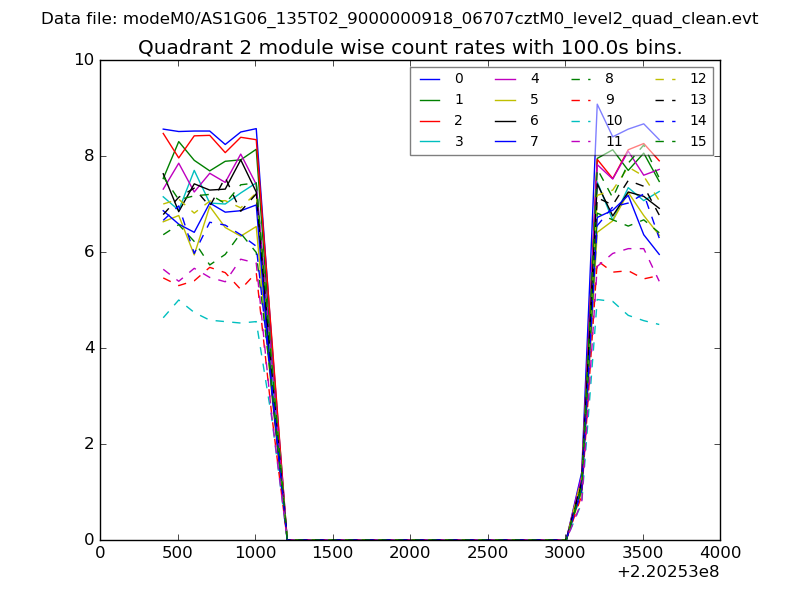
| Quadrant-wise count rates Data is divided into 100 sec bins |
 |
|
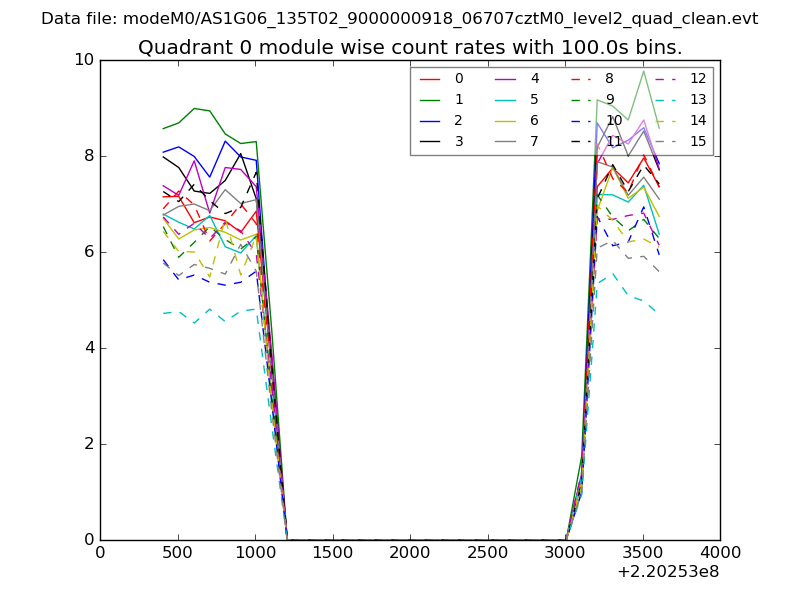
| Module-wise count rates for Quadrant A Data is divided into 100 sec bins |
 |
 |
| Module-wise count rates for Quadrant B Data is divided into 100 sec bins |
 |
 |
| Module-wise count rates for Quadrant C Data is divided into 100 sec bins |
 |
 |
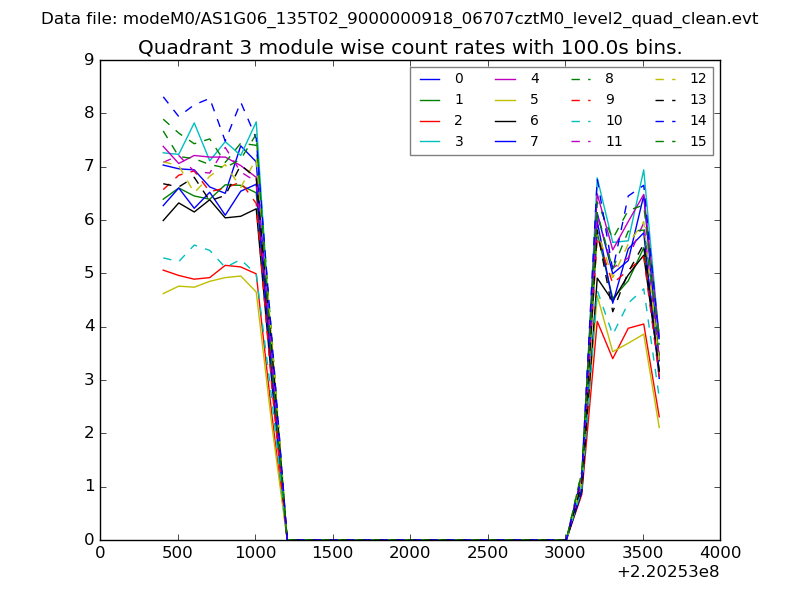
| Module-wise count rates for Quadrant D Data is divided into 100 sec bins |
 |
 |
| Parameter | Plot |
|---|---|
| CZT HV Monitor | 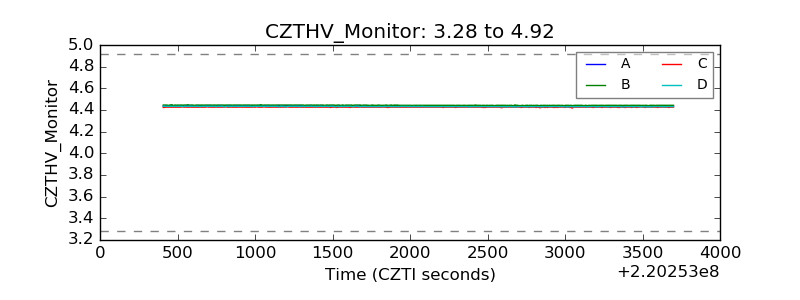 |
| D_VDD | 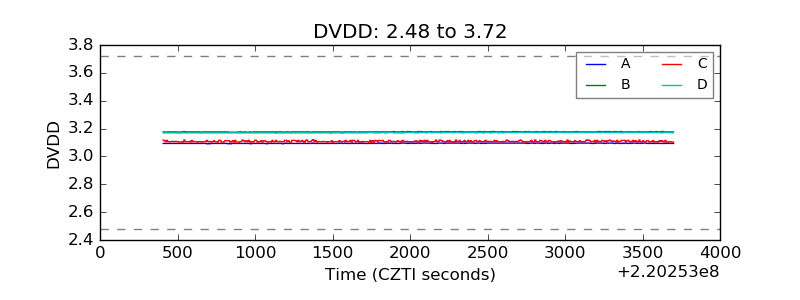 |
| Temperature 1 | 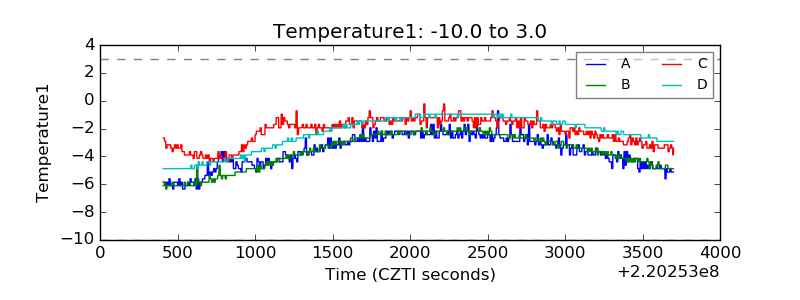 |
| Veto HV Monitor | 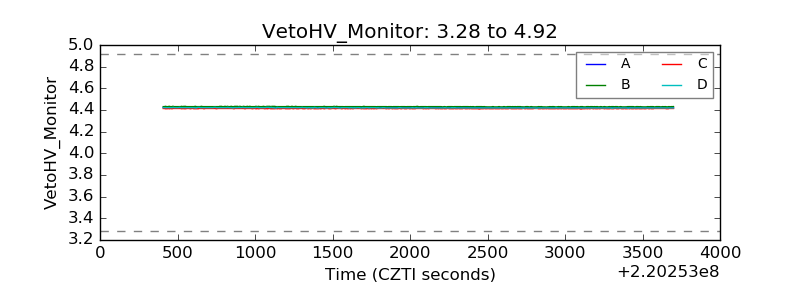 |
| Veto LLD | 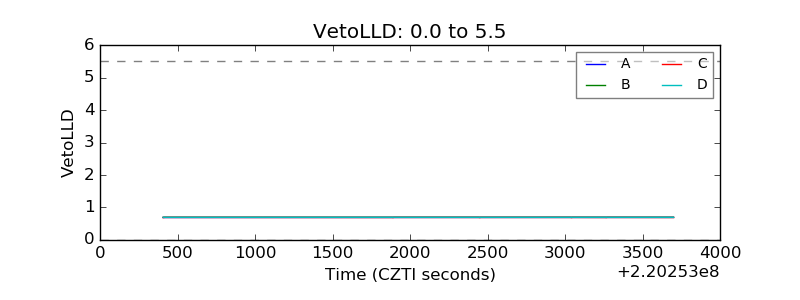 |
| Alpha Counter | 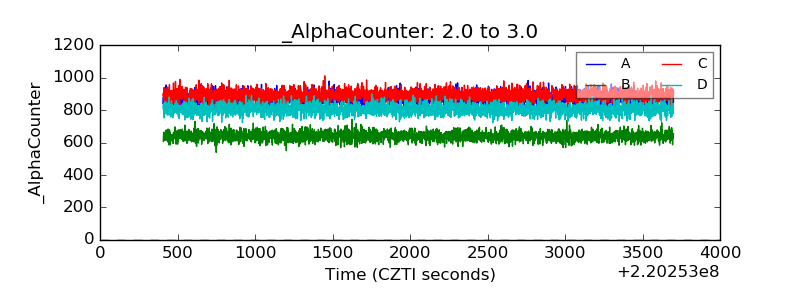 |
| _CPM_Rate | 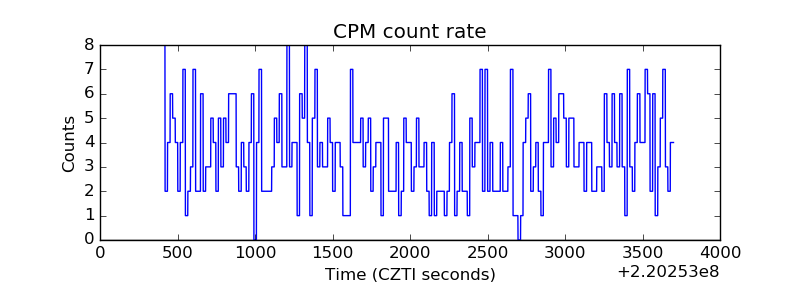 |
| CZT Counter | 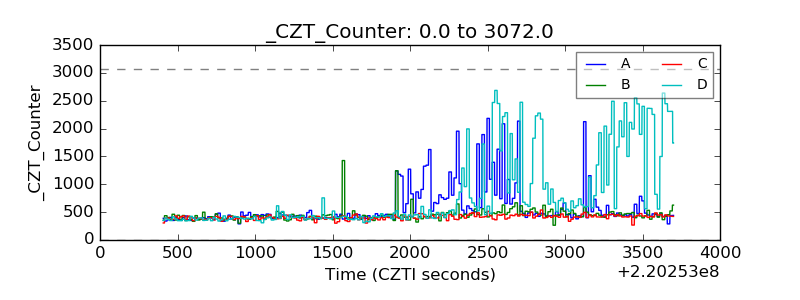 |
| +2.5 Volts monitor | 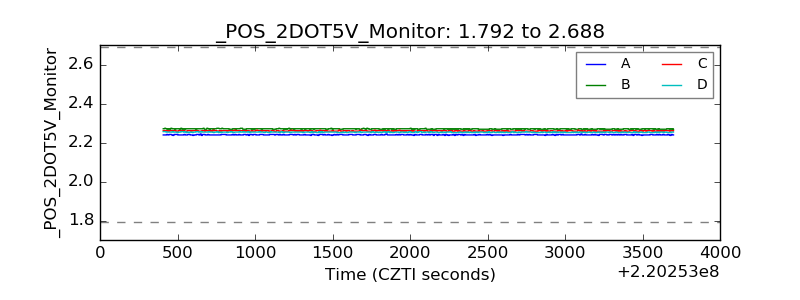 |
| +5 Volts monitor | 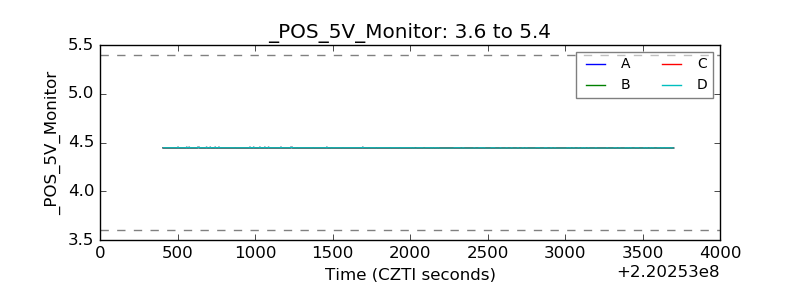 |
| _ROLL_ROT | 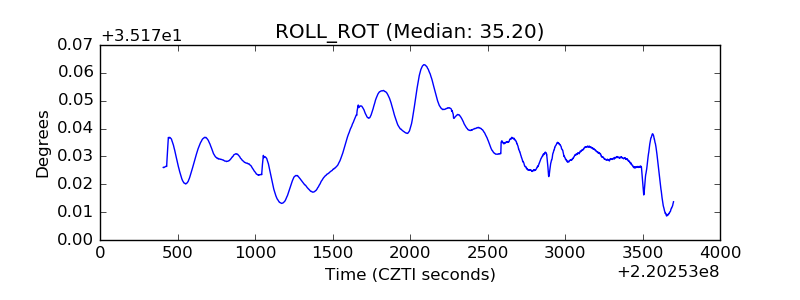 |
| _Roll_DEC | 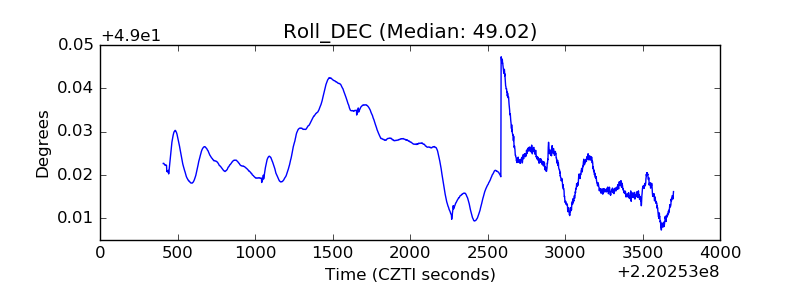 |
| _Roll_RA | 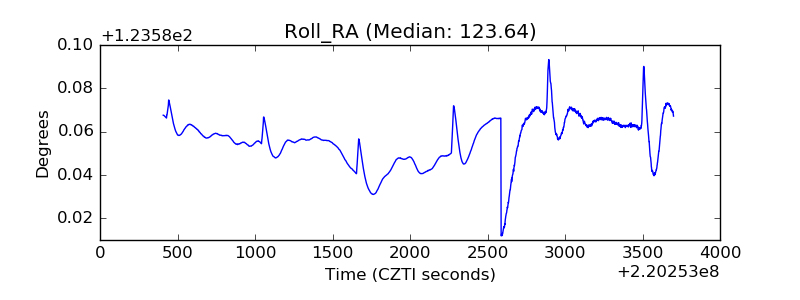 |
| Veto Counter | 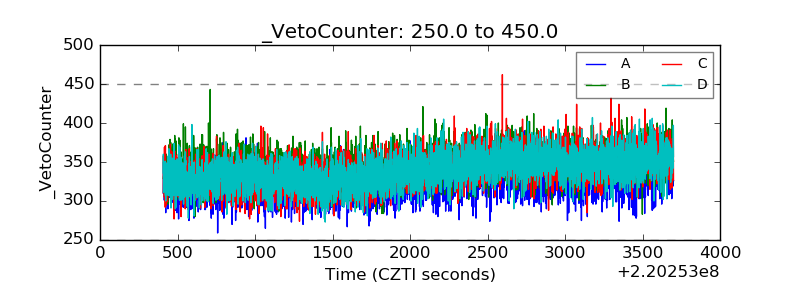 |