| Param | Original file | Final file |
|---|---|---|
| Filename | modeM0/AS1G06_135T02_9000000918_06710cztM0_level2.evt | modeM0/AS1G06_135T02_9000000918_06710cztM0_level2_quad_clean.evt |
| Size (bytes) | 185,120,640 | 29,427,840 |
| Size | 176.5 MB | 28.1 MB |
| Events in quadrant A | 1,089,102 | 197,177 |
| Events in quadrant B | 997,645 | 197,409 |
| Events in quadrant C | 898,008 | 193,561 |
| Events in quadrant D | 2,482,440 | 156,086 |
| Mode SS | |||
|---|---|---|---|
| Quadrant | BADHDUFLAG | Total packets | Discarded packets |
| A | 0 | 40 | 0 |
| B | 0 | 40 | 0 |
| C | 0 | 40 | 0 |
| D | 0 | 40 | 0 |
| Mode M0 | |||
|---|---|---|---|
| Quadrant | BADHDUFLAG | Total packets | Discarded packets |
| A | 0 | 4570 | 0 |
| B | 0 | 4253 | 0 |
| C | 0 | 4034 | 0 |
| D | 0 | 8774 | 0 |
| Quadrant | Total seconds | Saturated seconds | Saturation percentage |
|---|---|---|---|
| A | 2014 | 22 | 1.092354% |
| B | 2014 | 14 | 0.695134% |
| C | 2014 | 1 | 0.049652% |
| D | 2014 | 559 | 27.755710% |
Noise dominated data is calculated using 1-second bins in cleaned event files. If a bin has >2000 counts, and if more than 50% of those come from <1% of pixels, then it is considered to be noise-dominated and hence unusable.
| Quadrant | # 1 sec bins | Bins with >0 counts | Bins with >2000 counts | High rate bins dominated by noise | Noise dominated (total time) | Noise dominated (detector-on time) | Marked lightcurve |
|---|---|---|---|---|---|---|---|
| A | 2014 | 2014 | 7 | 7 | 0.35% | 0.35% | 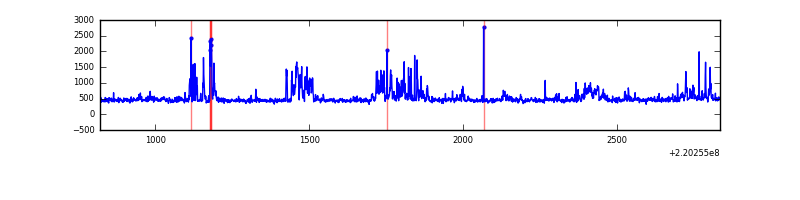 |
| B | 2014 | 2014 | 7 | 7 | 0.35% | 0.35% | 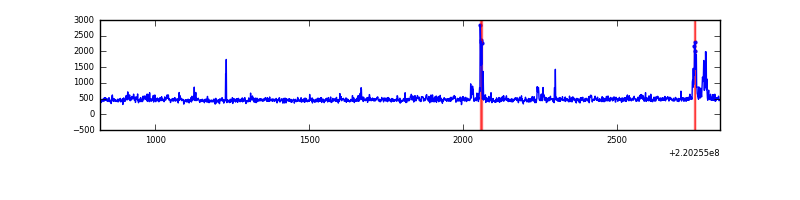 |
| C | 2014 | 2014 | 0 | 0 | 0.00% | 0.00% | 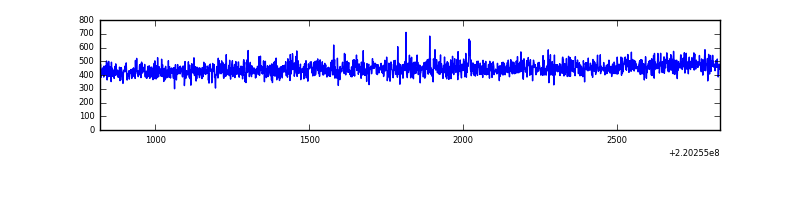 |
| D | 2014 | 2014 | 457 | 457 | 22.69% | 22.69% | 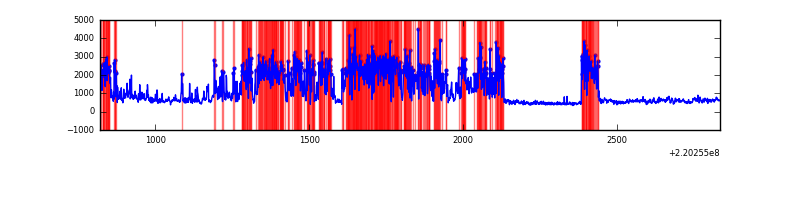 |
Top three noisy pixels from each quadrant. If the there are fewer than three noisy pixels in the level2.evt file, extra rows are filled as -1
| Pixel properties | Quadrant properties | ||||||
|---|---|---|---|---|---|---|---|
| Quadrant | DetID | PixID | Counts | Sigma | Mean | Median | Sigma |
| A | 14 | 111 | 195929 | 4035.31 | 227 | 221 | 48.5 |
| A | 8 | 15 | 9610 | 193.59 | 227 | 221 | 48.5 |
| A | 4 | 2 | 8354 | 167.69 | 227 | 221 | 48.5 |
| B | 0 | 214 | 39193 | 840.03 | 231 | 225 | 46.4 |
| B | 0 | 228 | 38600 | 827.25 | 231 | 225 | 46.4 |
| B | 11 | 51 | 18116 | 385.68 | 231 | 225 | 46.4 |
| C | 8 | 128 | 3991 | 67.99 | 227 | 227 | 55.4 |
| C | 9 | 247 | 2472 | 40.55 | 227 | 227 | 55.4 |
| C | 8 | 112 | 2168 | 35.06 | 227 | 227 | 55.4 |
| D | 2 | 33 | 1538040 | 30451.32 | 198 | 191 | 50.5 |
| D | 8 | 195 | 169116 | 3344.92 | 198 | 191 | 50.5 |
| D | 2 | 152 | 16268 | 318.34 | 198 | 191 | 50.5 |
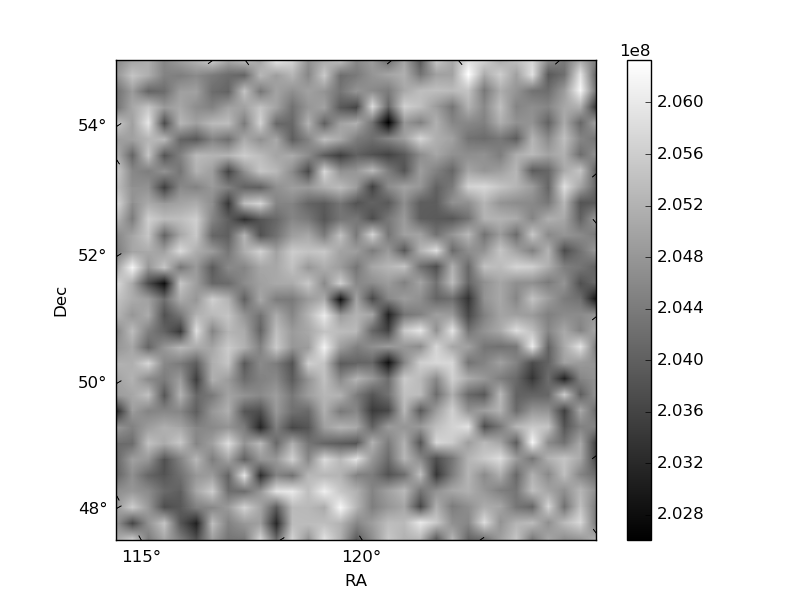
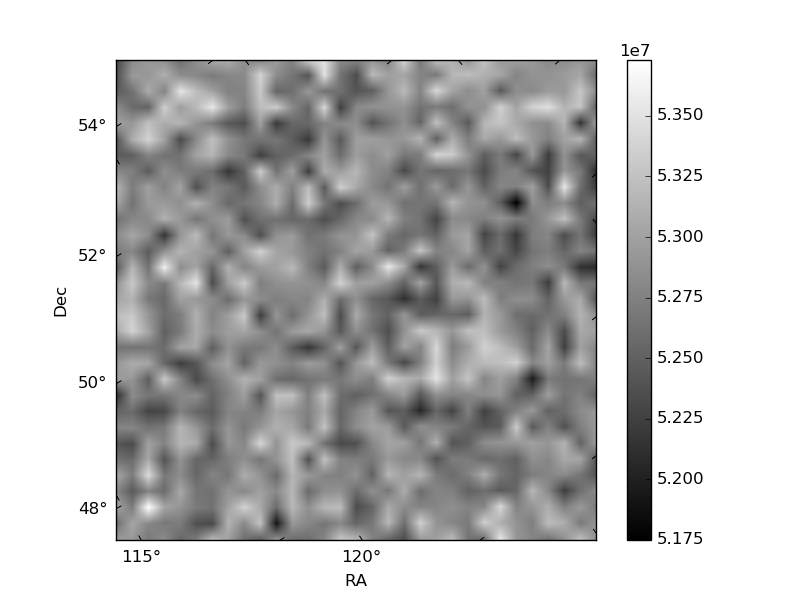
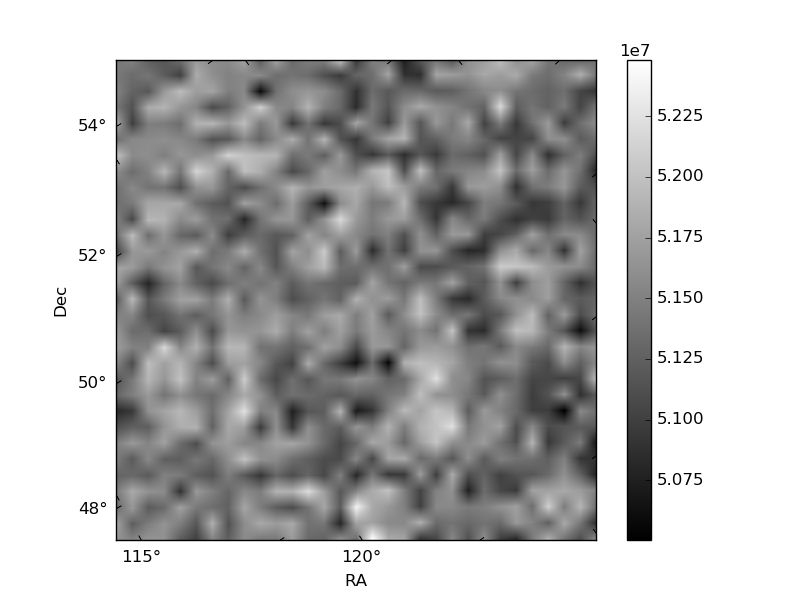
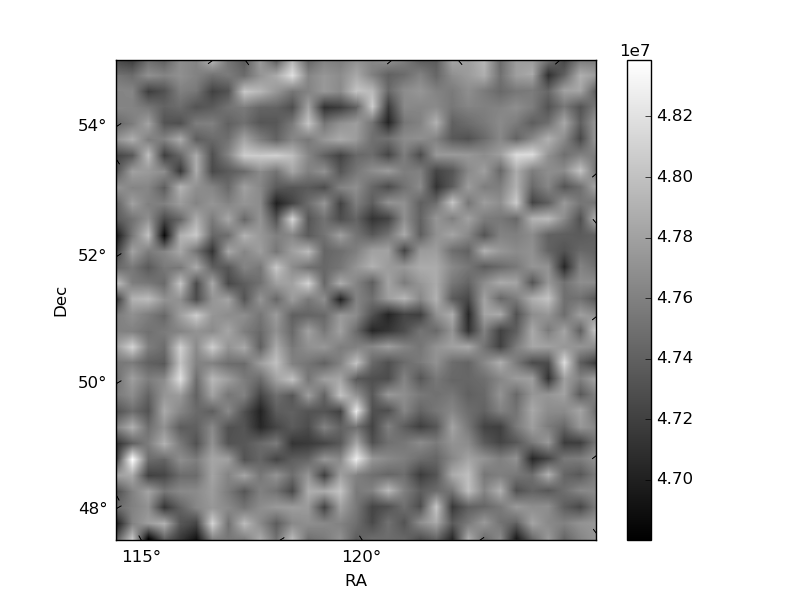
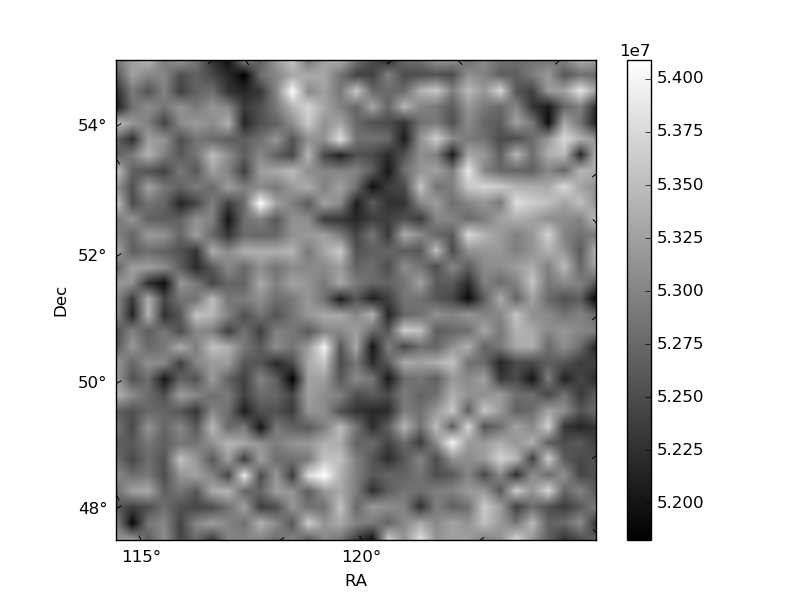
Histogram calculated using DETX and DETY for each event in the final _common_clean file
| Quadrant A | 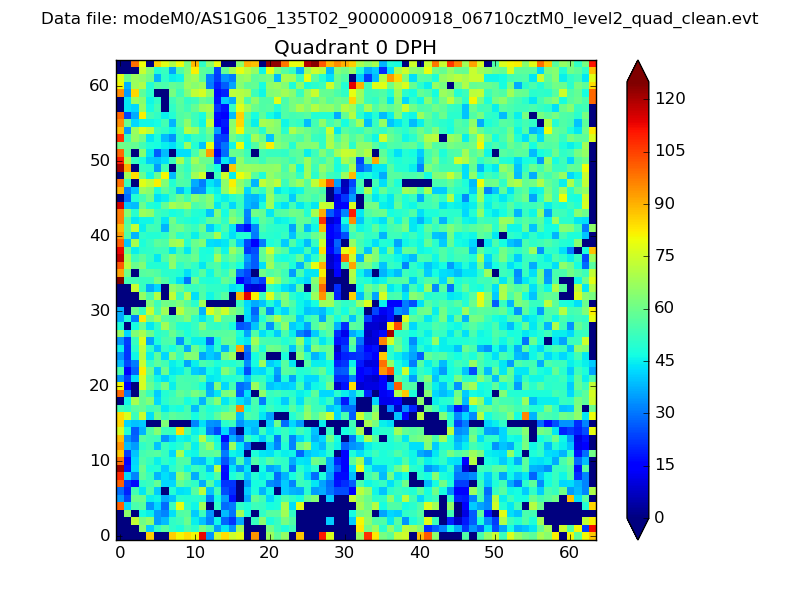 |
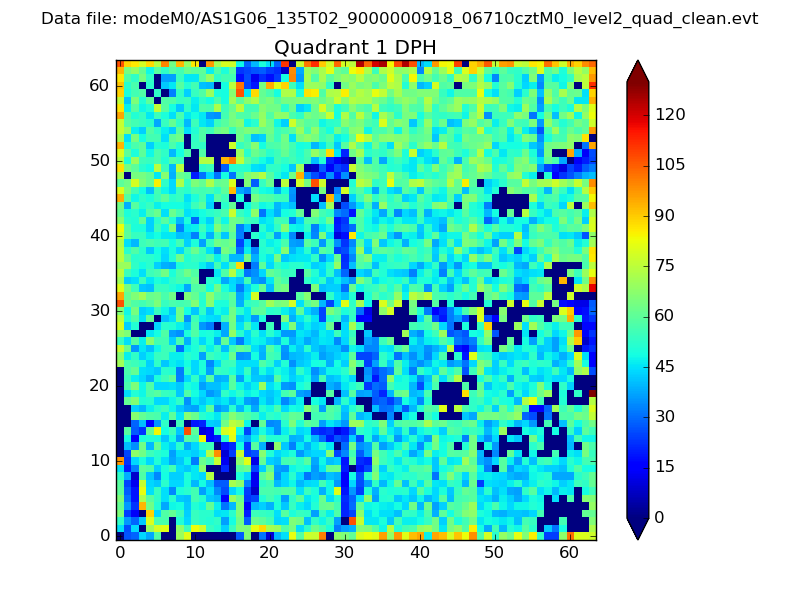 |
Quadrant B |
|---|---|---|---|
| Quadrant D | 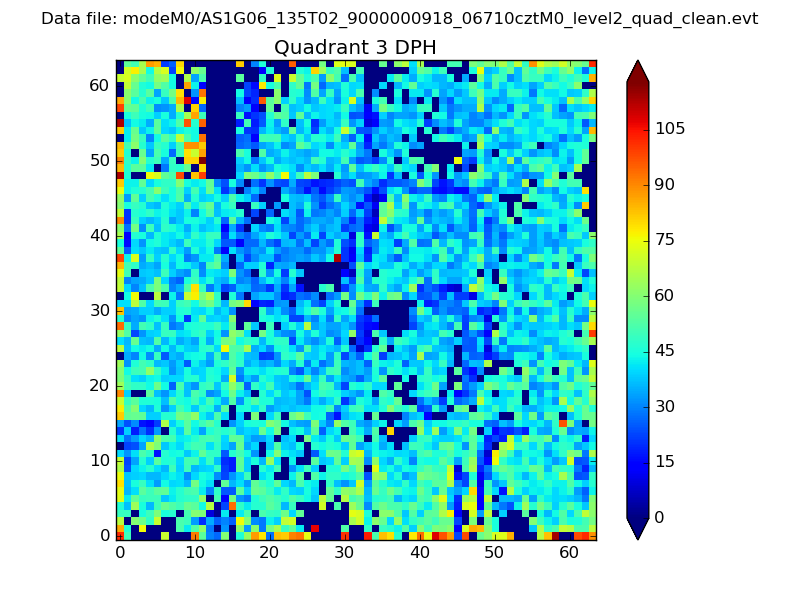 |
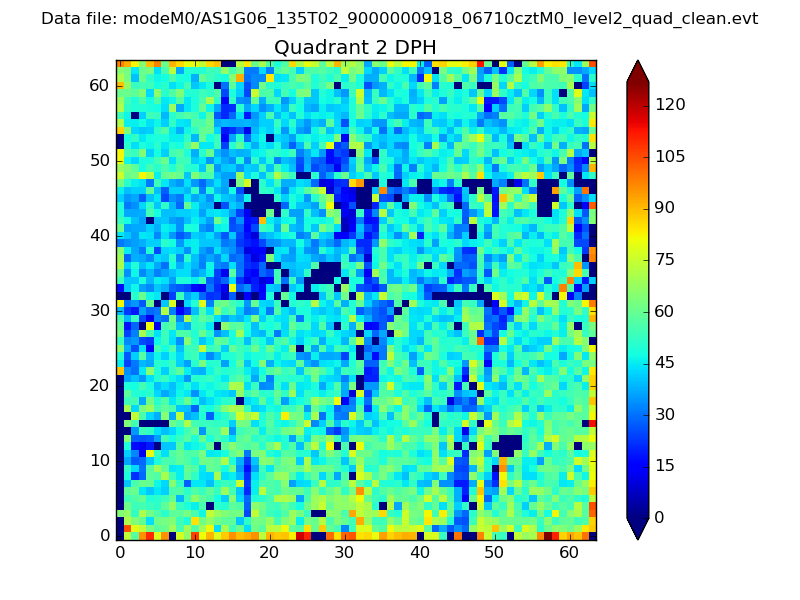 |
Quadrant C |
| Plot type | Count rate plots | Images |
|---|---|---|
| Comparison with Poisson distribution Blue bars denote a histogram of data divided into 1 sec bins. Red curve is a Poisson curve with rate = median count rate of data. |
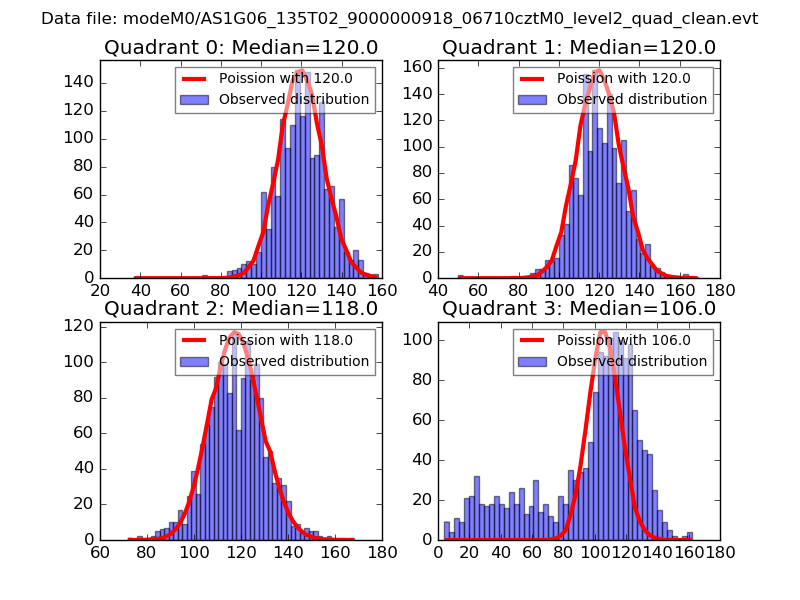 |
 |
| Quadrant-wise count rates Data is divided into 100 sec bins |
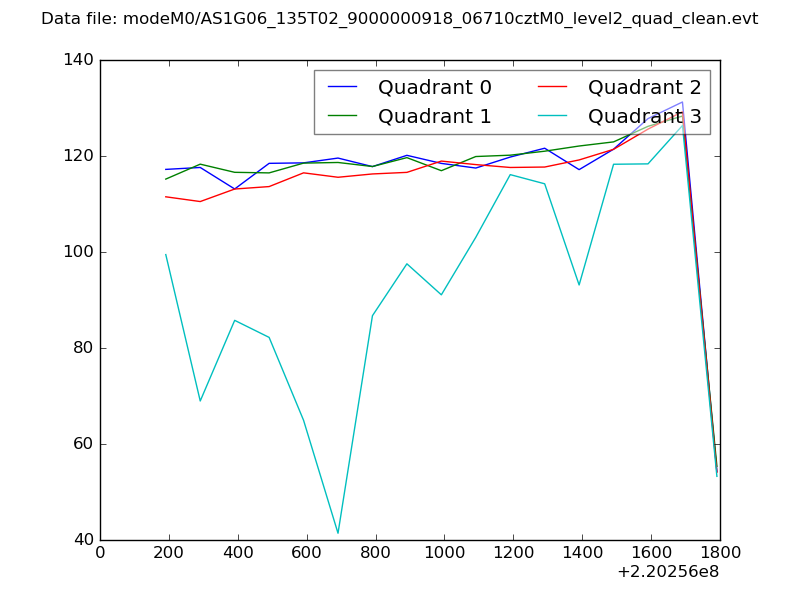 |
|
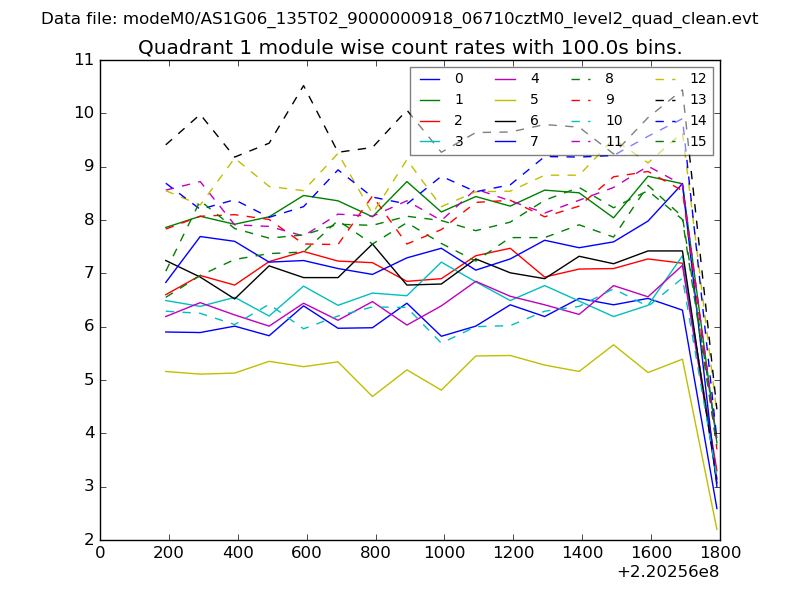
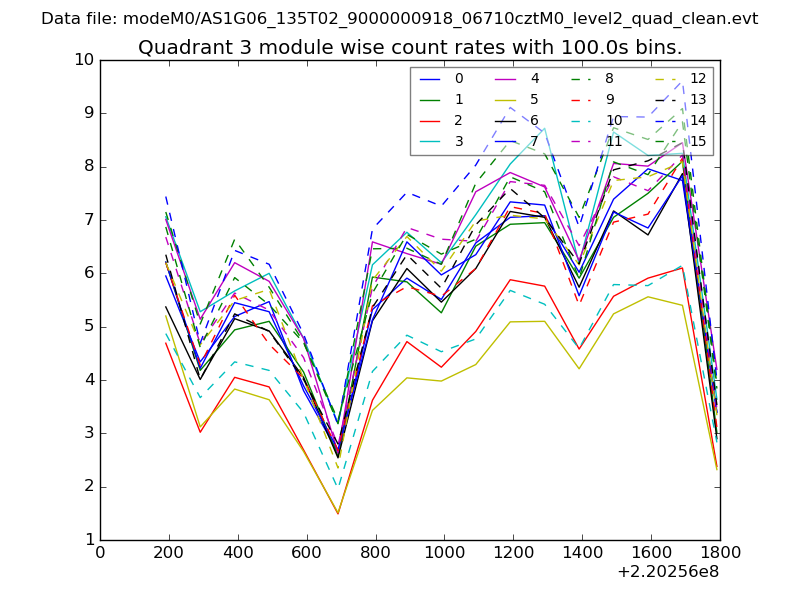
| Module-wise count rates for Quadrant A Data is divided into 100 sec bins |
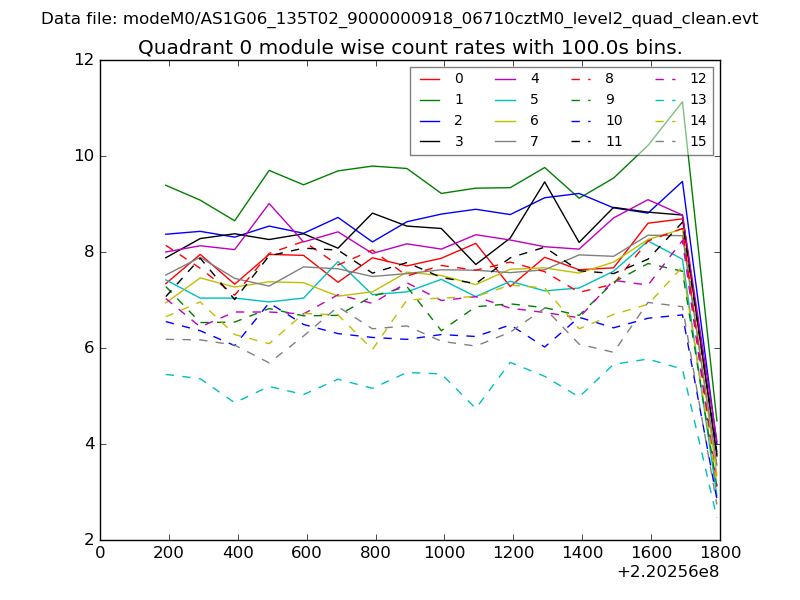 |
 |
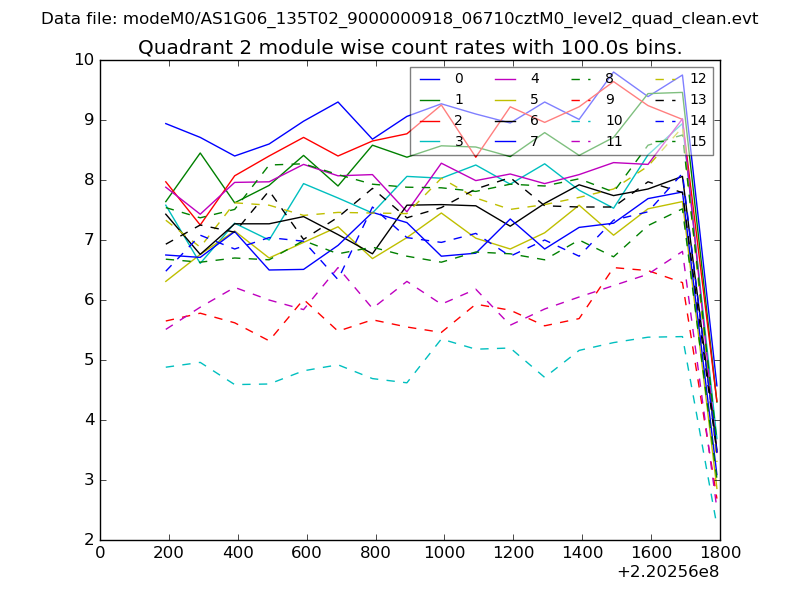
| Module-wise count rates for Quadrant B Data is divided into 100 sec bins |
 |
 |
| Module-wise count rates for Quadrant C Data is divided into 100 sec bins |
 |
 |
| Module-wise count rates for Quadrant D Data is divided into 100 sec bins |
 |
 |
| Parameter | Plot |
|---|---|
| CZT HV Monitor | 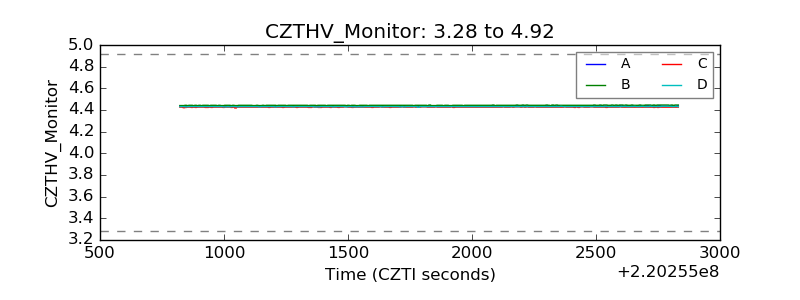 |
| D_VDD | 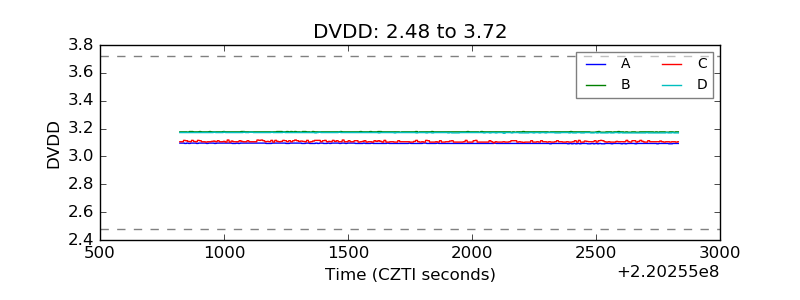 |
| Temperature 1 | 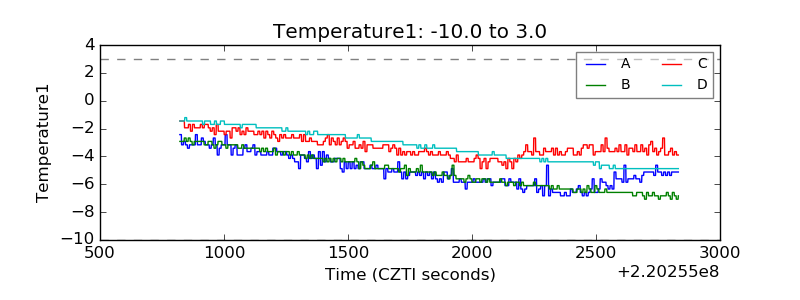 |
| Veto HV Monitor | 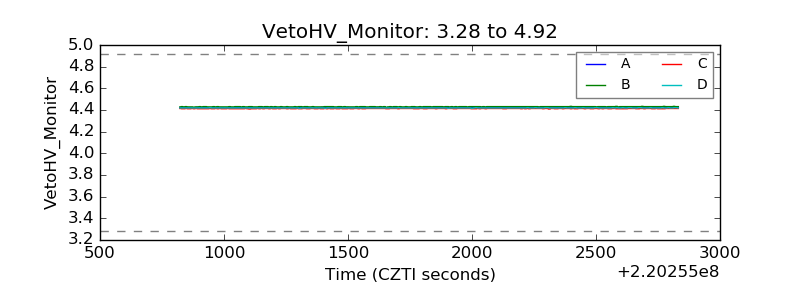 |
| Veto LLD | 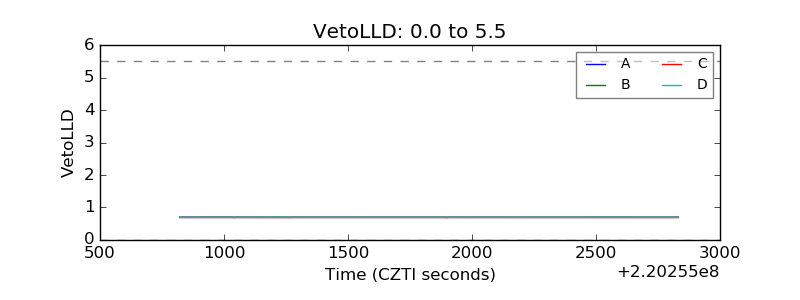 |
| Alpha Counter | 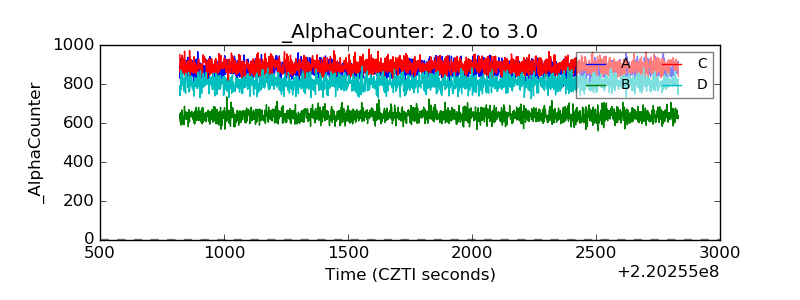 |
| _CPM_Rate | 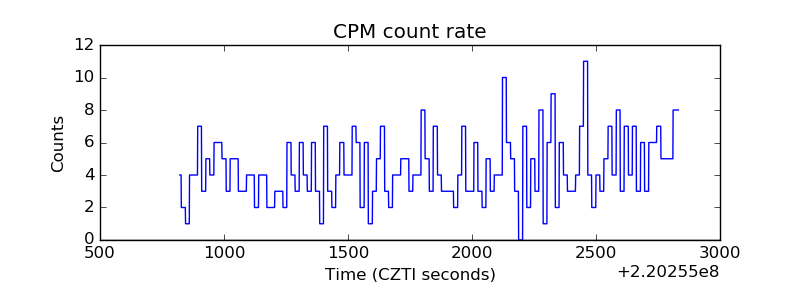 |
| CZT Counter | 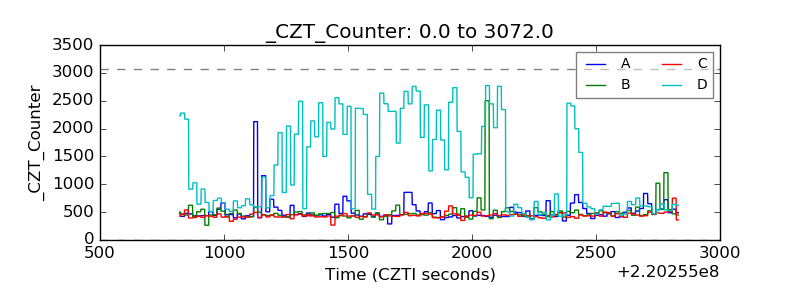 |
| +2.5 Volts monitor |  |
| +5 Volts monitor |  |
| _ROLL_ROT | 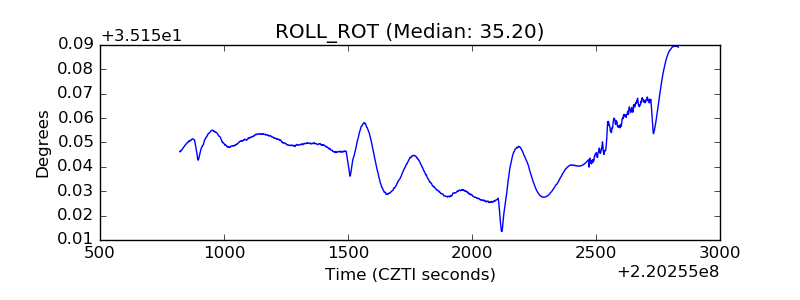 |
| _Roll_DEC | 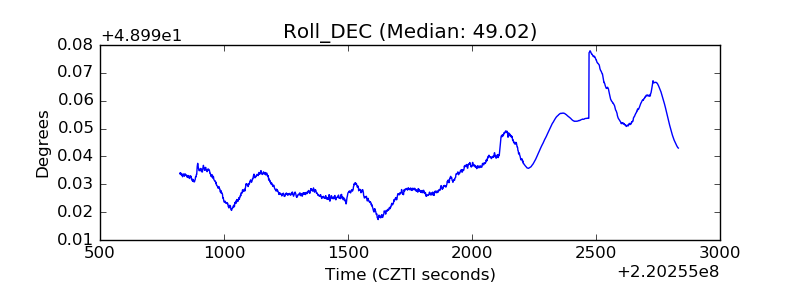 |
| _Roll_RA | 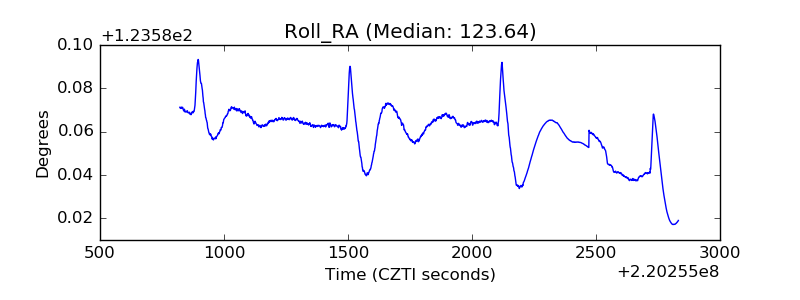 |
| Veto Counter | 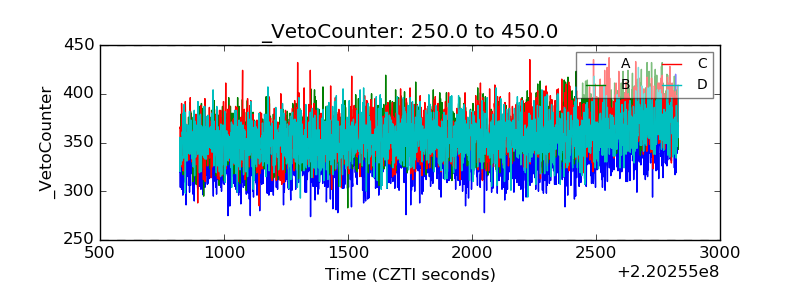 |