| Param | Original file | Final file |
|---|---|---|
| Filename | modeM0/AS1C02_003T01_9000000924cztM0_level2.fits | modeM0/AS1C02_003T01_9000000924cztM0_level2_quad_clean.evt |
| Size (bytes) | 949,484,160 | 989,988,480 |
| Size | 905.5 MB | 944.1 MB |
| Events in quadrant A | 5,708,918 | 6,012,350 |
| Events in quadrant B | 5,561,856 | 6,034,836 |
| Events in quadrant C | 5,631,908 | 5,693,768 |
| Events in quadrant D | 4,716,324 | 5,108,706 |
| Mode M9 | |||
|---|---|---|---|
| Quadrant | BADHDUFLAG | Total packets | Discarded packets |
| A | 0 | 155 | 0 |
| B | 0 | 155 | 0 |
| C | 0 | 155 | 0 |
| D | 0 | 156 | 0 |
| Mode SS | |||
|---|---|---|---|
| Quadrant | BADHDUFLAG | Total packets | Discarded packets |
| A | 0 | 2126 | 0 |
| B | 0 | 2126 | 0 |
| C | 0 | 2126 | 0 |
| D | 0 | 2126 | 0 |
| Mode M0 | |||
|---|---|---|---|
| Quadrant | BADHDUFLAG | Total packets | Discarded packets |
| A | 0 | 221993 | 0 |
| B | 0 | 216211 | 0 |
| C | 0 | 215455 | 0 |
| D | 0 | 257100 | 0 |
| Quadrant | Total seconds | Saturated seconds | Saturation percentage |
|---|---|---|---|
| A | 104071 | 1702 | 1.635422% |
| B | 104072 | 1490 | 1.431701% |
| C | 104072 | 1179 | 1.132870% |
| D | 104071 | 4678 | 4.495008% |
Noise dominated data is calculated using 1-second bins in cleaned event files. If a bin has >2000 counts, and if more than 50% of those come from <1% of pixels, then it is considered to be noise-dominated and hence unusable.
| Quadrant | # 1 sec bins | Bins with >0 counts | Bins with >2000 counts | High rate bins dominated by noise | Noise dominated (total time) | Noise dominated (detector-on time) | Marked lightcurve |
|---|---|---|---|---|---|---|---|
| A | 123974 | 104070 | 0 | 0 | 0.00% | 0.00% |  |
| B | 123975 | 104072 | 0 | 0 | 0.00% | 0.00% | 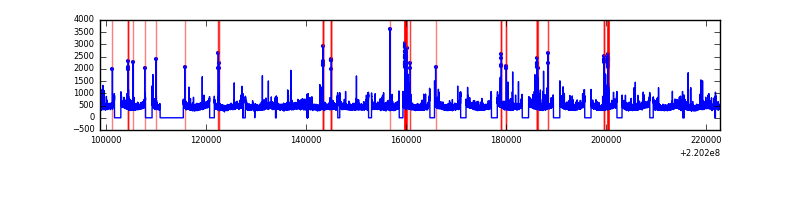 |
| C | 123975 | 104073 | 0 | 0 | 0.00% | 0.00% |  |
| D | 123975 | 103914 | 0 | 0 | 0.00% | 0.00% |  |
Top three noisy pixels from each quadrant. If the there are fewer than three noisy pixels in the level2.evt file, extra rows are filled as -1
| Pixel properties | Quadrant properties | ||||||
|---|---|---|---|---|---|---|---|
| Quadrant | DetID | PixID | Counts | Sigma | Mean | Median | Sigma |
| A | 14 | 188 | 5768 | 11.71 | 1478 | 1373 | 375.3 |
| A | 0 | 29 | 5545 | 11.12 | 1478 | 1373 | 375.3 |
| A | 14 | 204 | 4849 | 9.26 | 1478 | 1373 | 375.3 |
| B | 2 | 9 | 4739 | 11.49 | 1464 | 1391 | 291.5 |
| B | 12 | 226 | 3871 | 8.51 | 1464 | 1391 | 291.5 |
| B | 14 | 254 | 3816 | 8.32 | 1464 | 1391 | 291.5 |
| C | 1 | 80 | 3975 | 6.6 | 1487 | 1374 | 394.2 |
| C | 1 | 81 | 3955 | 6.55 | 1487 | 1374 | 394.2 |
| C | 12 | 241 | 3852 | 6.28 | 1487 | 1374 | 394.2 |
| D | 3 | 14 | 3586 | 6.55 | 1344 | 1216 | 362.1 |
| D | 6 | 231 | 3517 | 6.36 | 1344 | 1216 | 362.1 |
| D | 6 | 83 | 3352 | 5.9 | 1344 | 1216 | 362.1 |
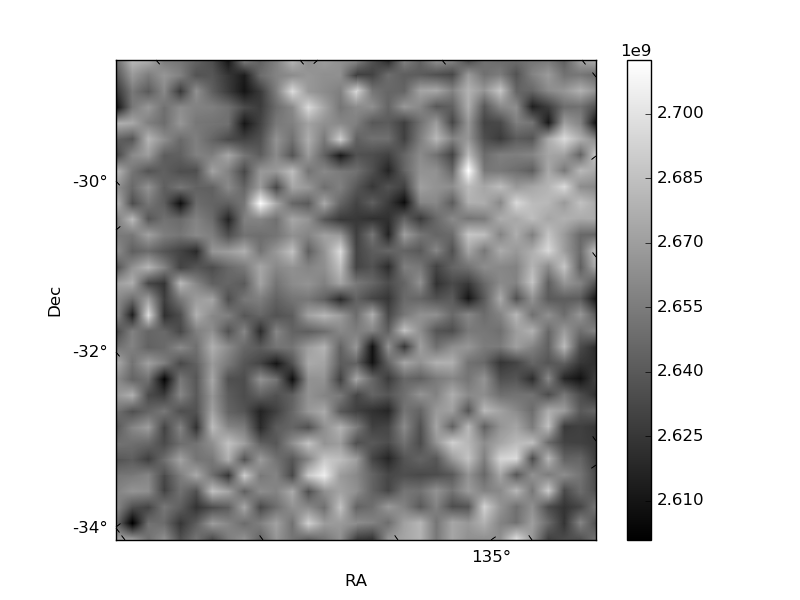
Histogram calculated using DETX and DETY for each event in the final _common_clean file
| Quadrant A |  |
 |
Quadrant B |
|---|---|---|---|
| Quadrant D | 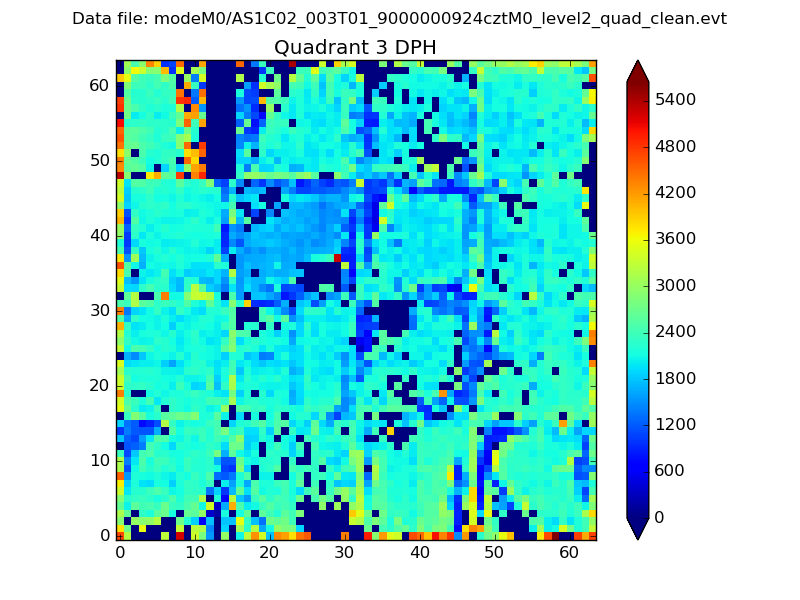 |
 |
Quadrant C |
| Plot type | Count rate plots | Images |
|---|---|---|
| Comparison with Poisson distribution Blue bars denote a histogram of data divided into 1 sec bins. Red curve is a Poisson curve with rate = median count rate of data. |
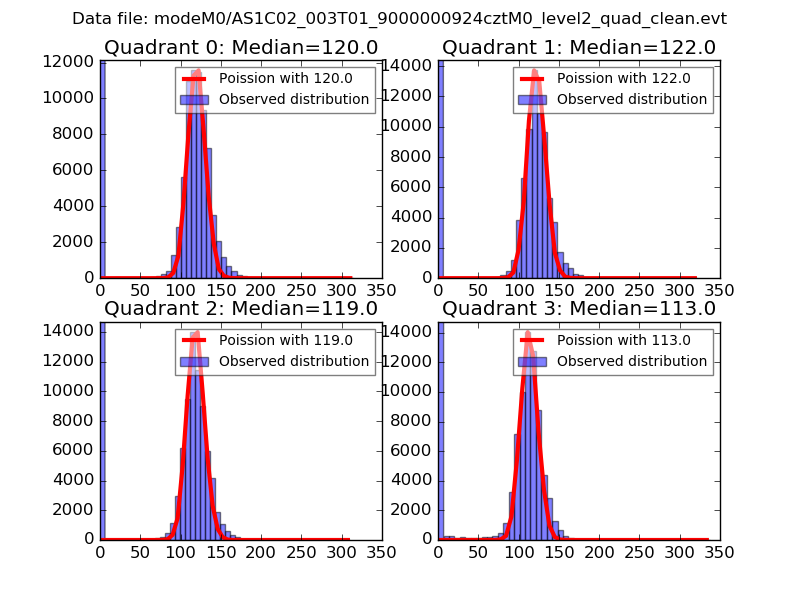 |
 |
| Quadrant-wise count rates Data is divided into 100 sec bins |
 |
|
| Module-wise count rates for Quadrant A Data is divided into 100 sec bins |
 |
 |
| Module-wise count rates for Quadrant B Data is divided into 100 sec bins |
 |
 |
| Module-wise count rates for Quadrant C Data is divided into 100 sec bins |
 |
 |
| Module-wise count rates for Quadrant D Data is divided into 100 sec bins |
 |
 |
| Parameter | Plot |
|---|---|
| CZT HV Monitor |  |
| D_VDD |  |
| Temperature 1 | 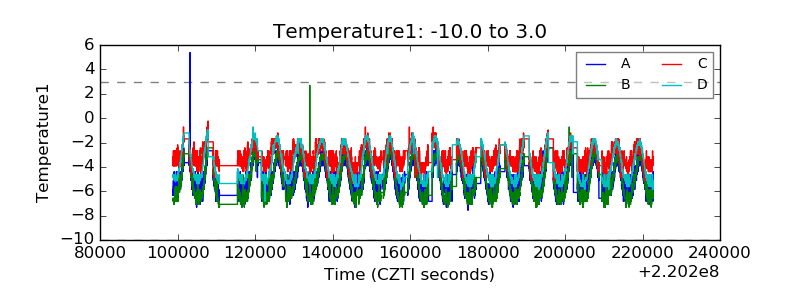 |
| Veto HV Monitor |  |
| Veto LLD |  |
| Alpha Counter |  |
| _CPM_Rate |  |
| CZT Counter |  |
| +2.5 Volts monitor |  |
| +5 Volts monitor |  |
| _ROLL_ROT |  |
| _Roll_DEC |  |
| _Roll_RA | 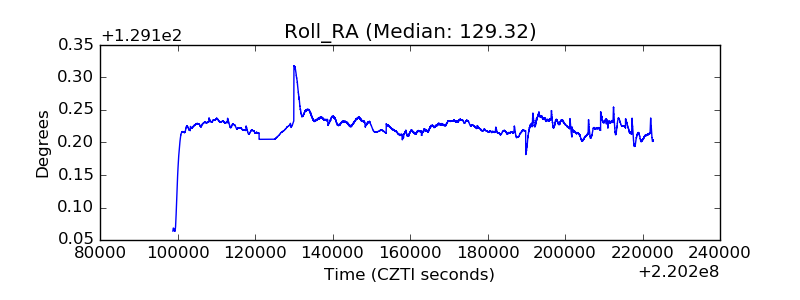 |
| Veto Counter | 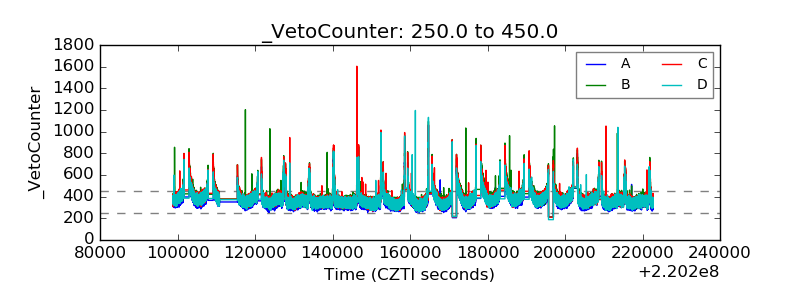 |