| Param | Original file | Final file |
|---|---|---|
| Filename | modeM0/AS1C02_003T01_9000000924_06715cztM0_level2.evt | modeM0/AS1C02_003T01_9000000924_06715cztM0_level2_quad_clean.evt |
| Size (bytes) | 345,528,000 | 65,577,600 |
| Size | 329.5 MB | 62.5 MB |
| Events in quadrant A | 2,389,545 | 428,882 |
| Events in quadrant B | 2,033,883 | 444,995 |
| Events in quadrant C | 1,979,037 | 434,182 |
| Events in quadrant D | 3,774,249 | 380,276 |
| Mode M9 | |||
|---|---|---|---|
| Quadrant | BADHDUFLAG | Total packets | Discarded packets |
| A | 0 | 13 | 0 |
| B | 0 | 13 | 0 |
| C | 0 | 13 | 0 |
| D | 0 | 13 | 0 |
| Mode SS | |||
|---|---|---|---|
| Quadrant | BADHDUFLAG | Total packets | Discarded packets |
| A | 0 | 86 | 0 |
| B | 0 | 86 | 0 |
| C | 0 | 86 | 0 |
| D | 0 | 86 | 0 |
| Mode M0 | |||
|---|---|---|---|
| Quadrant | BADHDUFLAG | Total packets | Discarded packets |
| A | 0 | 9958 | 4 |
| B | 0 | 8801 | 1 |
| C | 0 | 8726 | 1 |
| D | 0 | 14171 | 11 |
| Quadrant | Total seconds | Saturated seconds | Saturation percentage |
|---|---|---|---|
| A | 4218 | 171 | 4.054054% |
| B | 4219 | 75 | 1.777672% |
| C | 4219 | 46 | 1.090306% |
| D | 4218 | 677 | 16.050261% |
Noise dominated data is calculated using 1-second bins in cleaned event files. If a bin has >2000 counts, and if more than 50% of those come from <1% of pixels, then it is considered to be noise-dominated and hence unusable.
| Quadrant | # 1 sec bins | Bins with >0 counts | Bins with >2000 counts | High rate bins dominated by noise | Noise dominated (total time) | Noise dominated (detector-on time) | Marked lightcurve |
|---|---|---|---|---|---|---|---|
| A | 5503 | 4219 | 16 | 16 | 0.29% | 0.38% | 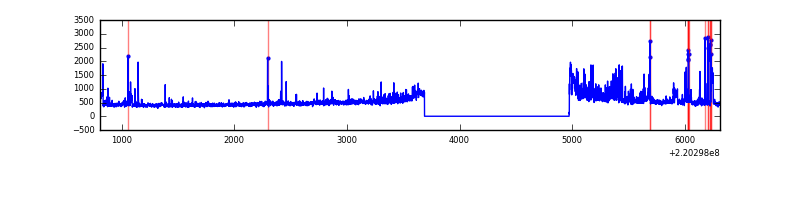 |
| B | 5504 | 4220 | 1 | 1 | 0.02% | 0.02% | 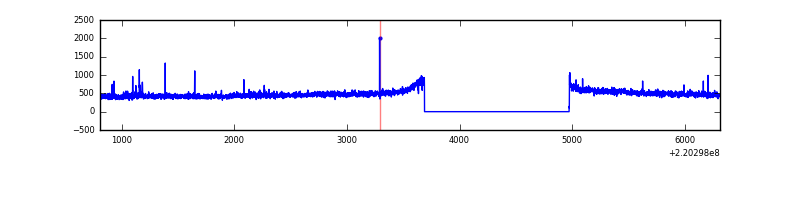 |
| C | 5504 | 4220 | 0 | 0 | 0.00% | 0.00% | 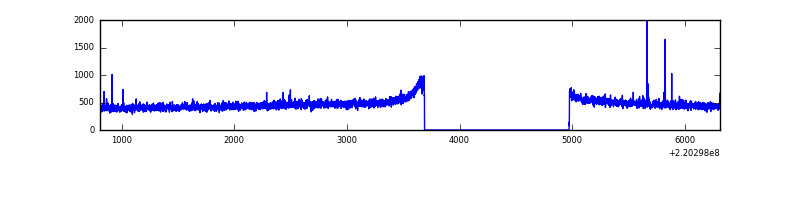 |
| D | 5504 | 4220 | 605 | 605 | 10.99% | 14.34% | 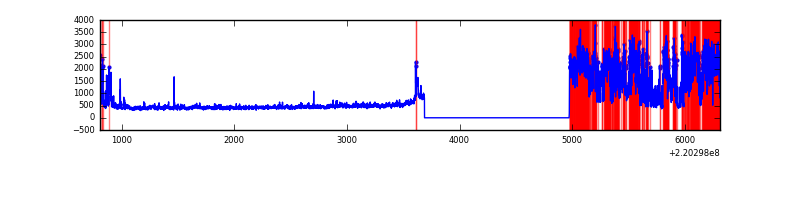 |
Top three noisy pixels from each quadrant. If the there are fewer than three noisy pixels in the level2.evt file, extra rows are filled as -1
| Pixel properties | Quadrant properties | ||||||
|---|---|---|---|---|---|---|---|
| Quadrant | DetID | PixID | Counts | Sigma | Mean | Median | Sigma |
| A | 14 | 111 | 332814 | 3224.77 | 505 | 495 | 103.1 |
| A | 8 | 15 | 81888 | 789.82 | 505 | 495 | 103.1 |
| A | 13 | 251 | 27761 | 264.58 | 505 | 495 | 103.1 |
| B | 10 | 252 | 15531 | 151.81 | 519 | 507 | 99.0 |
| B | 12 | 111 | 9866 | 94.57 | 519 | 507 | 99.0 |
| B | 11 | 111 | 7698 | 72.66 | 519 | 507 | 99.0 |
| C | 10 | 22 | 6781 | 53.14 | 503 | 506 | 118.1 |
| C | 9 | 247 | 6074 | 47.15 | 503 | 506 | 118.1 |
| C | 13 | 61 | 4029 | 29.83 | 503 | 506 | 118.1 |
| D | 2 | 33 | 1941417 | 16928.19 | 468 | 453 | 114.7 |
| D | 8 | 195 | 35718 | 307.57 | 468 | 453 | 114.7 |
| D | 2 | 136 | 25162 | 215.5 | 468 | 453 | 114.7 |
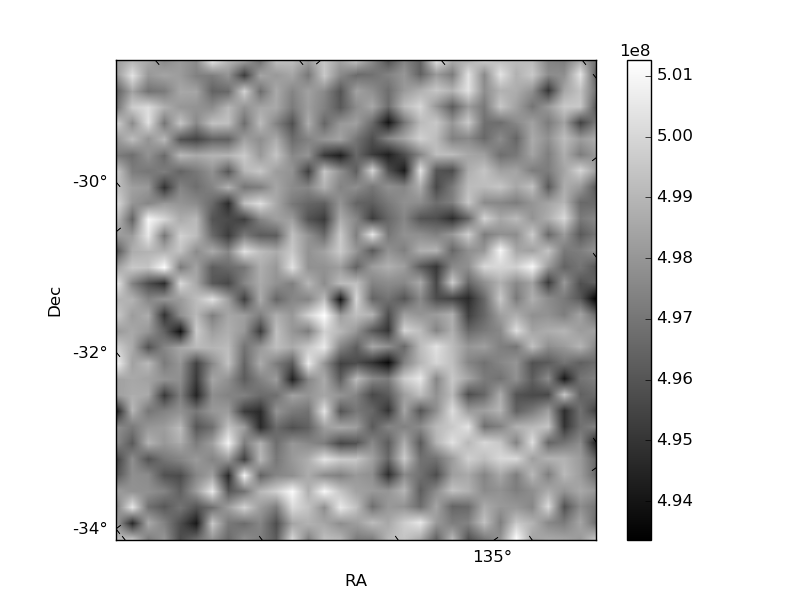
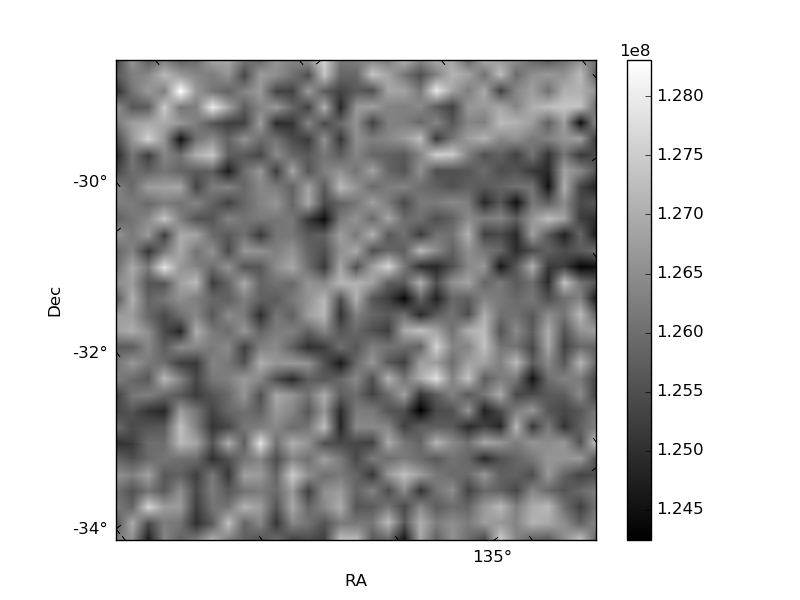
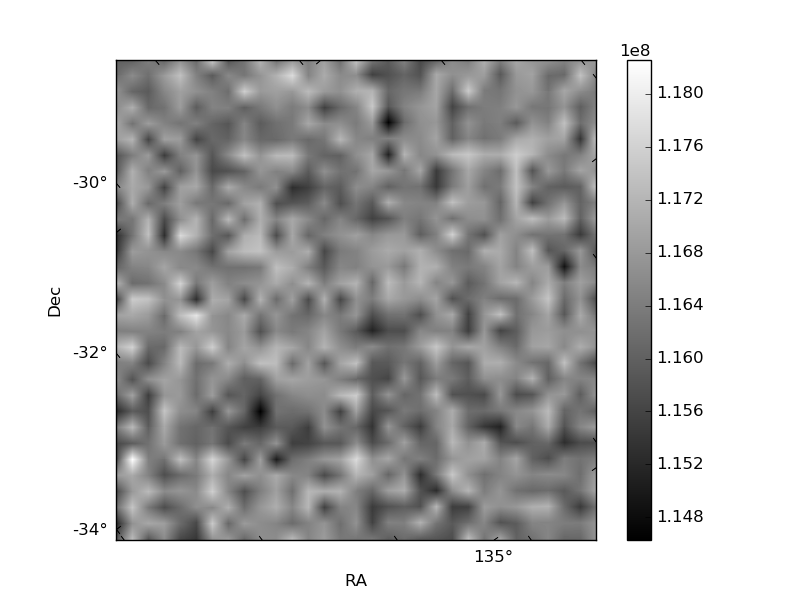
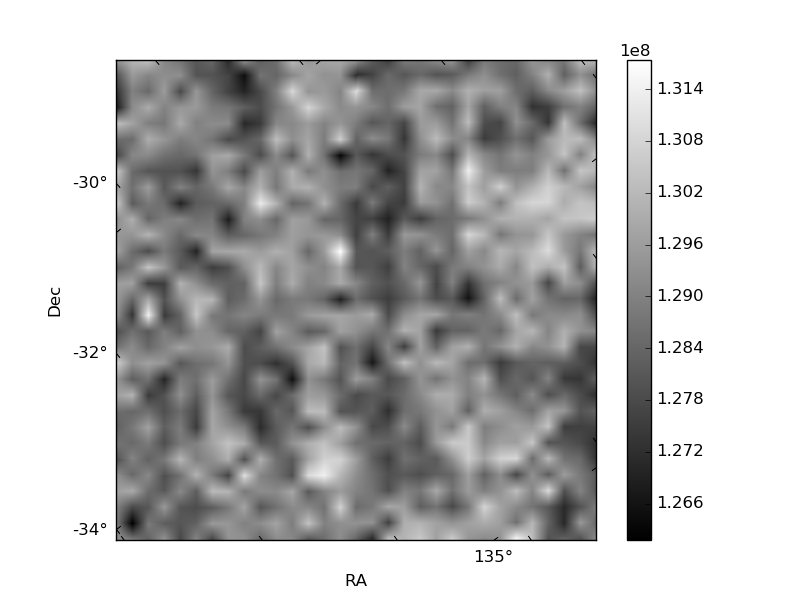
Histogram calculated using DETX and DETY for each event in the final _common_clean file
| Quadrant A | 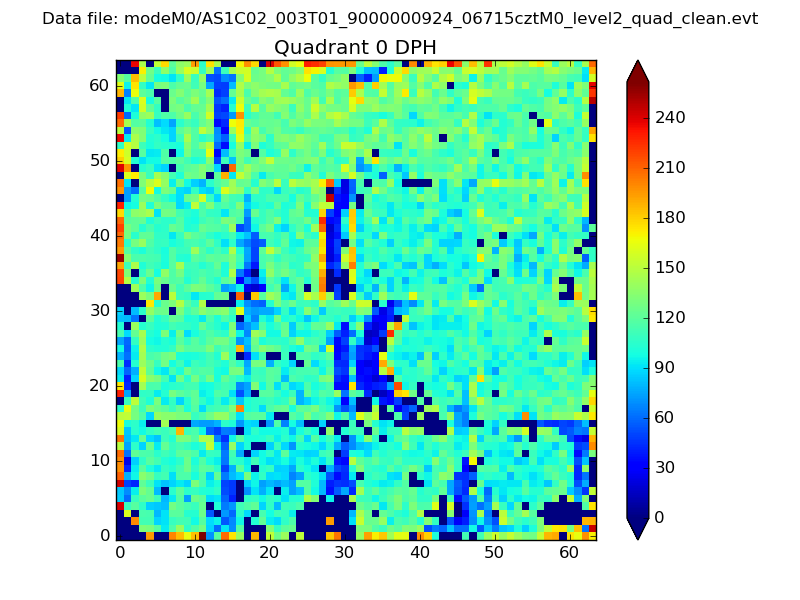 |
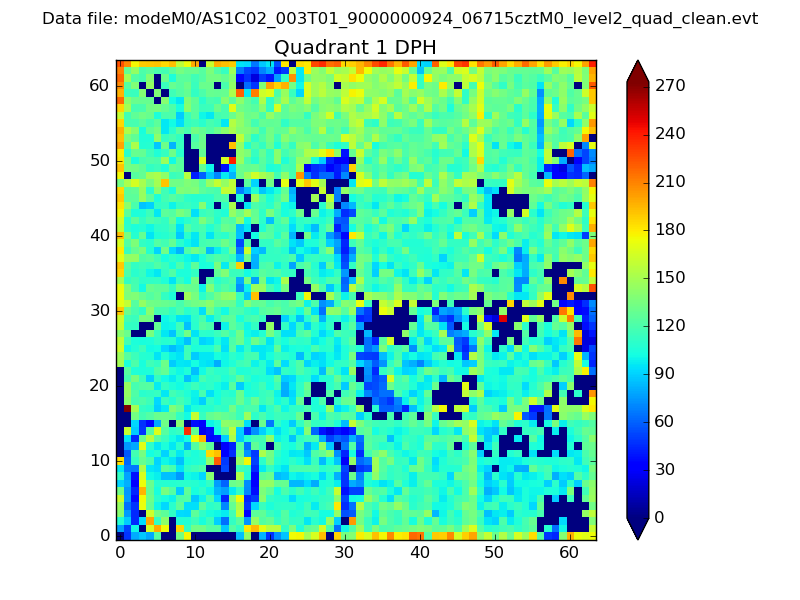 |
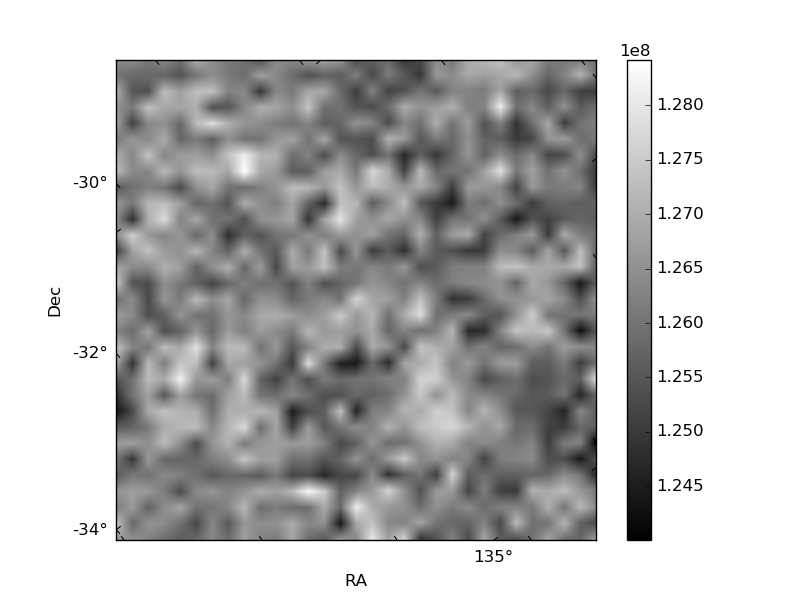
Quadrant B |
|---|---|---|---|
| Quadrant D | 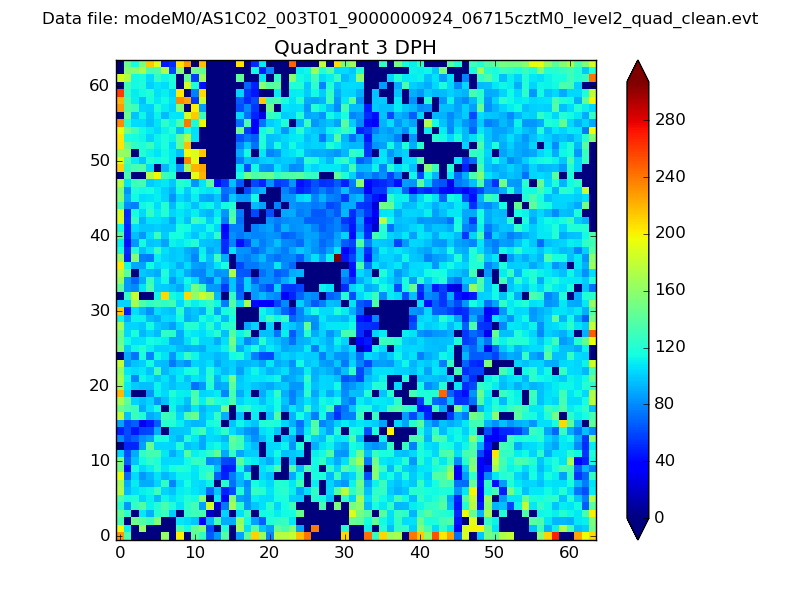 |
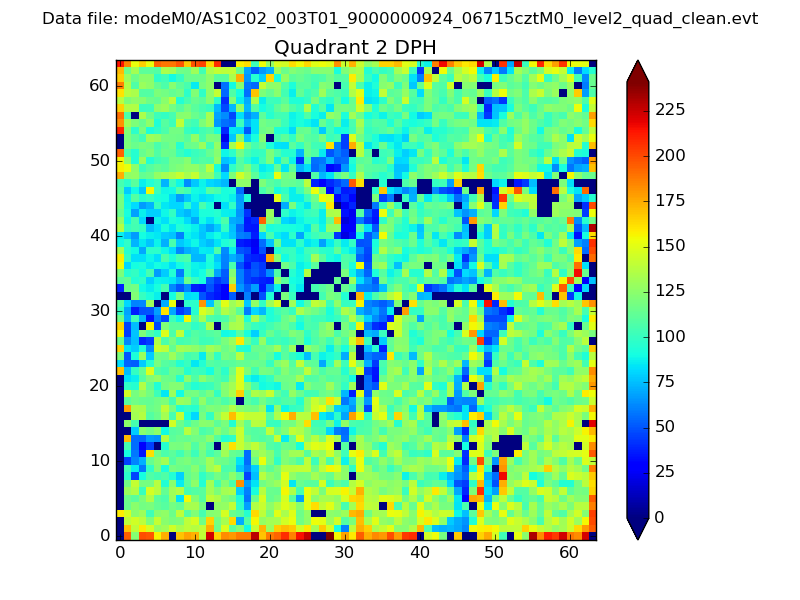 |
Quadrant C |
| Plot type | Count rate plots | Images |
|---|---|---|
| Comparison with Poisson distribution Blue bars denote a histogram of data divided into 1 sec bins. Red curve is a Poisson curve with rate = median count rate of data. |
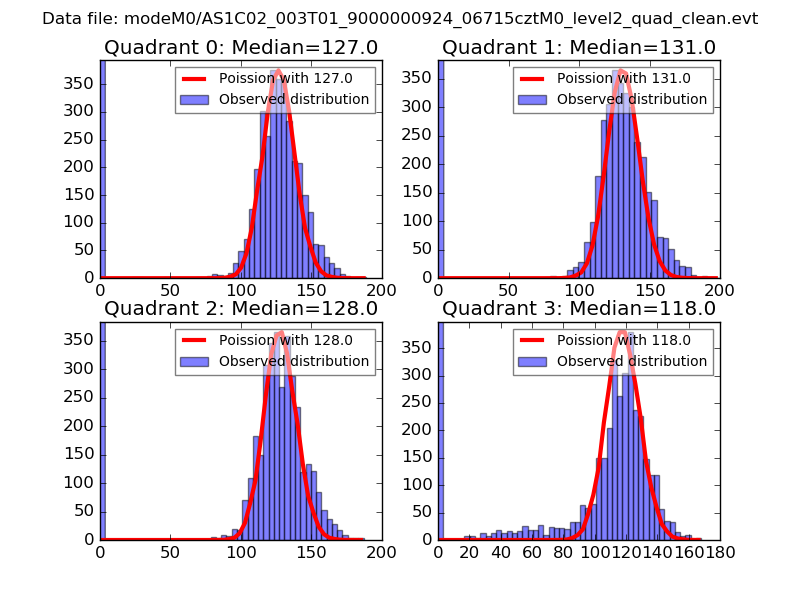 |
 |
| Quadrant-wise count rates Data is divided into 100 sec bins |
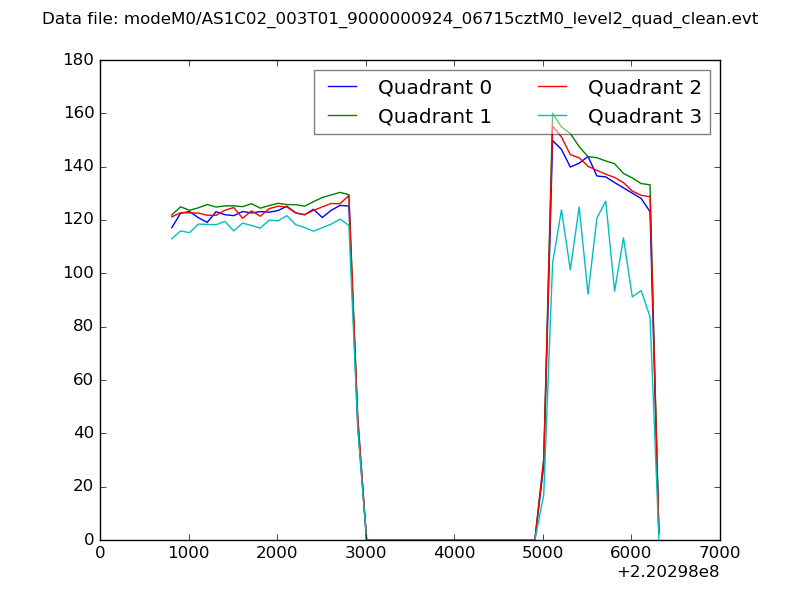 |
|
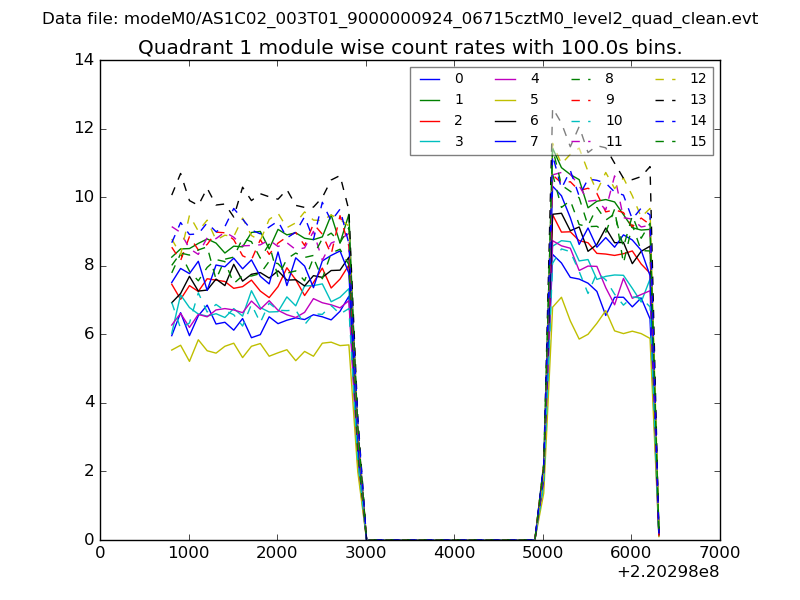
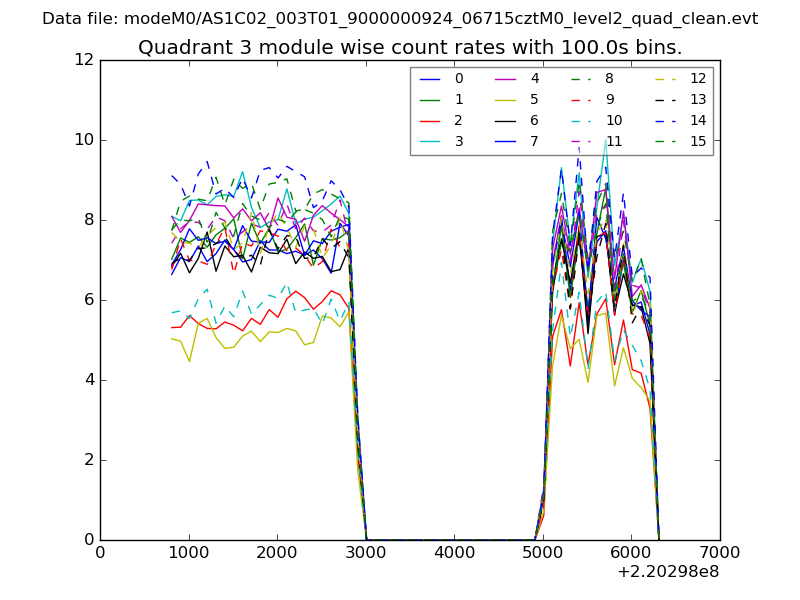
| Module-wise count rates for Quadrant A Data is divided into 100 sec bins |
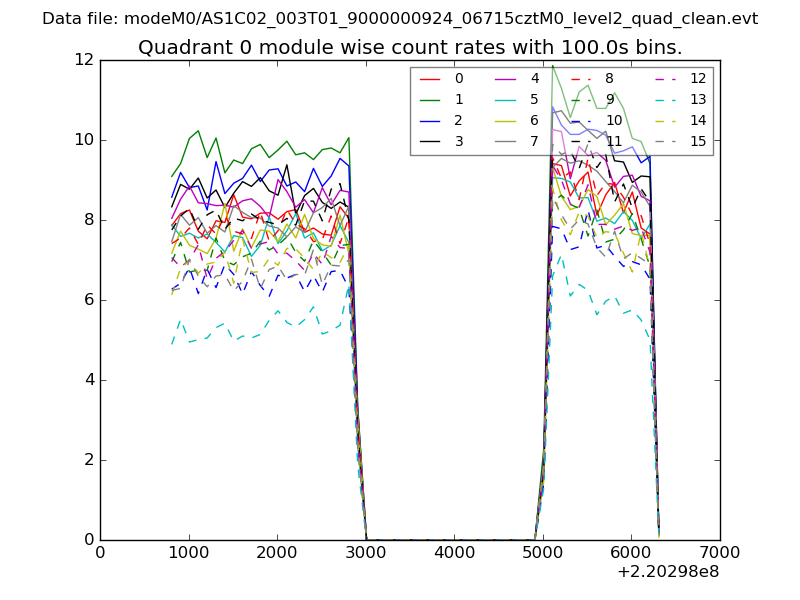 |
 |
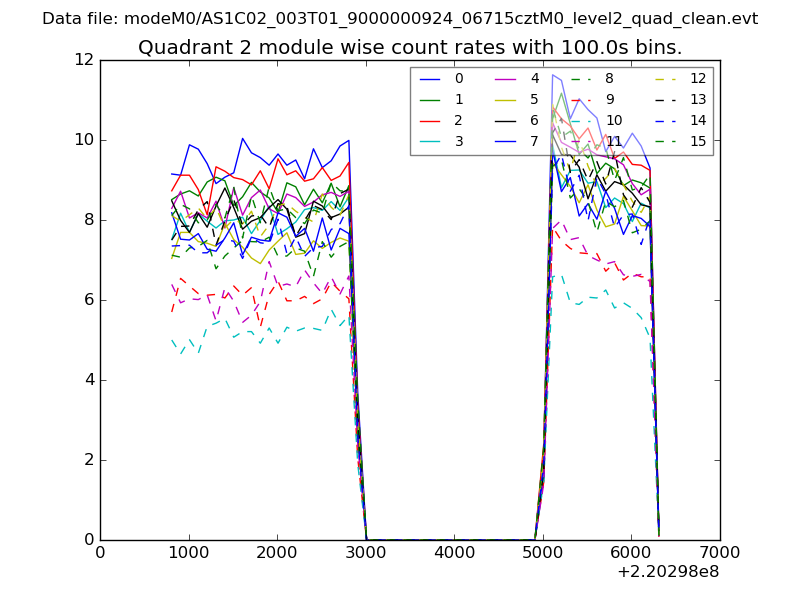
| Module-wise count rates for Quadrant B Data is divided into 100 sec bins |
 |
 |
| Module-wise count rates for Quadrant C Data is divided into 100 sec bins |
 |
 |
| Module-wise count rates for Quadrant D Data is divided into 100 sec bins |
 |
 |
| Parameter | Plot |
|---|---|
| CZT HV Monitor | 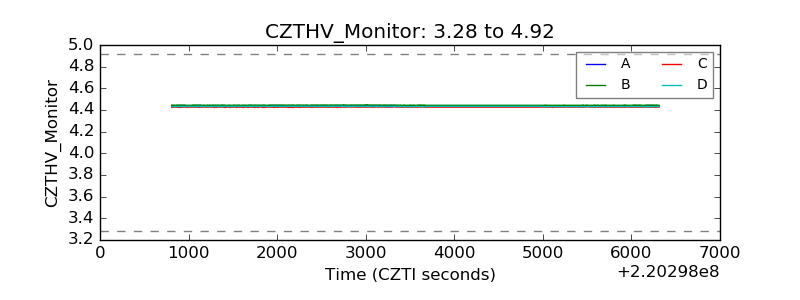 |
| D_VDD | 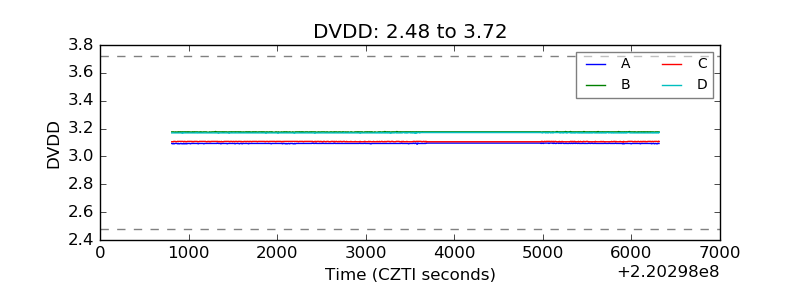 |
| Temperature 1 | 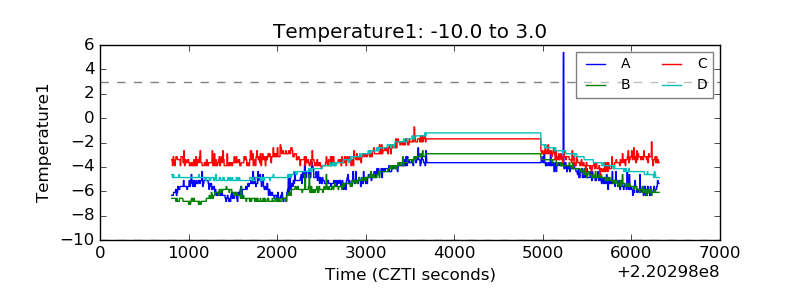 |
| Veto HV Monitor | 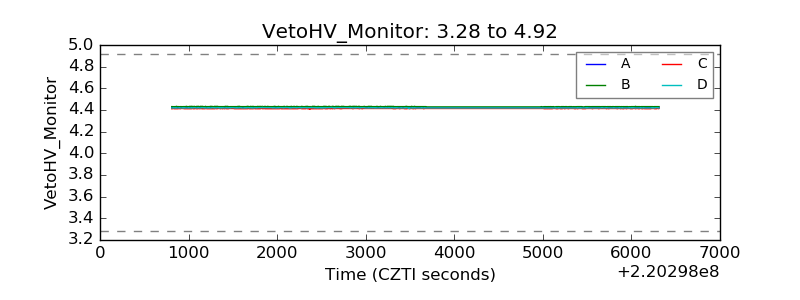 |
| Veto LLD | 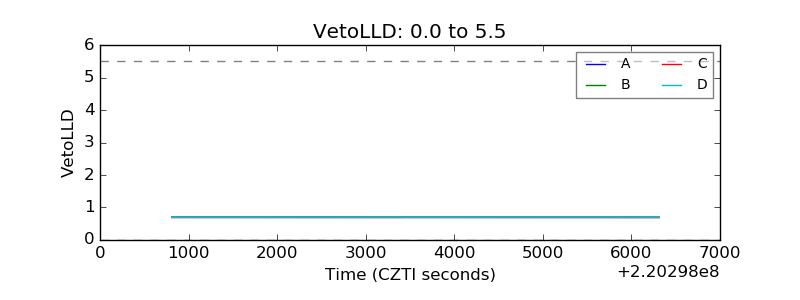 |
| Alpha Counter | 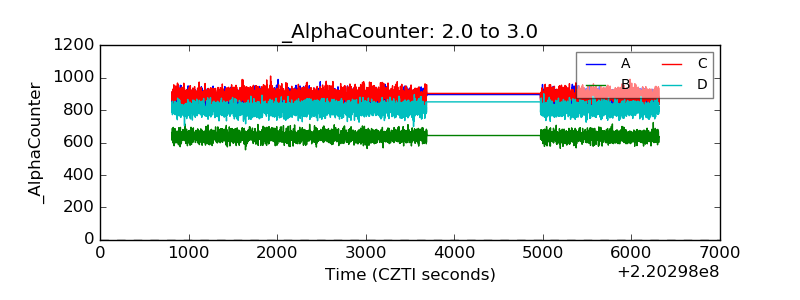 |
| _CPM_Rate | 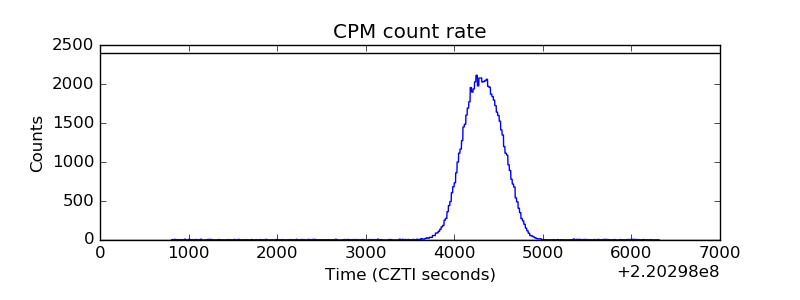 |
| CZT Counter | 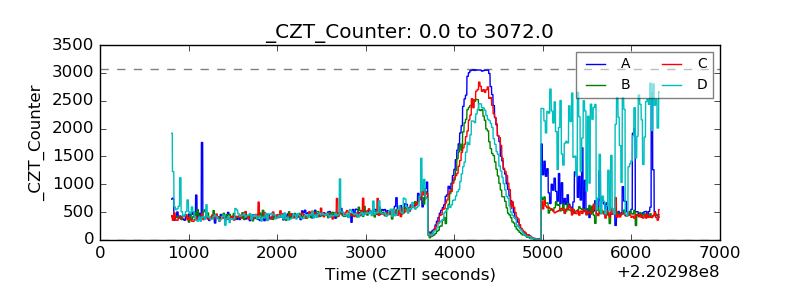 |
| +2.5 Volts monitor |  |
| +5 Volts monitor |  |
| _ROLL_ROT | 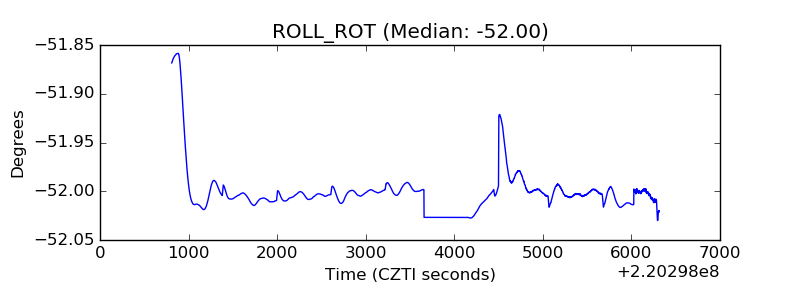 |
| _Roll_DEC | 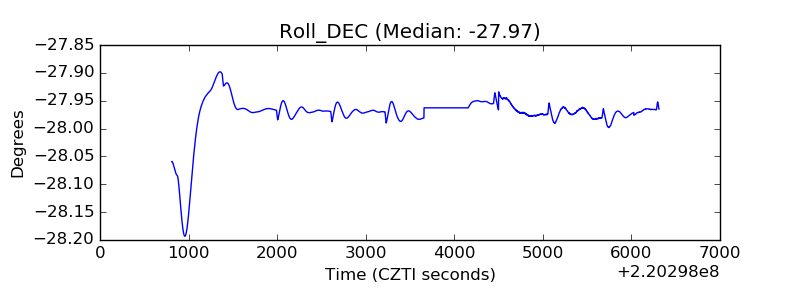 |
| _Roll_RA | 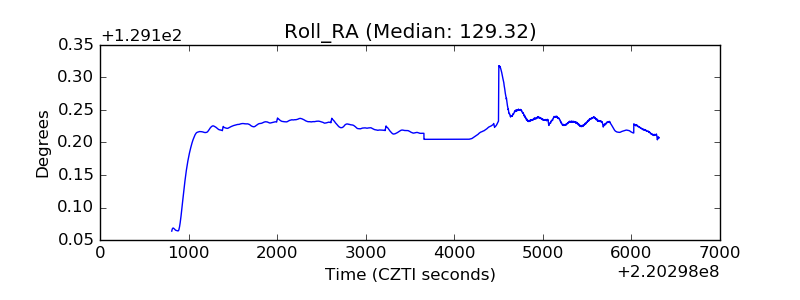 |
| Veto Counter | 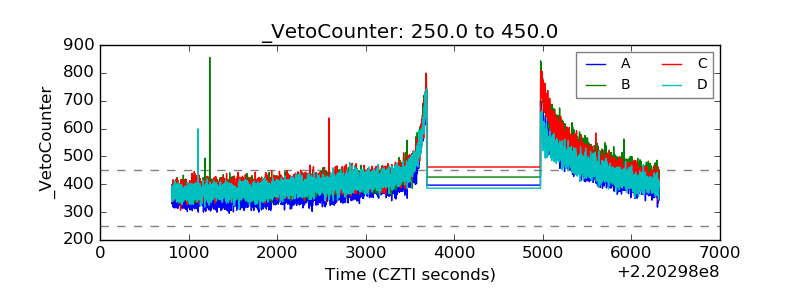 |