| Param | Original file | Final file |
|---|---|---|
| Filename | modeM0/AS1C02_003T01_9000000924_06716cztM0_level2.evt | modeM0/AS1C02_003T01_9000000924_06716cztM0_level2_quad_clean.evt |
| Size (bytes) | 529,977,600 | 102,456,000 |
| Size | 505.4 MB | 97.7 MB |
| Events in quadrant A | 3,712,266 | 675,710 |
| Events in quadrant B | 3,132,202 | 699,350 |
| Events in quadrant C | 2,975,054 | 679,172 |
| Events in quadrant D | 5,788,382 | 593,678 |
| Mode M9 | |||
|---|---|---|---|
| Quadrant | BADHDUFLAG | Total packets | Discarded packets |
| A | 0 | 21 | 0 |
| B | 0 | 21 | 0 |
| C | 0 | 21 | 0 |
| D | 0 | 22 | 0 |
| Mode SS | |||
|---|---|---|---|
| Quadrant | BADHDUFLAG | Total packets | Discarded packets |
| A | 0 | 132 | 0 |
| B | 0 | 132 | 0 |
| C | 0 | 132 | 0 |
| D | 0 | 132 | 0 |
| Mode M0 | |||
|---|---|---|---|
| Quadrant | BADHDUFLAG | Total packets | Discarded packets |
| A | 0 | 15485 | 3 |
| B | 0 | 13643 | 2 |
| C | 0 | 13392 | 2 |
| D | 0 | 21871 | 2 |
| Quadrant | Total seconds | Saturated seconds | Saturation percentage |
|---|---|---|---|
| A | 6519 | 212 | 3.252033% |
| B | 6519 | 41 | 0.628931% |
| C | 6519 | 10 | 0.153398% |
| D | 6519 | 941 | 14.434729% |
Noise dominated data is calculated using 1-second bins in cleaned event files. If a bin has >2000 counts, and if more than 50% of those come from <1% of pixels, then it is considered to be noise-dominated and hence unusable.
| Quadrant | # 1 sec bins | Bins with >0 counts | Bins with >2000 counts | High rate bins dominated by noise | Noise dominated (total time) | Noise dominated (detector-on time) | Marked lightcurve |
|---|---|---|---|---|---|---|---|
| A | 7844 | 6520 | 78 | 78 | 0.99% | 1.20% | 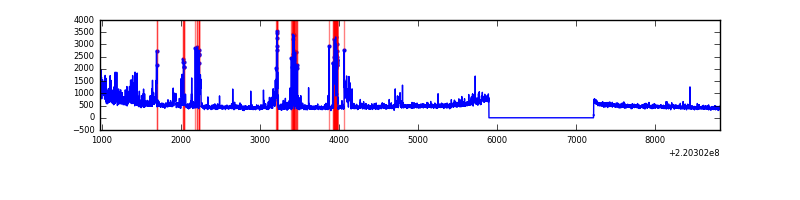 |
| B | 7844 | 6520 | 7 | 7 | 0.09% | 0.11% | 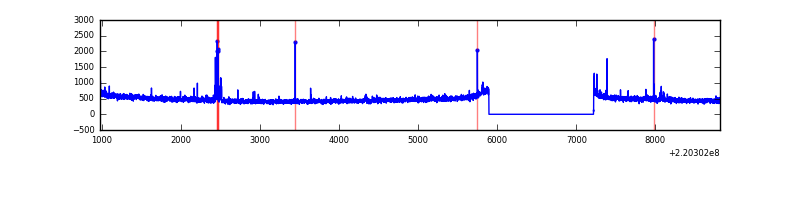 |
| C | 7844 | 6520 | 1 | 1 | 0.01% | 0.02% | 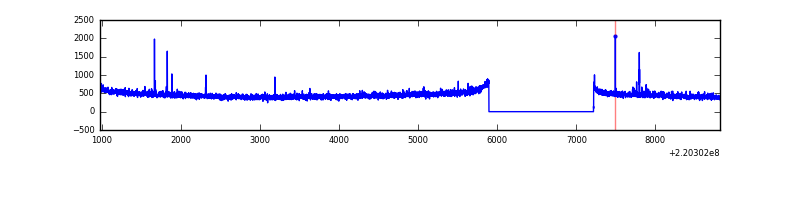 |
| D | 7844 | 6520 | 922 | 922 | 11.75% | 14.14% | 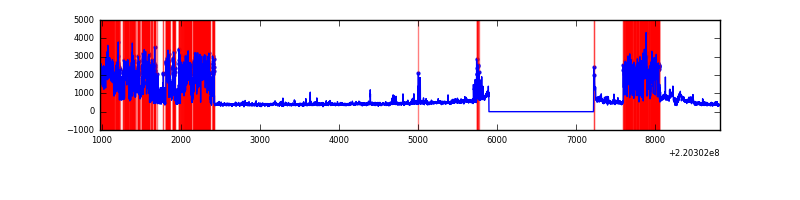 |
Top three noisy pixels from each quadrant. If the there are fewer than three noisy pixels in the level2.evt file, extra rows are filled as -1
| Pixel properties | Quadrant properties | ||||||
|---|---|---|---|---|---|---|---|
| Quadrant | DetID | PixID | Counts | Sigma | Mean | Median | Sigma |
| A | 14 | 111 | 675055 | 4361.59 | 766 | 751 | 154.6 |
| A | 8 | 15 | 42991 | 273.22 | 766 | 751 | 154.6 |
| A | 13 | 251 | 29835 | 188.12 | 766 | 751 | 154.6 |
| B | 3 | 220 | 39735 | 260.69 | 789 | 772 | 149.5 |
| B | 10 | 252 | 19070 | 122.43 | 789 | 772 | 149.5 |
| B | 12 | 111 | 14815 | 93.96 | 789 | 772 | 149.5 |
| C | 10 | 22 | 15419 | 84.03 | 755 | 759 | 174.5 |
| C | 9 | 247 | 9394 | 49.49 | 755 | 759 | 174.5 |
| C | 13 | 61 | 5964 | 29.83 | 755 | 759 | 174.5 |
| D | 2 | 33 | 2662292 | 15376.73 | 704 | 682 | 173.1 |
| D | 12 | 221 | 167627 | 964.48 | 704 | 682 | 173.1 |
| D | 8 | 195 | 135303 | 777.73 | 704 | 682 | 173.1 |
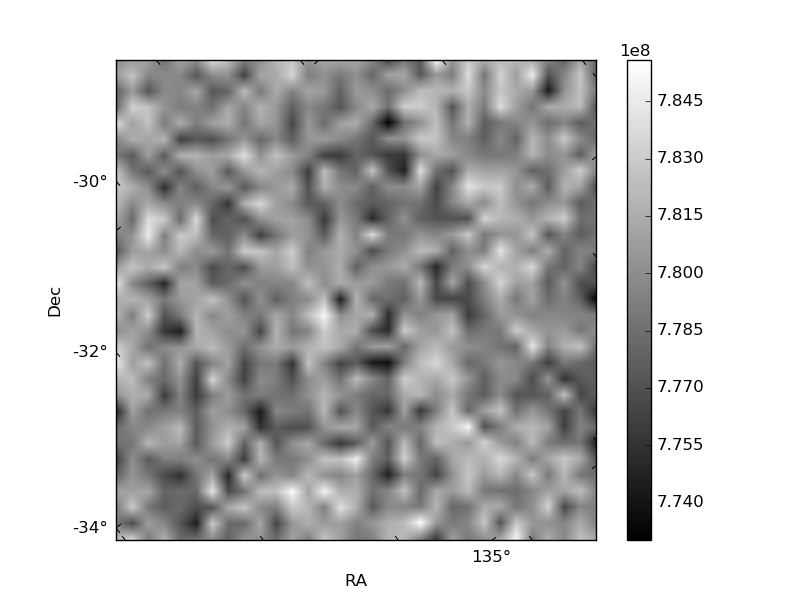
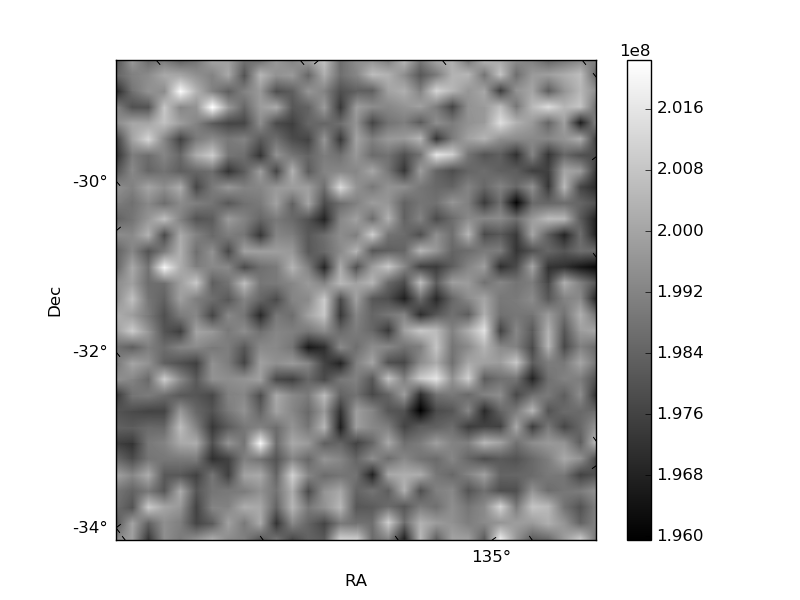
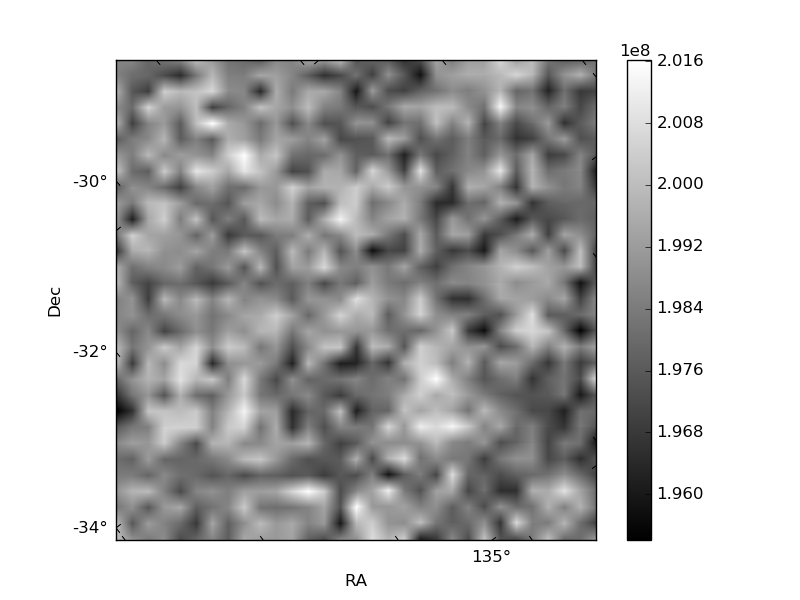
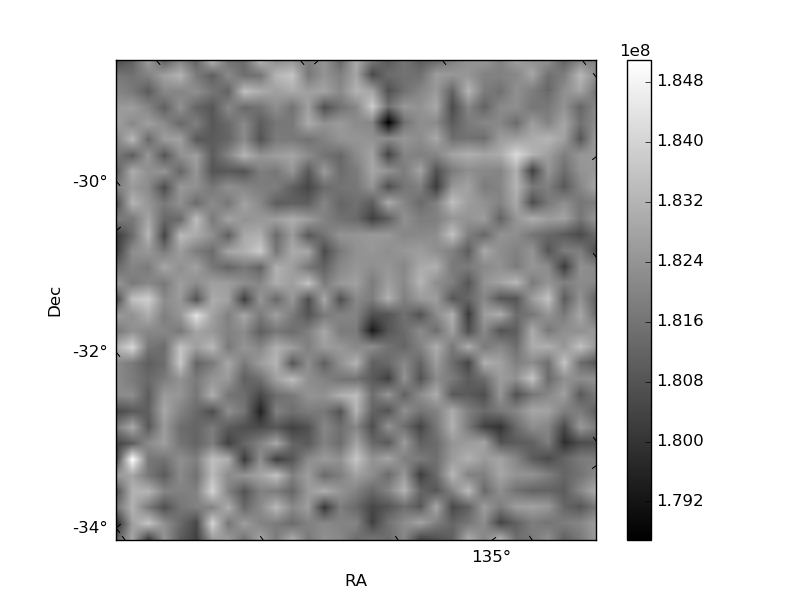
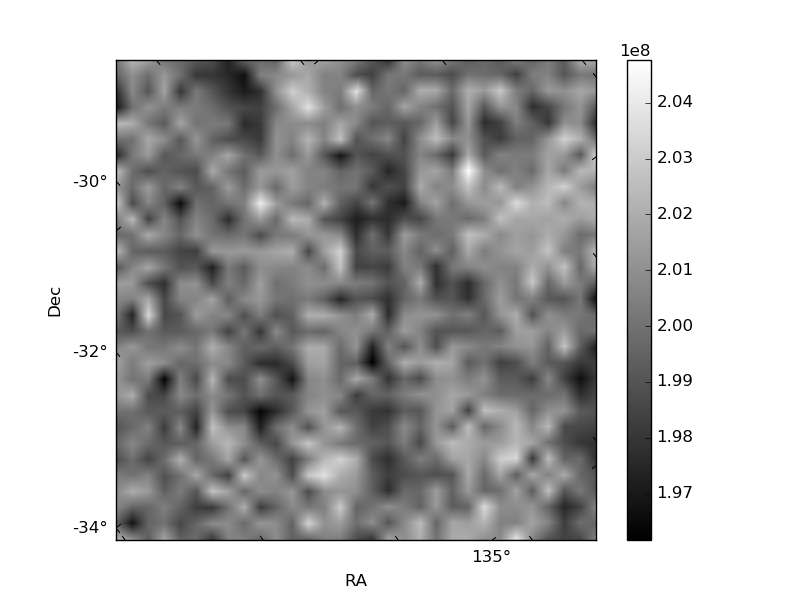
Histogram calculated using DETX and DETY for each event in the final _common_clean file
| Quadrant A | 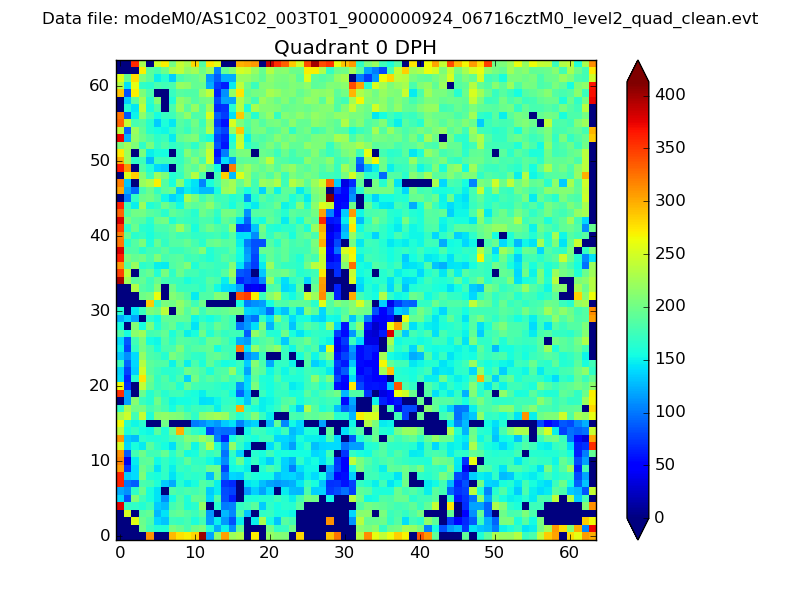 |
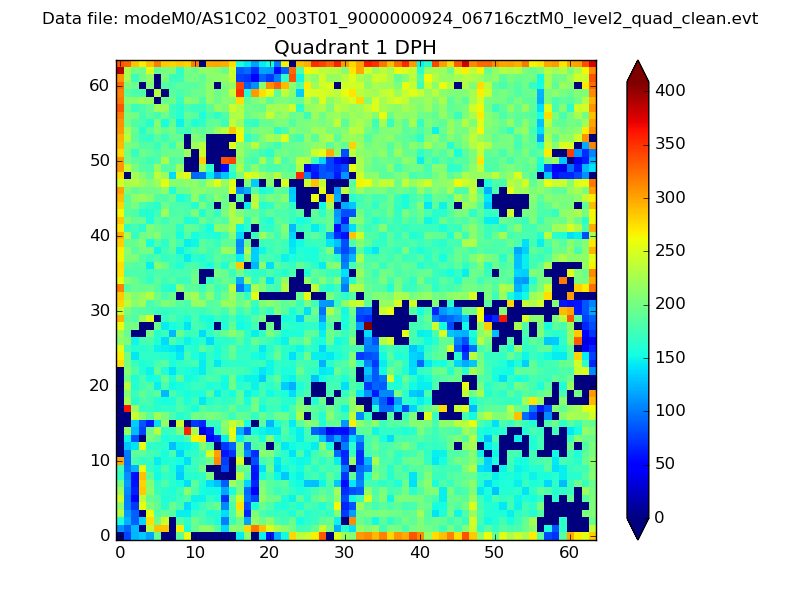 |
Quadrant B |
|---|---|---|---|
| Quadrant D | 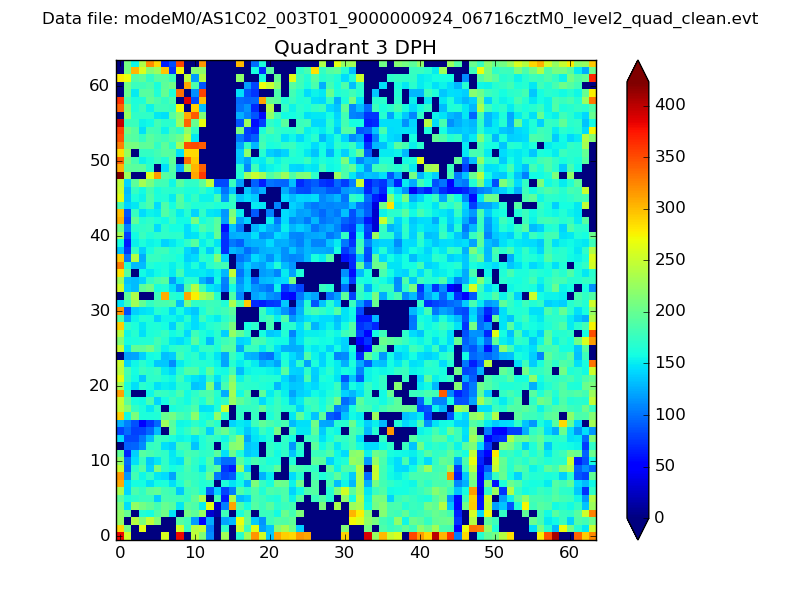 |
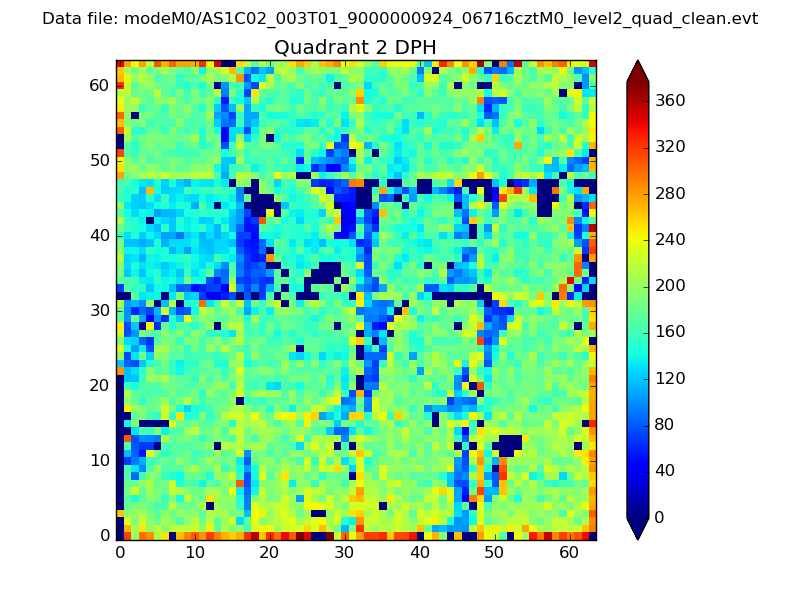 |
Quadrant C |
| Plot type | Count rate plots | Images |
|---|---|---|
| Comparison with Poisson distribution Blue bars denote a histogram of data divided into 1 sec bins. Red curve is a Poisson curve with rate = median count rate of data. |
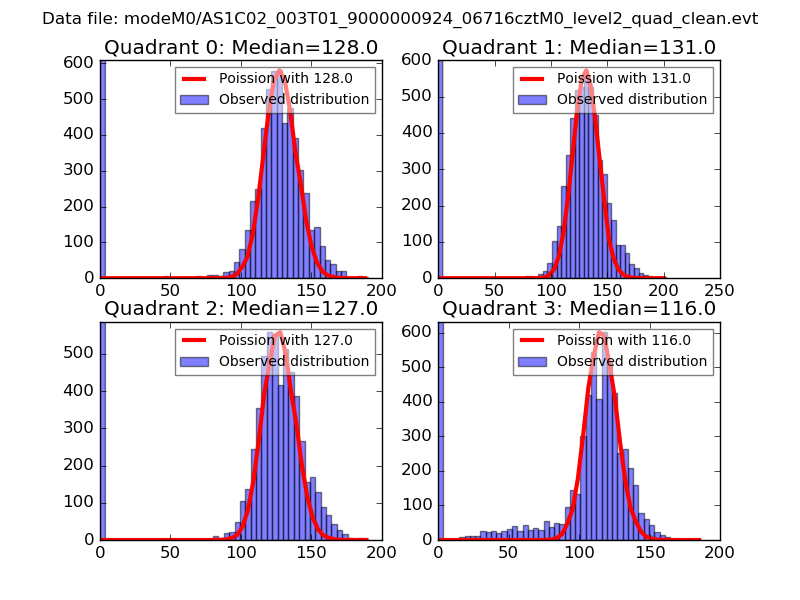 |
 |
| Quadrant-wise count rates Data is divided into 100 sec bins |
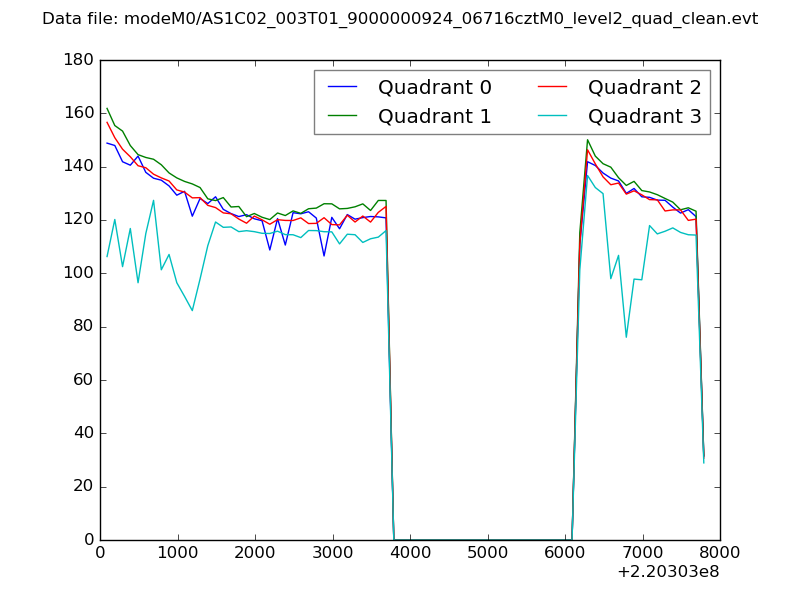 |
|
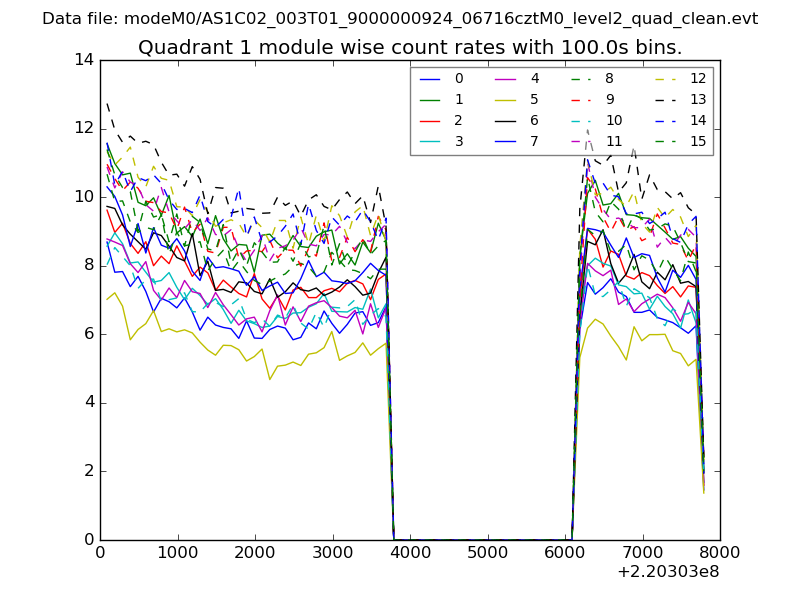
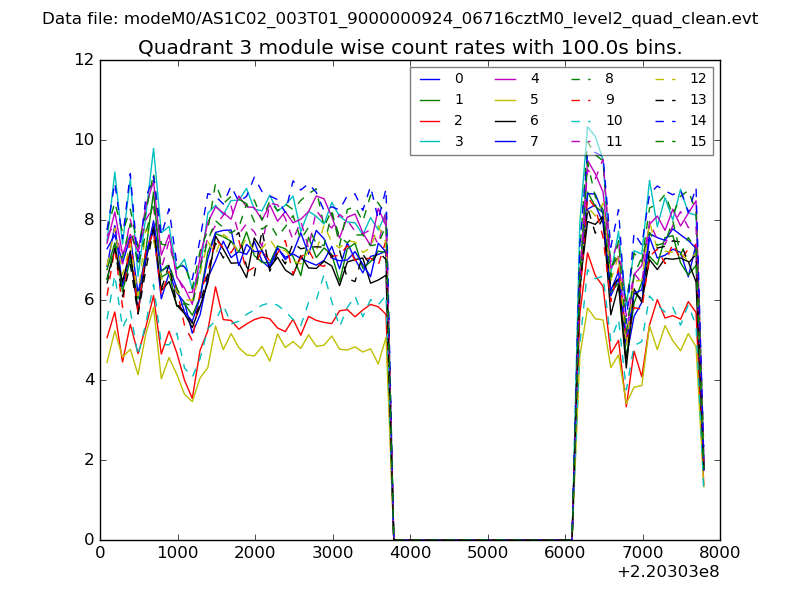
| Module-wise count rates for Quadrant A Data is divided into 100 sec bins |
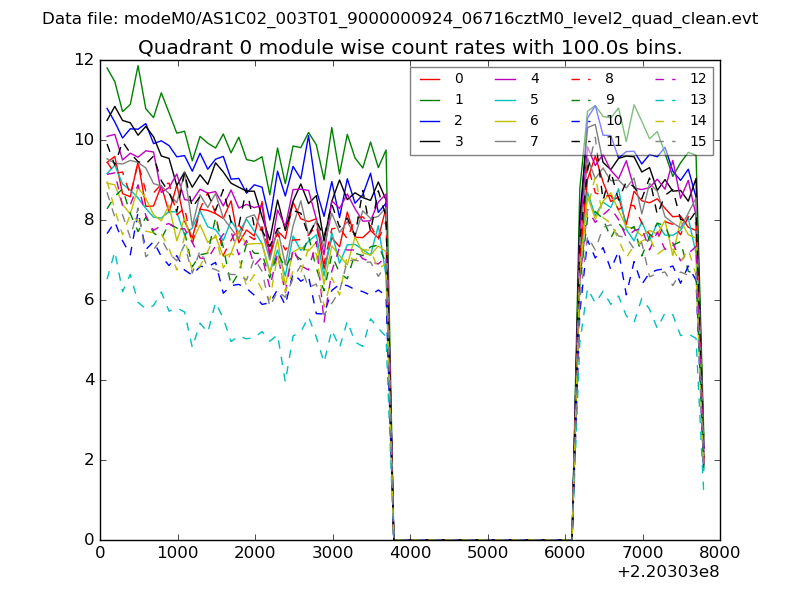 |
 |
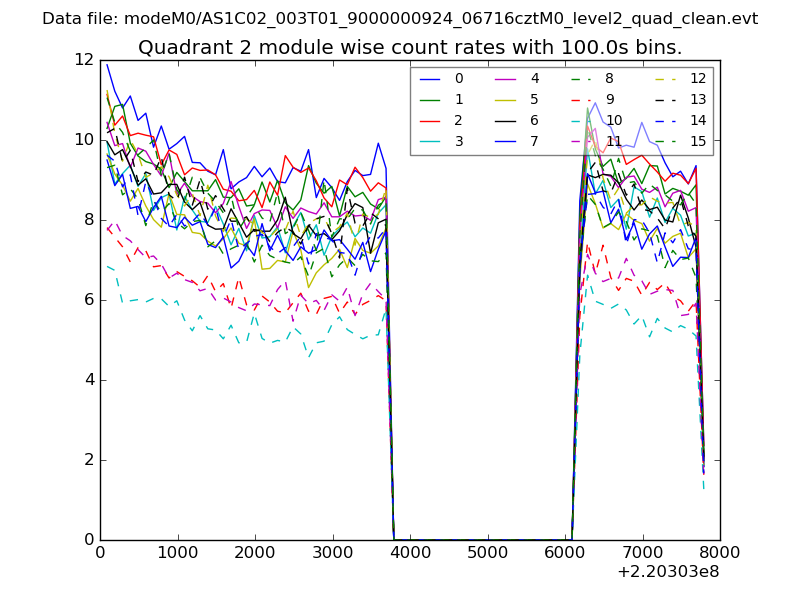
| Module-wise count rates for Quadrant B Data is divided into 100 sec bins |
 |
 |
| Module-wise count rates for Quadrant C Data is divided into 100 sec bins |
 |
 |
| Module-wise count rates for Quadrant D Data is divided into 100 sec bins |
 |
 |
| Parameter | Plot |
|---|---|
| CZT HV Monitor | 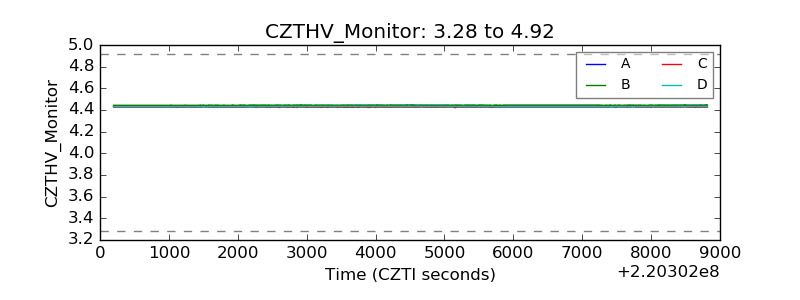 |
| D_VDD | 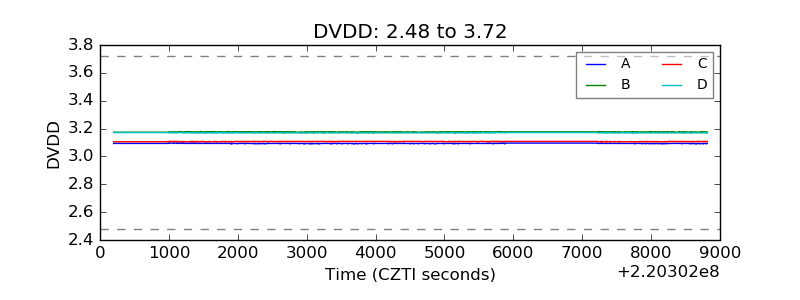 |
| Temperature 1 | 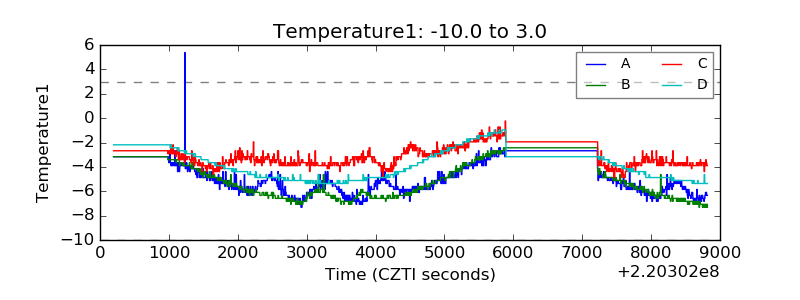 |
| Veto HV Monitor | 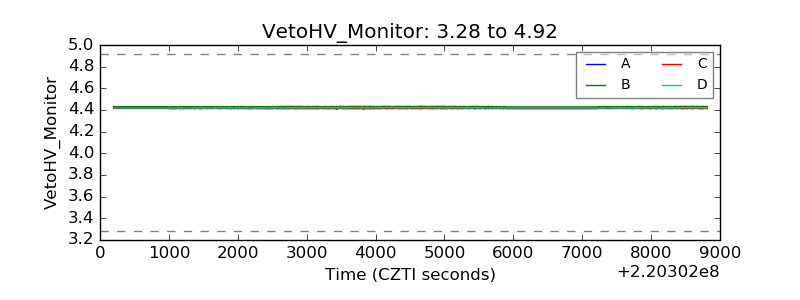 |
| Veto LLD | 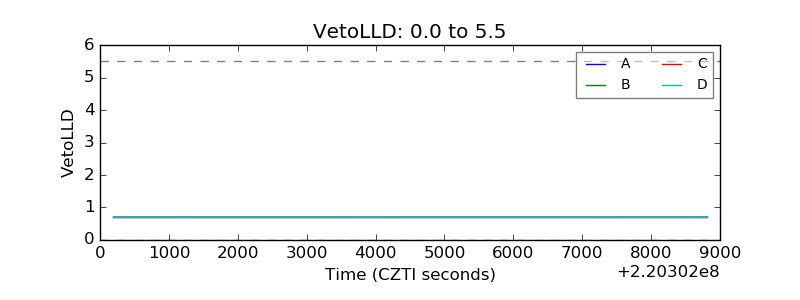 |
| Alpha Counter | 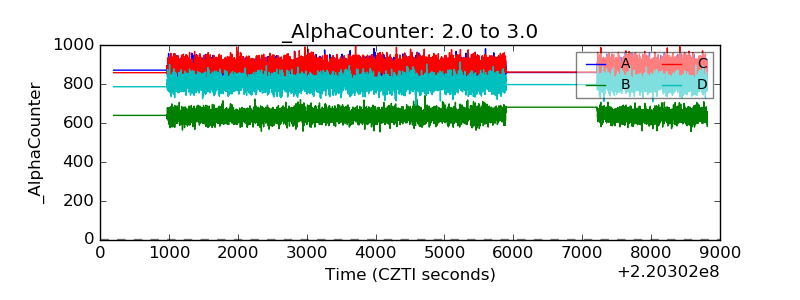 |
| _CPM_Rate | 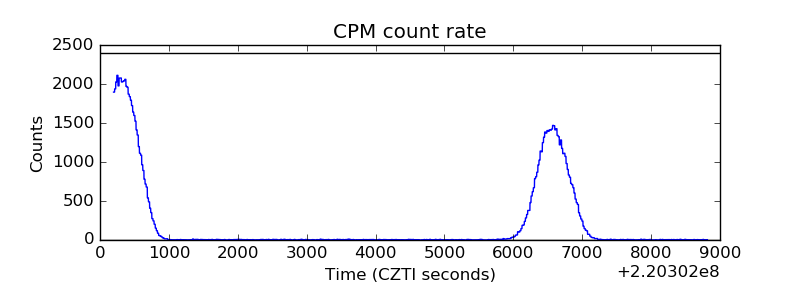 |
| CZT Counter |  |
| +2.5 Volts monitor | 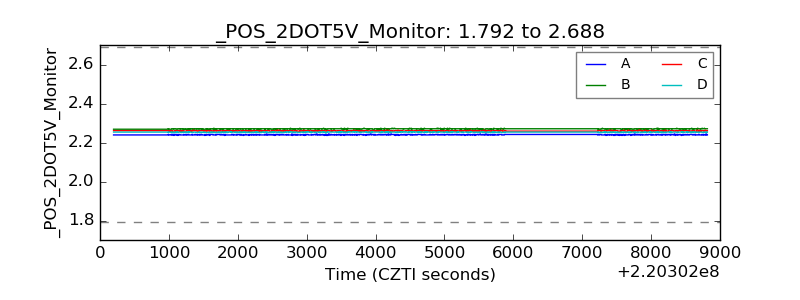 |
| +5 Volts monitor |  |
| _ROLL_ROT | 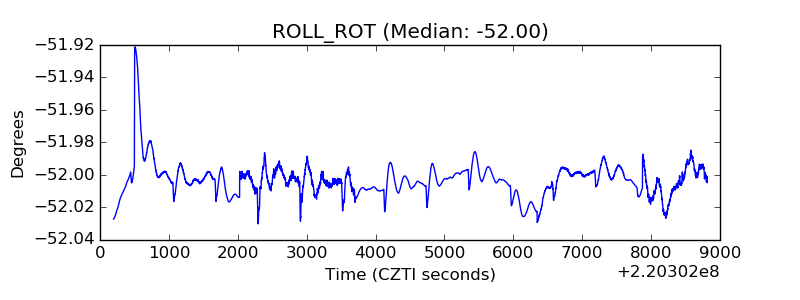 |
| _Roll_DEC | 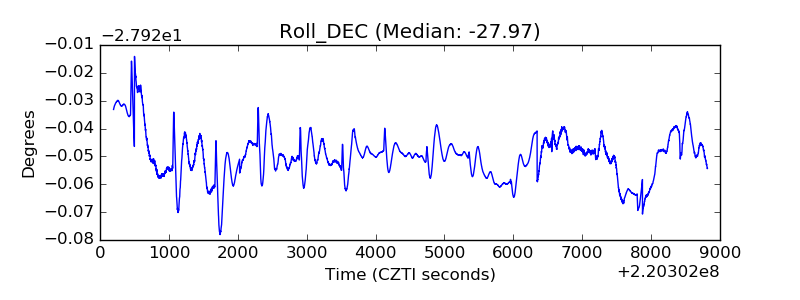 |
| _Roll_RA | 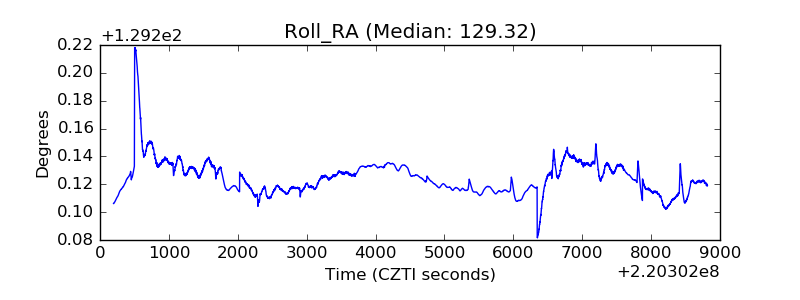 |
| Veto Counter |  |