| Param | Original file | Final file |
|---|---|---|
| Filename | modeM0/AS1C02_003T01_9000000924_06718cztM0_level2.evt | modeM0/AS1C02_003T01_9000000924_06718cztM0_level2_quad_clean.evt |
| Size (bytes) | 473,094,720 | 89,153,280 |
| Size | 451.2 MB | 85.0 MB |
| Events in quadrant A | 3,177,765 | 566,729 |
| Events in quadrant B | 3,122,184 | 578,769 |
| Events in quadrant C | 3,053,181 | 561,039 |
| Events in quadrant D | 4,504,867 | 511,860 |
| Mode M9 | |||
|---|---|---|---|
| Quadrant | BADHDUFLAG | Total packets | Discarded packets |
| A | 0 | 14 | 0 |
| B | 0 | 14 | 0 |
| C | 0 | 14 | 0 |
| D | 0 | 15 | 0 |
| Mode SS | |||
|---|---|---|---|
| Quadrant | BADHDUFLAG | Total packets | Discarded packets |
| A | 0 | 142 | 0 |
| B | 0 | 142 | 0 |
| C | 0 | 142 | 0 |
| D | 0 | 142 | 0 |
| Mode M0 | |||
|---|---|---|---|
| Quadrant | BADHDUFLAG | Total packets | Discarded packets |
| A | 0 | 14427 | 3 |
| B | 0 | 14166 | 2 |
| C | 0 | 14087 | 2 |
| D | 0 | 18137 | 2 |
| Quadrant | Total seconds | Saturated seconds | Saturation percentage |
|---|---|---|---|
| A | 6902 | 29 | 0.420168% |
| B | 6902 | 24 | 0.347725% |
| C | 6902 | 9 | 0.130397% |
| D | 6902 | 451 | 6.534338% |
Noise dominated data is calculated using 1-second bins in cleaned event files. If a bin has >2000 counts, and if more than 50% of those come from <1% of pixels, then it is considered to be noise-dominated and hence unusable.
| Quadrant | # 1 sec bins | Bins with >0 counts | Bins with >2000 counts | High rate bins dominated by noise | Noise dominated (total time) | Noise dominated (detector-on time) | Marked lightcurve |
|---|---|---|---|---|---|---|---|
| A | 7847 | 6903 | 19 | 19 | 0.24% | 0.28% | 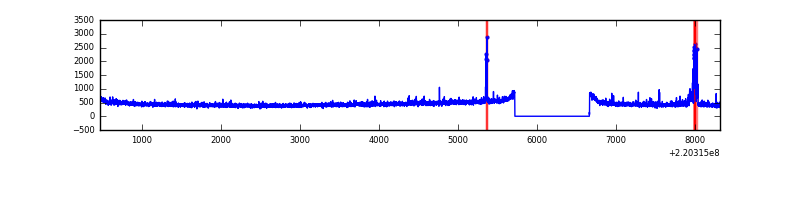 |
| B | 7847 | 6903 | 5 | 5 | 0.06% | 0.07% | 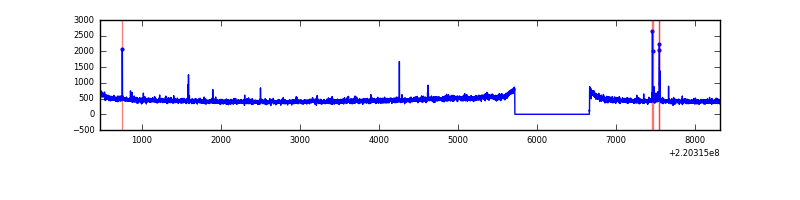 |
| C | 7847 | 6903 | 0 | 0 | 0.00% | 0.00% | 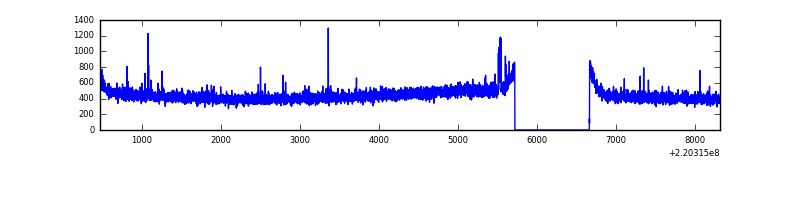 |
| D | 7847 | 6903 | 398 | 398 | 5.07% | 5.77% | 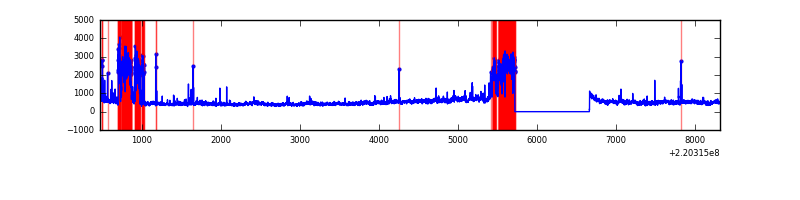 |
Top three noisy pixels from each quadrant. If the there are fewer than three noisy pixels in the level2.evt file, extra rows are filled as -1
| Pixel properties | Quadrant properties | ||||||
|---|---|---|---|---|---|---|---|
| Quadrant | DetID | PixID | Counts | Sigma | Mean | Median | Sigma |
| A | 14 | 111 | 133377 | 828.61 | 783 | 767 | 160.0 |
| A | 8 | 15 | 32654 | 199.25 | 783 | 767 | 160.0 |
| A | 0 | 226 | 7466 | 41.86 | 783 | 767 | 160.0 |
| B | 10 | 252 | 29632 | 188.83 | 796 | 777 | 152.8 |
| B | 12 | 111 | 15774 | 98.14 | 796 | 777 | 152.8 |
| B | 11 | 111 | 12316 | 75.51 | 796 | 777 | 152.8 |
| C | 10 | 22 | 15977 | 84.64 | 769 | 775 | 179.6 |
| C | 8 | 128 | 14365 | 75.66 | 769 | 775 | 179.6 |
| C | 9 | 247 | 10324 | 53.16 | 769 | 775 | 179.6 |
| D | 2 | 33 | 1064673 | 5988.17 | 726 | 703 | 177.7 |
| D | 8 | 195 | 517657 | 2909.49 | 726 | 703 | 177.7 |
| D | 2 | 152 | 108258 | 605.33 | 726 | 703 | 177.7 |
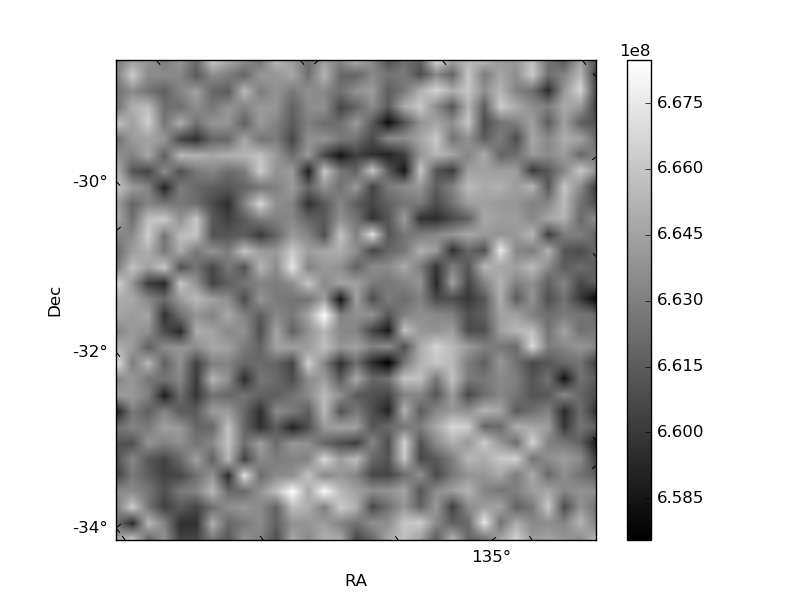
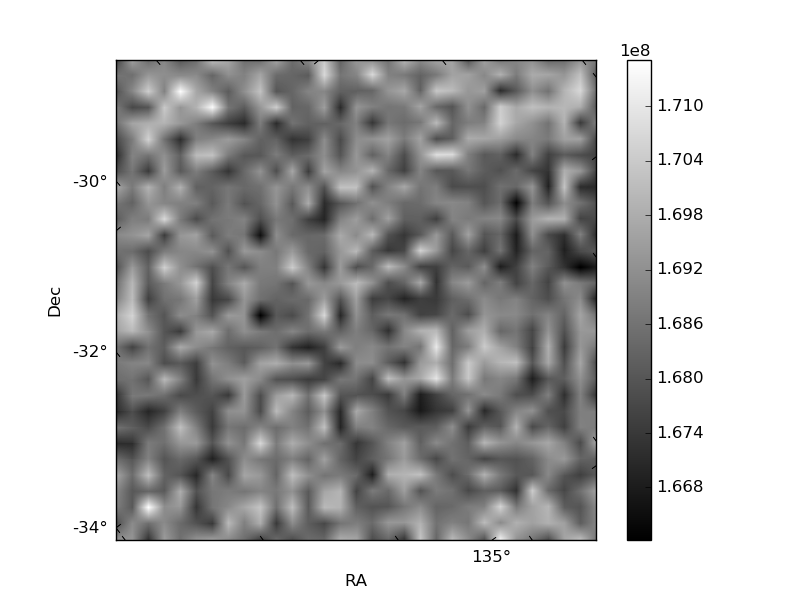
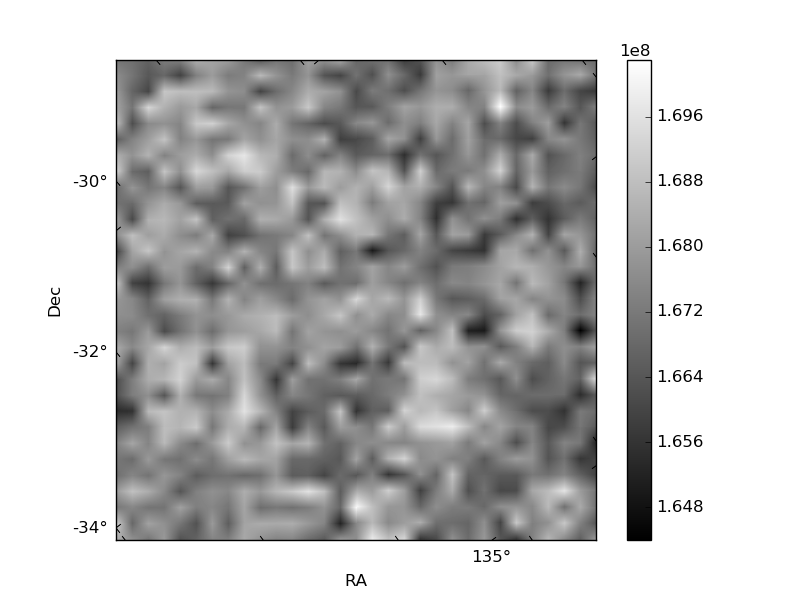
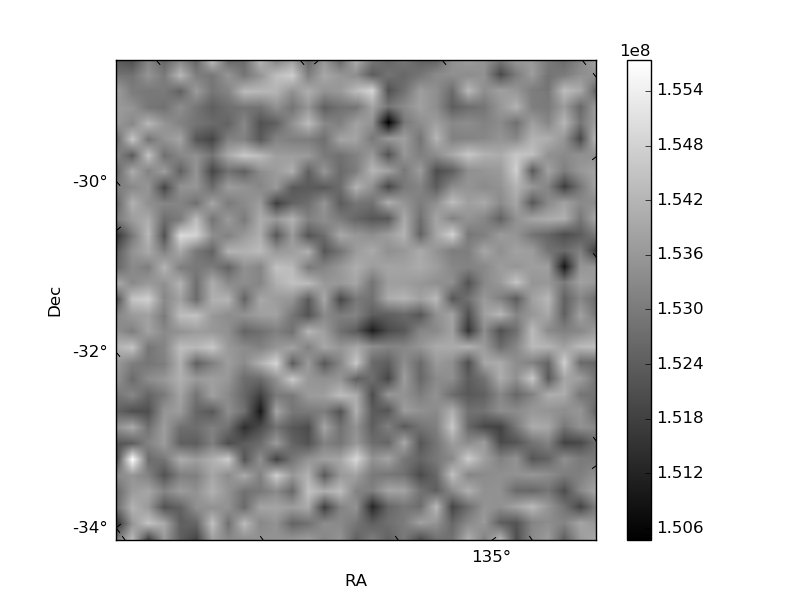
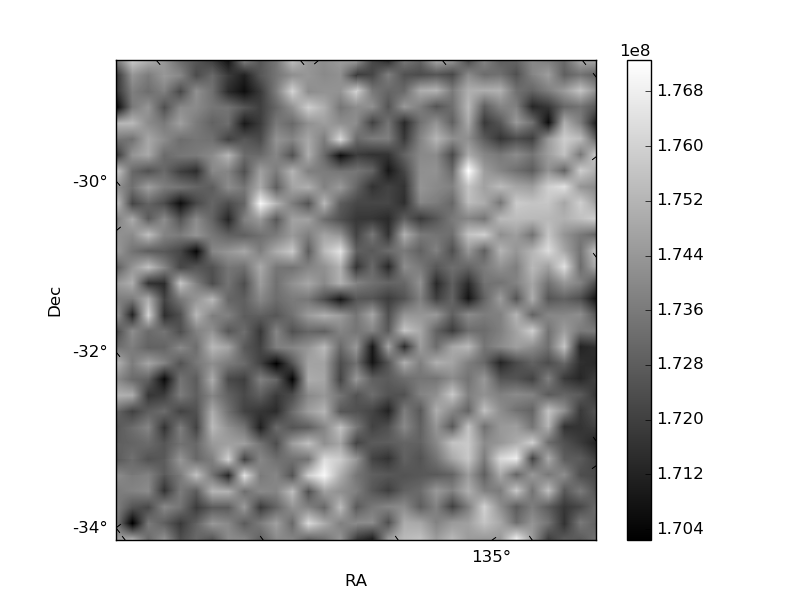
Histogram calculated using DETX and DETY for each event in the final _common_clean file
| Quadrant A | 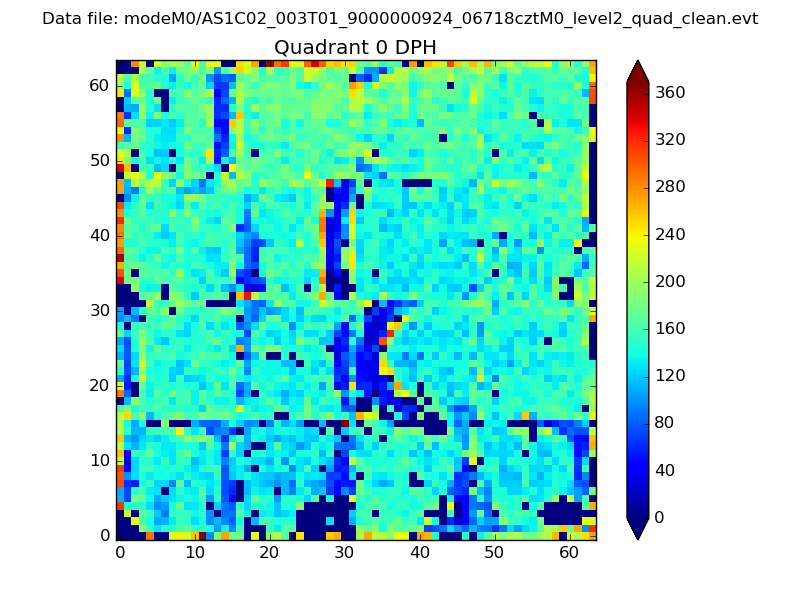 |
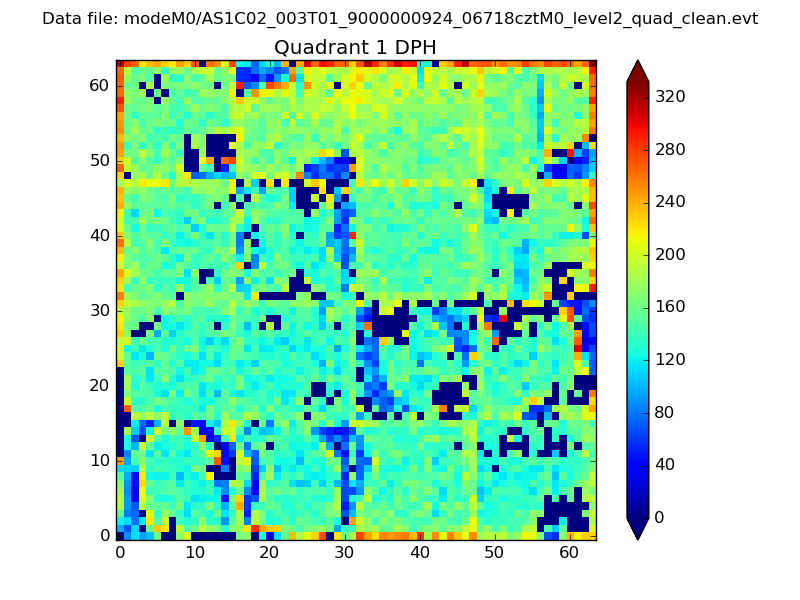 |
Quadrant B |
|---|---|---|---|
| Quadrant D | 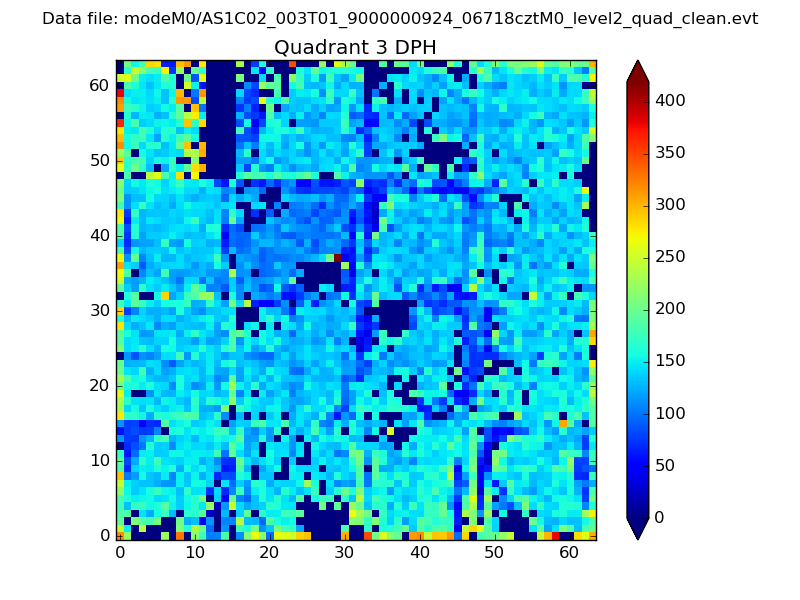 |
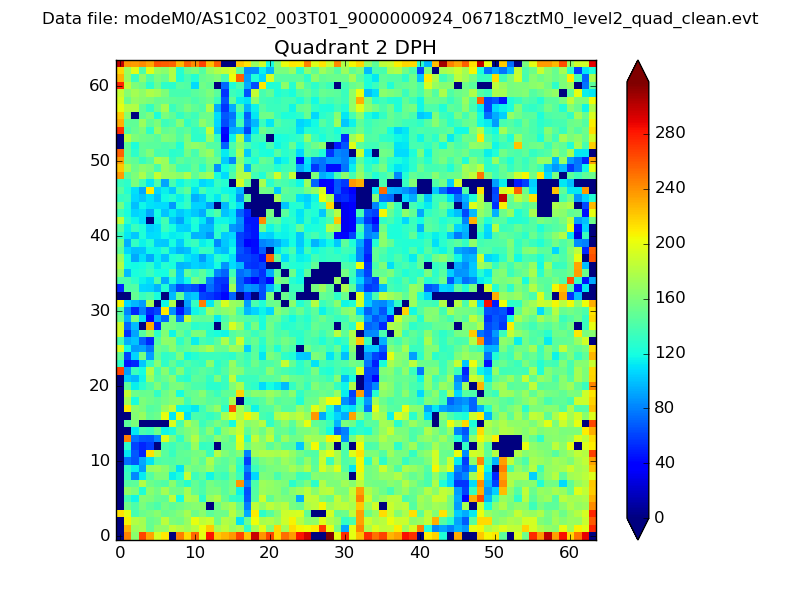 |
Quadrant C |
| Plot type | Count rate plots | Images |
|---|---|---|
| Comparison with Poisson distribution Blue bars denote a histogram of data divided into 1 sec bins. Red curve is a Poisson curve with rate = median count rate of data. |
 |
 |
| Quadrant-wise count rates Data is divided into 100 sec bins |
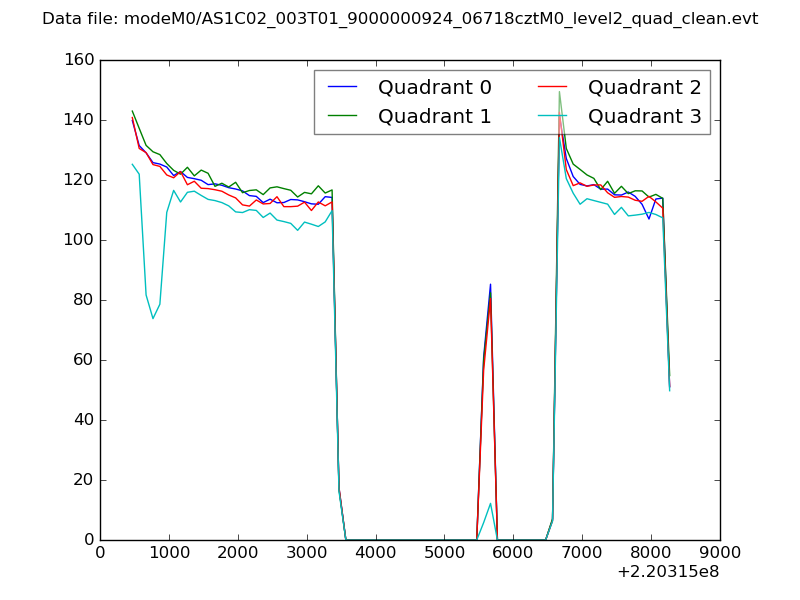 |
|
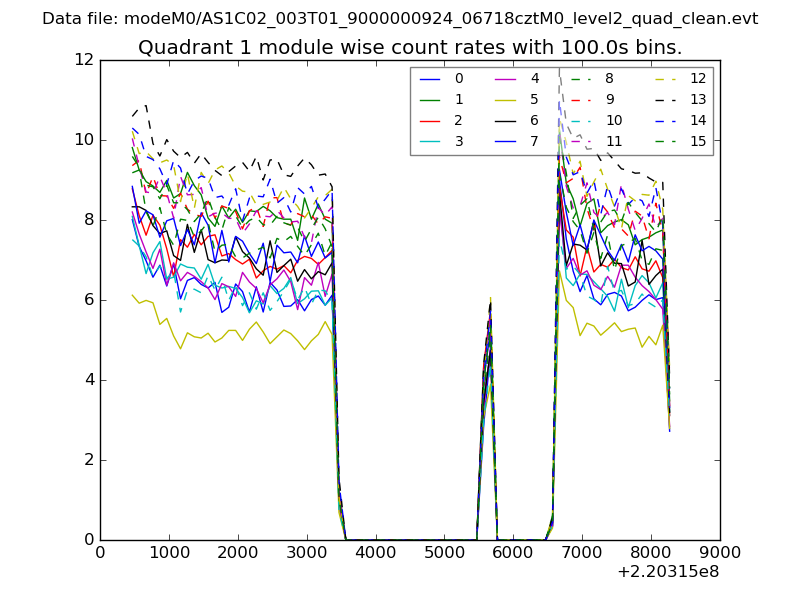
| Module-wise count rates for Quadrant A Data is divided into 100 sec bins |
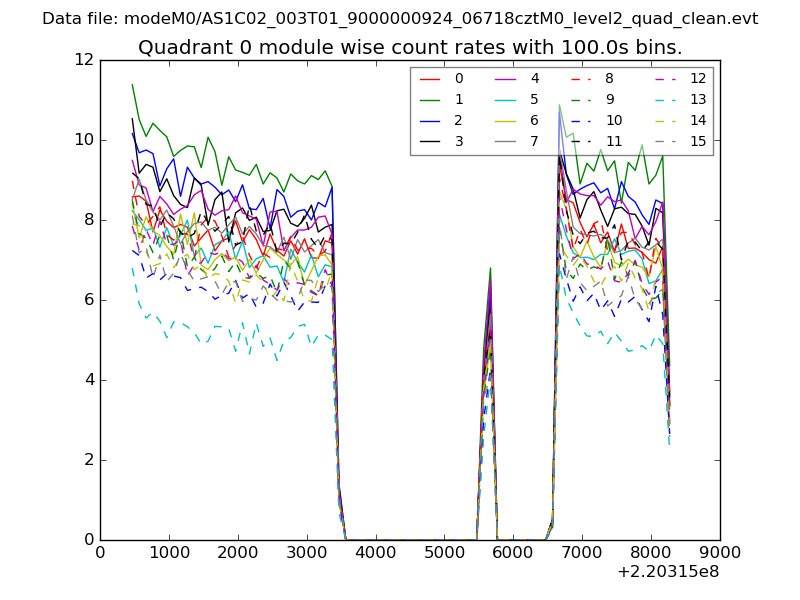 |
 |
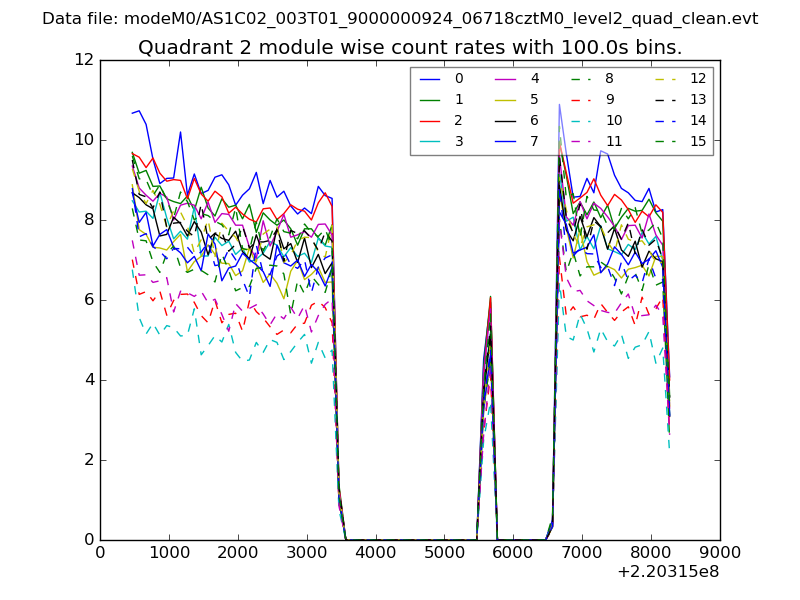
| Module-wise count rates for Quadrant B Data is divided into 100 sec bins |
 |
 |
| Module-wise count rates for Quadrant C Data is divided into 100 sec bins |
 |
 |
| Module-wise count rates for Quadrant D Data is divided into 100 sec bins |
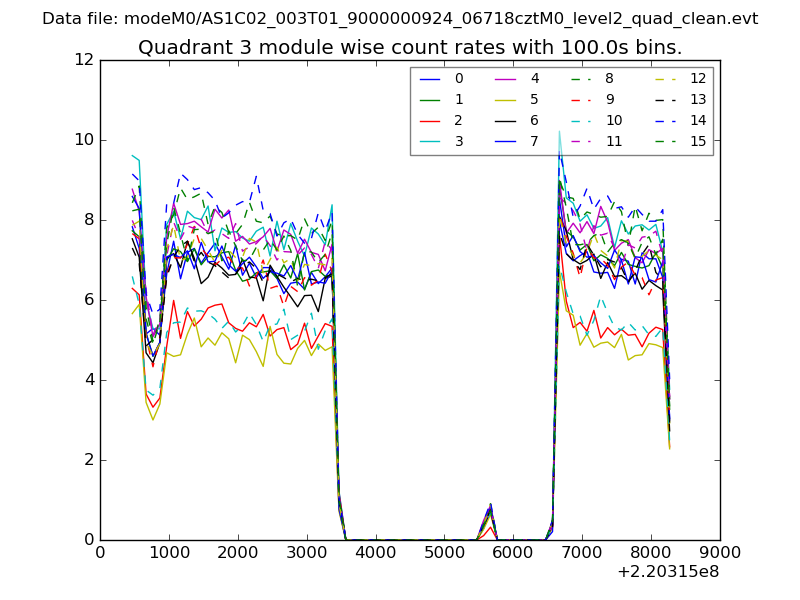 |
 |
| Parameter | Plot |
|---|---|
| CZT HV Monitor | 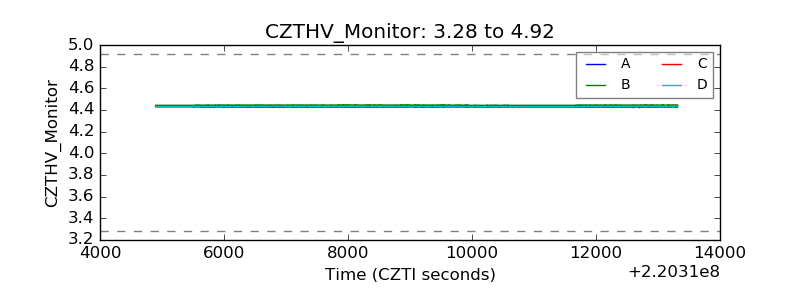 |
| D_VDD | 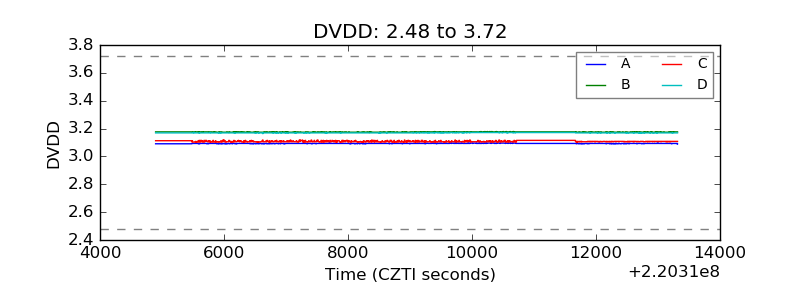 |
| Temperature 1 | 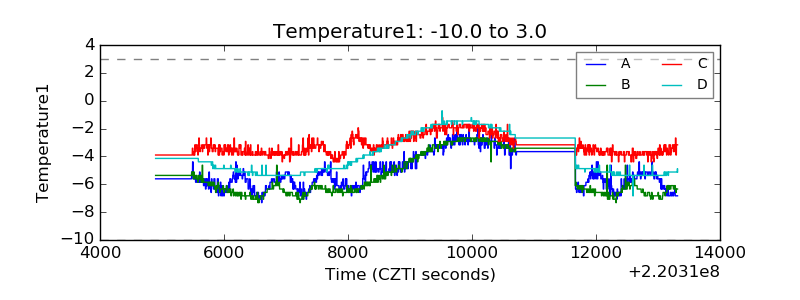 |
| Veto HV Monitor | 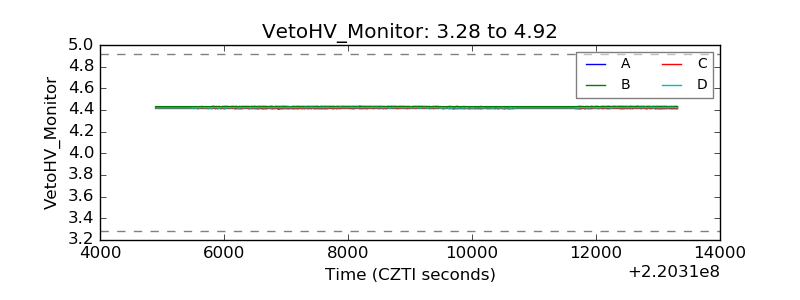 |
| Veto LLD | 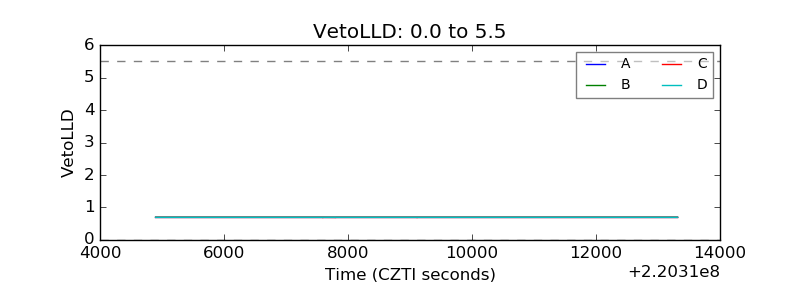 |
| Alpha Counter | 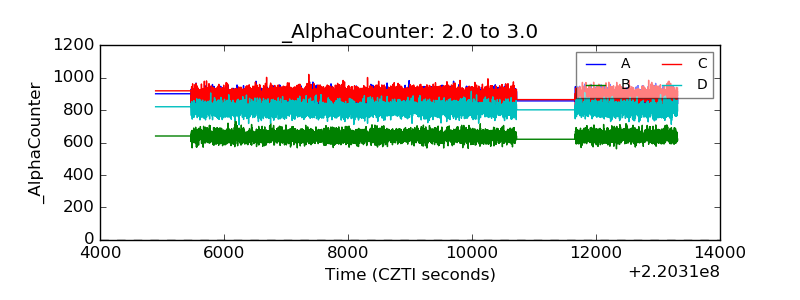 |
| _CPM_Rate | 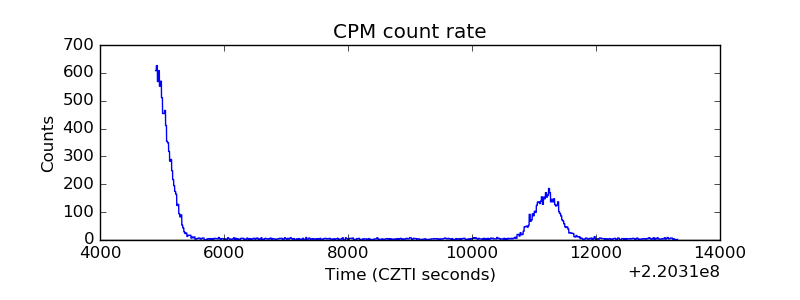 |
| CZT Counter | 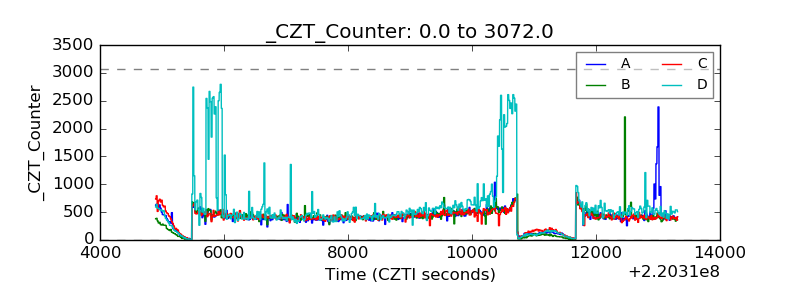 |
| +2.5 Volts monitor | 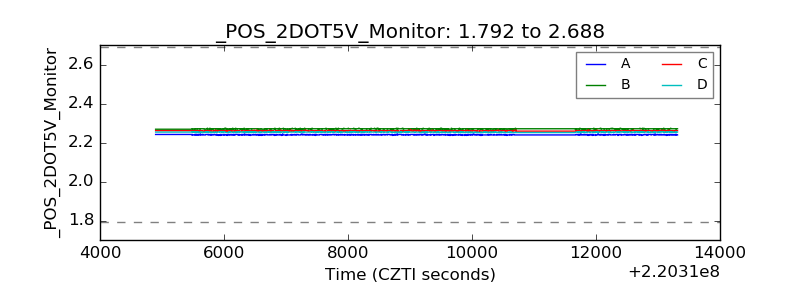 |
| +5 Volts monitor |  |
| _ROLL_ROT | 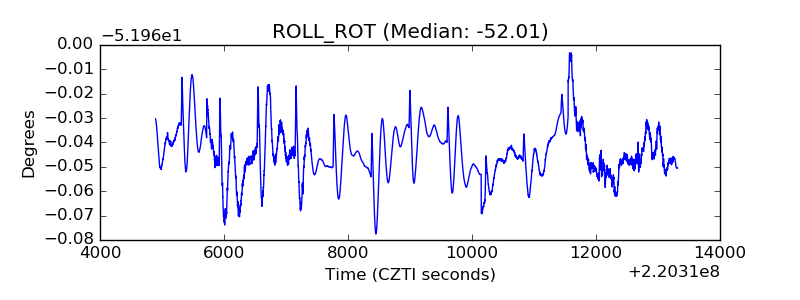 |
| _Roll_DEC | 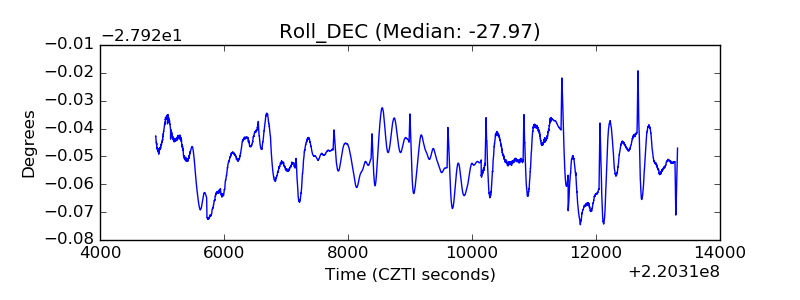 |
| _Roll_RA | 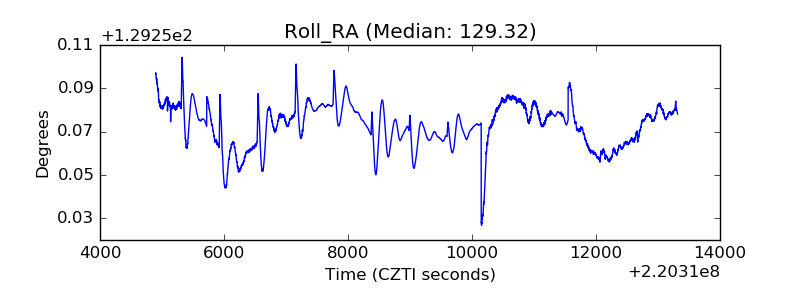 |
| Veto Counter | 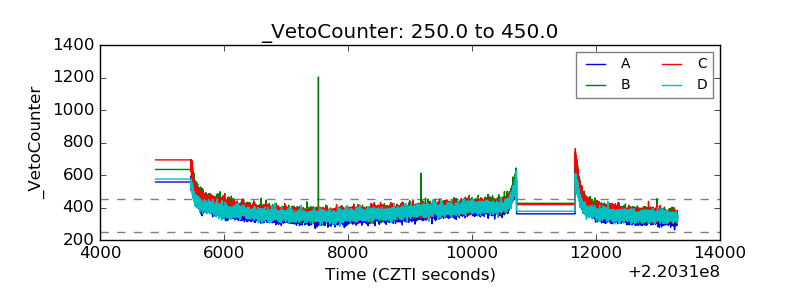 |