| Param | Original file | Final file |
|---|---|---|
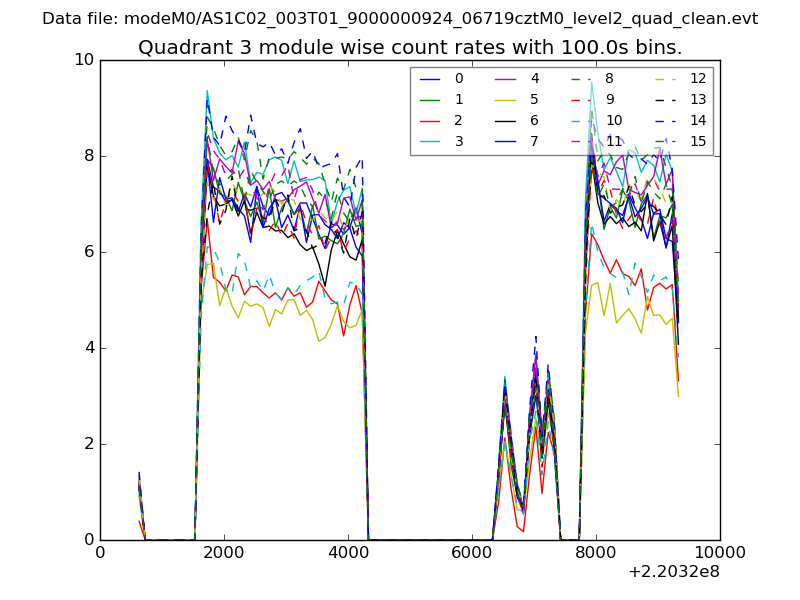
| Filename | modeM0/AS1C02_003T01_9000000924_06719cztM0_level2.evt | modeM0/AS1C02_003T01_9000000924_06719cztM0_level2_quad_clean.evt |
| Size (bytes) | 619,980,480 | 94,587,840 |
| Size | 591.3 MB | 90.2 MB |
| Events in quadrant A | 4,141,900 | 603,788 |
| Events in quadrant B | 3,449,212 | 627,617 |
| Events in quadrant C | 3,390,313 | 611,482 |
| Events in quadrant D | 7,283,111 | 496,506 |
| Mode M9 | |||
|---|---|---|---|
| Quadrant | BADHDUFLAG | Total packets | Discarded packets |
| A | 0 | 13 | 0 |
| B | 0 | 13 | 0 |
| C | 0 | 13 | 0 |
| D | 0 | 13 | 0 |
| Mode SS | |||
|---|---|---|---|
| Quadrant | BADHDUFLAG | Total packets | Discarded packets |
| A | 0 | 158 | 0 |
| B | 0 | 158 | 0 |
| C | 0 | 158 | 0 |
| D | 0 | 158 | 0 |
| Mode M0 | |||
|---|---|---|---|
| Quadrant | BADHDUFLAG | Total packets | Discarded packets |
| A | 0 | 17596 | 4 |
| B | 0 | 15577 | 3 |
| C | 0 | 15614 | 3 |
| D | 0 | 26317 | 3 |
| Quadrant | Total seconds | Saturated seconds | Saturation percentage |
|---|---|---|---|
| A | 7528 | 201 | 2.670032% |
| B | 7528 | 67 | 0.890011% |
| C | 7528 | 47 | 0.624336% |
| D | 7528 | 1703 | 22.622210% |
Noise dominated data is calculated using 1-second bins in cleaned event files. If a bin has >2000 counts, and if more than 50% of those come from <1% of pixels, then it is considered to be noise-dominated and hence unusable.
| Quadrant | # 1 sec bins | Bins with >0 counts | Bins with >2000 counts | High rate bins dominated by noise | Noise dominated (total time) | Noise dominated (detector-on time) | Marked lightcurve |
|---|---|---|---|---|---|---|---|
| A | 8963 | 7530 | 165 | 165 | 1.84% | 2.19% | 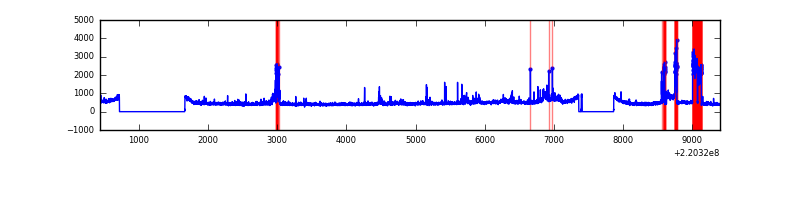 |
| B | 8963 | 7530 | 4 | 4 | 0.04% | 0.05% | 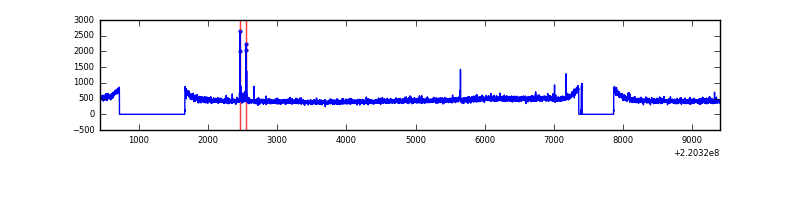 |
| C | 8963 | 7531 | 4 | 4 | 0.04% | 0.05% | 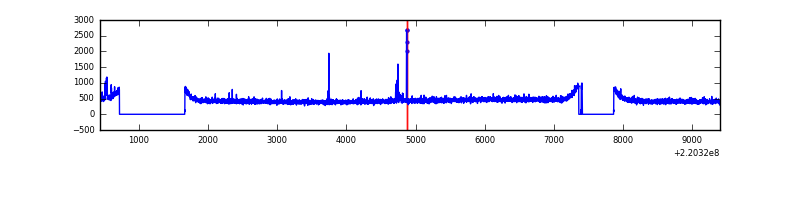 |
| D | 8963 | 7531 | 1362 | 1362 | 15.20% | 18.09% | 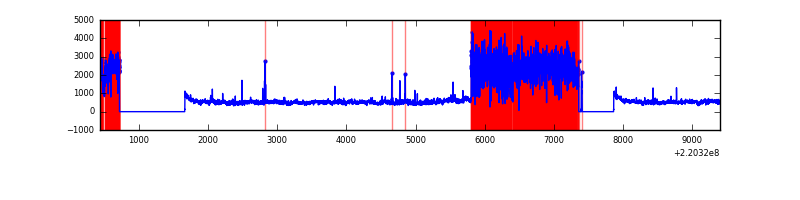 |
Top three noisy pixels from each quadrant. If the there are fewer than three noisy pixels in the level2.evt file, extra rows are filled as -1
| Pixel properties | Quadrant properties | ||||||
|---|---|---|---|---|---|---|---|
| Quadrant | DetID | PixID | Counts | Sigma | Mean | Median | Sigma |
| A | 14 | 111 | 732119 | 4109.49 | 862 | 841 | 177.9 |
| A | 13 | 251 | 56214 | 311.17 | 862 | 841 | 177.9 |
| A | 8 | 15 | 38457 | 211.39 | 862 | 841 | 177.9 |
| B | 10 | 252 | 25122 | 141.66 | 882 | 858 | 171.3 |
| B | 12 | 111 | 17463 | 96.94 | 882 | 858 | 171.3 |
| B | 11 | 111 | 14029 | 76.89 | 882 | 858 | 171.3 |
| C | 10 | 22 | 51466 | 253.57 | 854 | 857 | 199.6 |
| C | 13 | 61 | 6579 | 28.67 | 854 | 857 | 199.6 |
| C | 12 | 4 | 5703 | 24.28 | 854 | 857 | 199.6 |
| D | 2 | 33 | 3724530 | 21845.07 | 698 | 676 | 170.5 |
| D | 8 | 195 | 815748 | 4781.42 | 698 | 676 | 170.5 |
| D | 2 | 152 | 65293 | 379.06 | 698 | 676 | 170.5 |
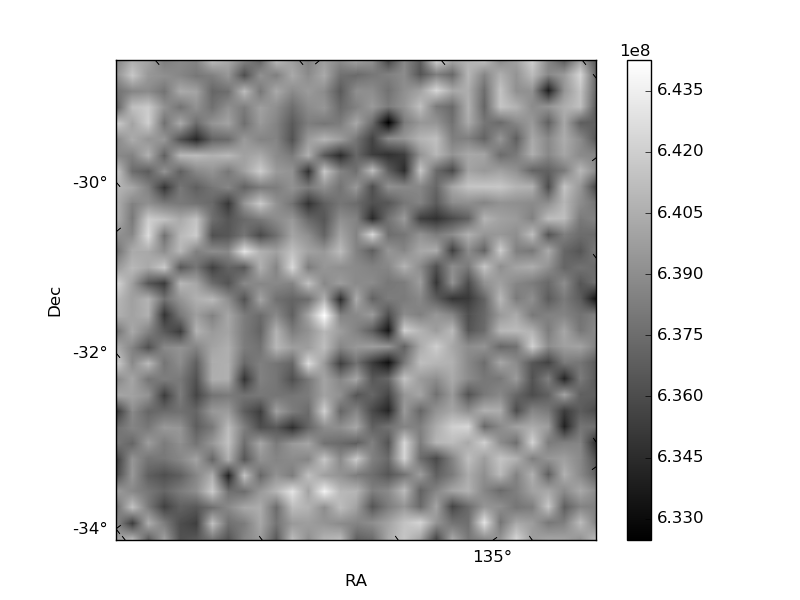
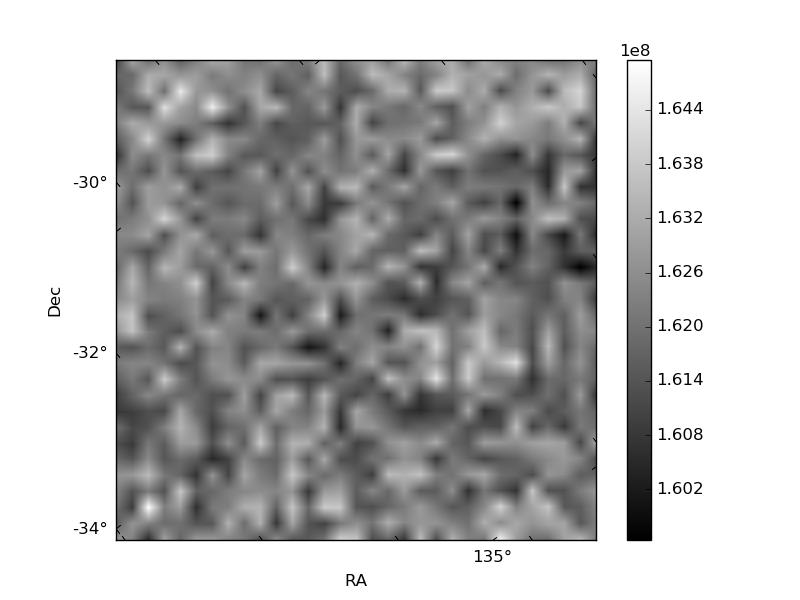
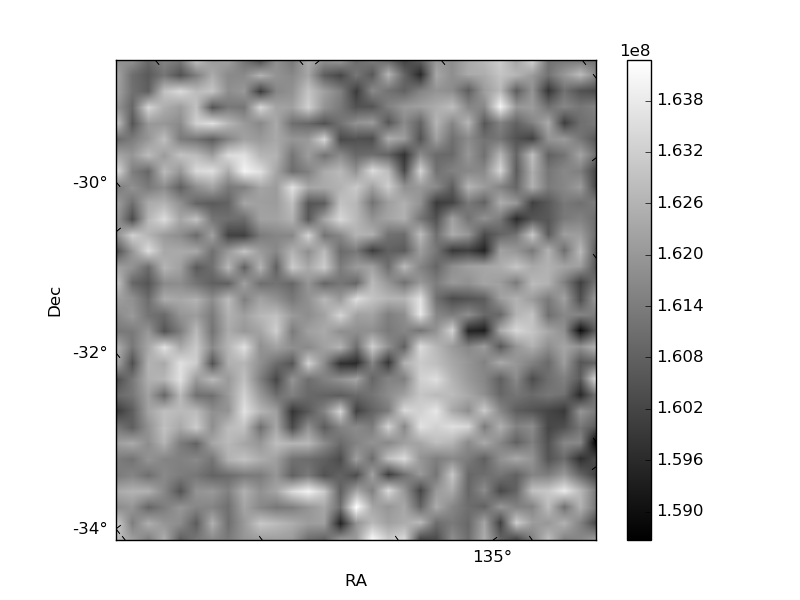
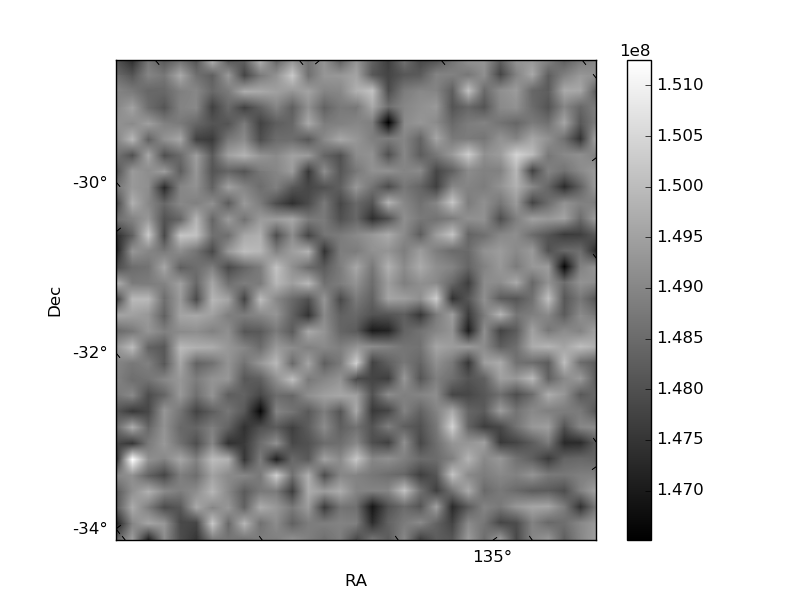
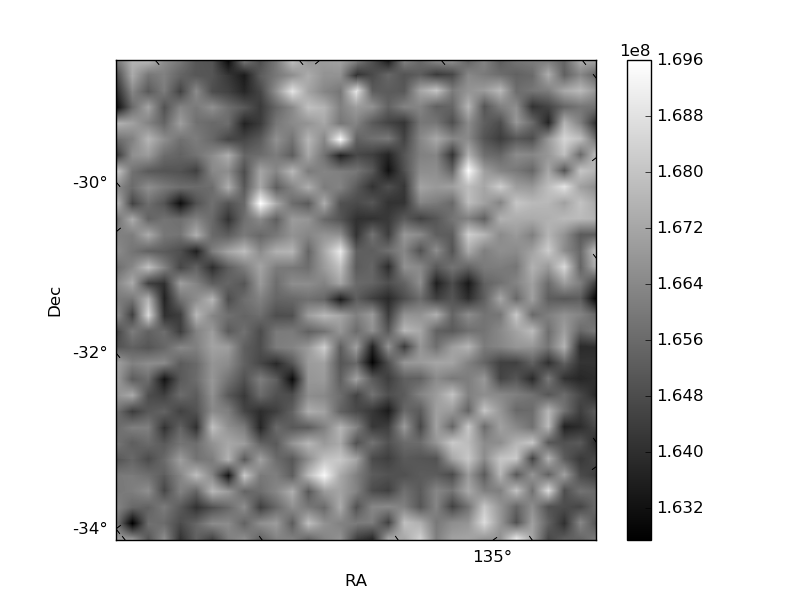
Histogram calculated using DETX and DETY for each event in the final _common_clean file
| Quadrant A | 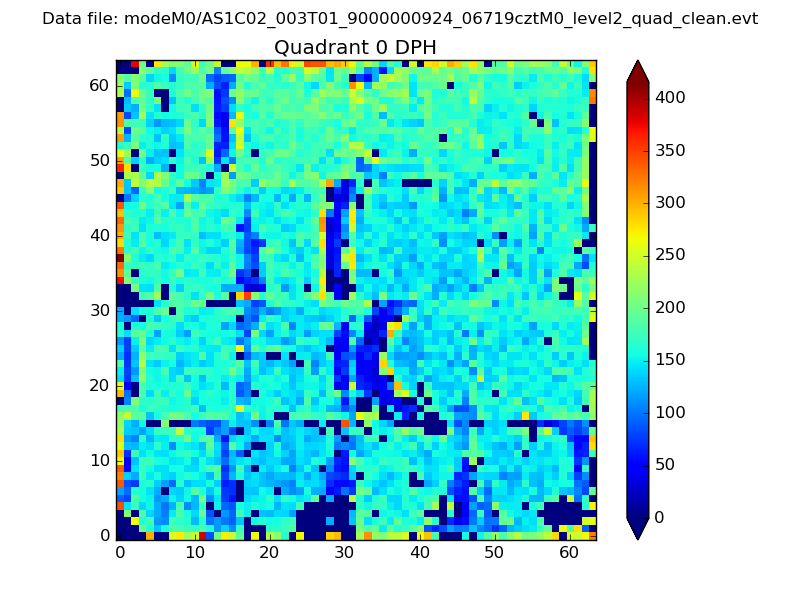 |
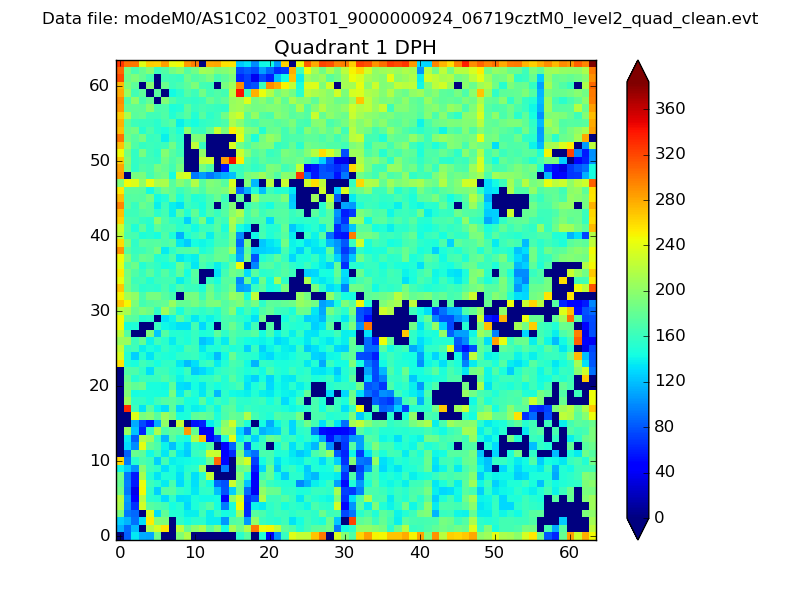 |
Quadrant B |
|---|---|---|---|
| Quadrant D | 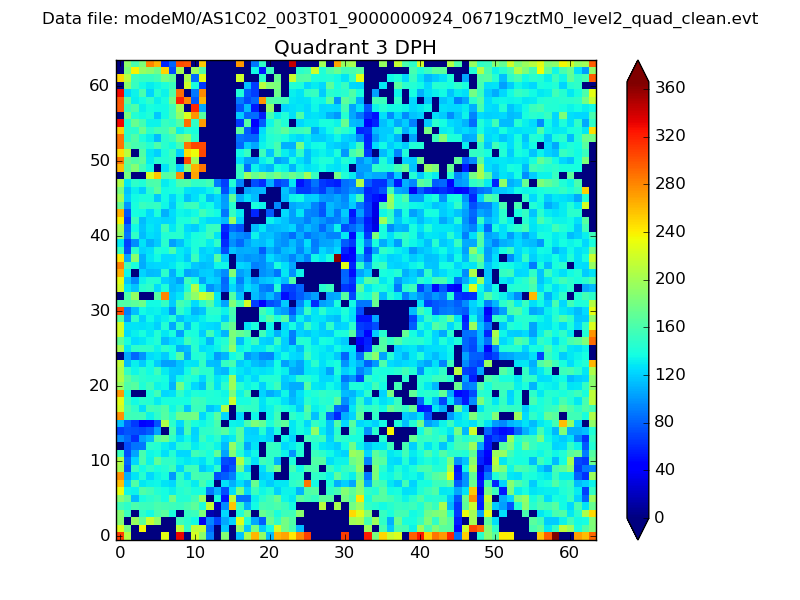 |
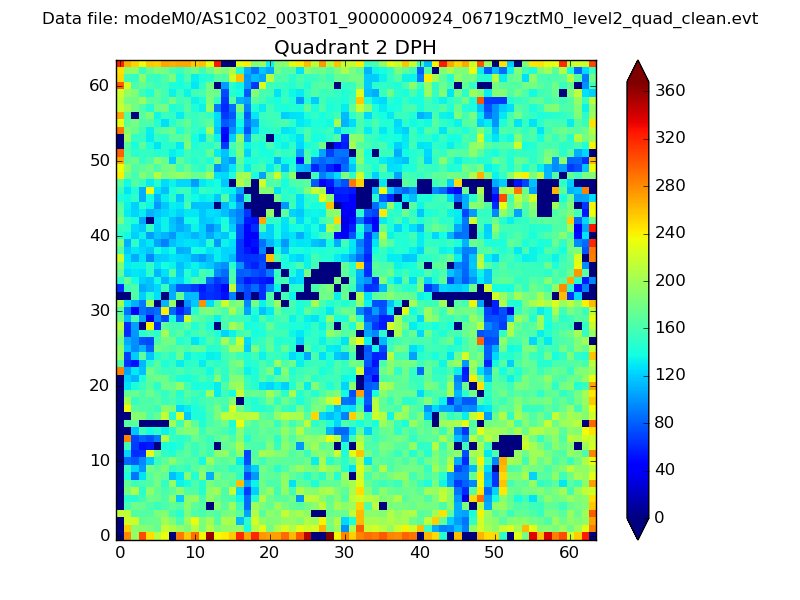 |
Quadrant C |
| Plot type | Count rate plots | Images |
|---|---|---|
| Comparison with Poisson distribution Blue bars denote a histogram of data divided into 1 sec bins. Red curve is a Poisson curve with rate = median count rate of data. |
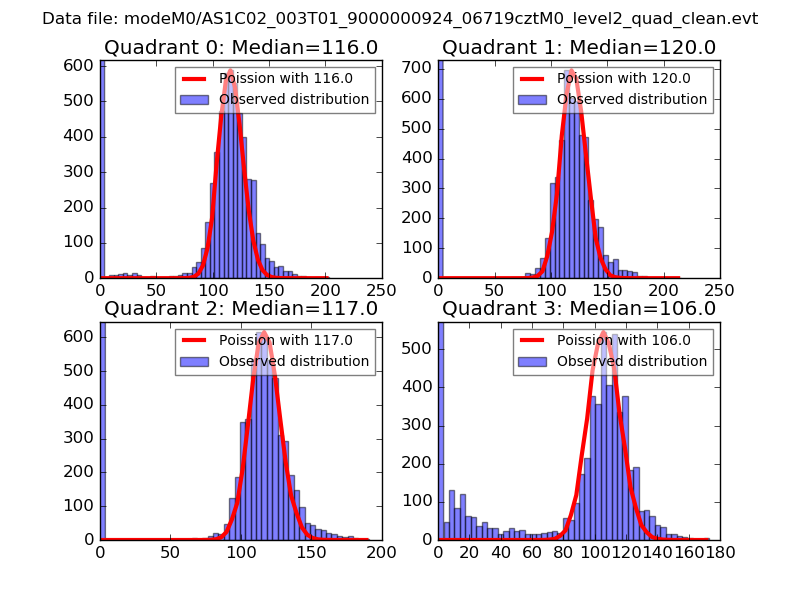 |
 |
| Quadrant-wise count rates Data is divided into 100 sec bins |
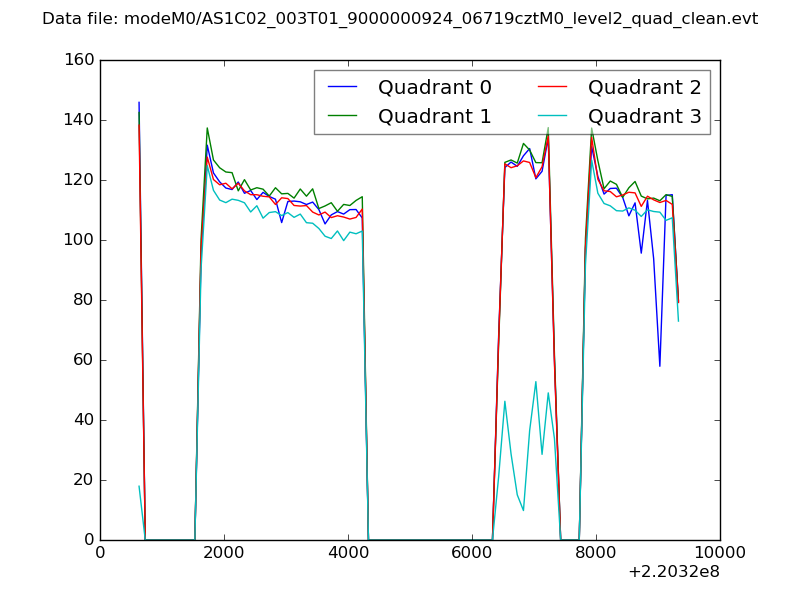 |
|
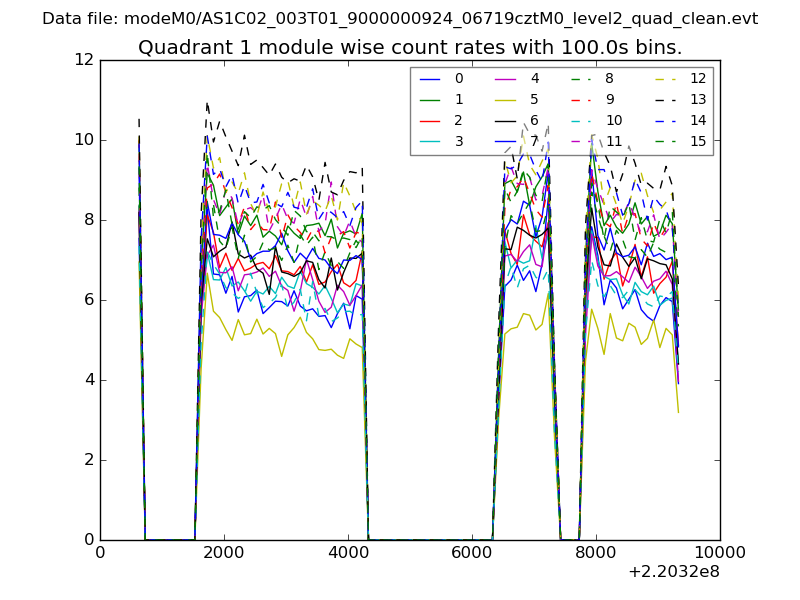
| Module-wise count rates for Quadrant A Data is divided into 100 sec bins |
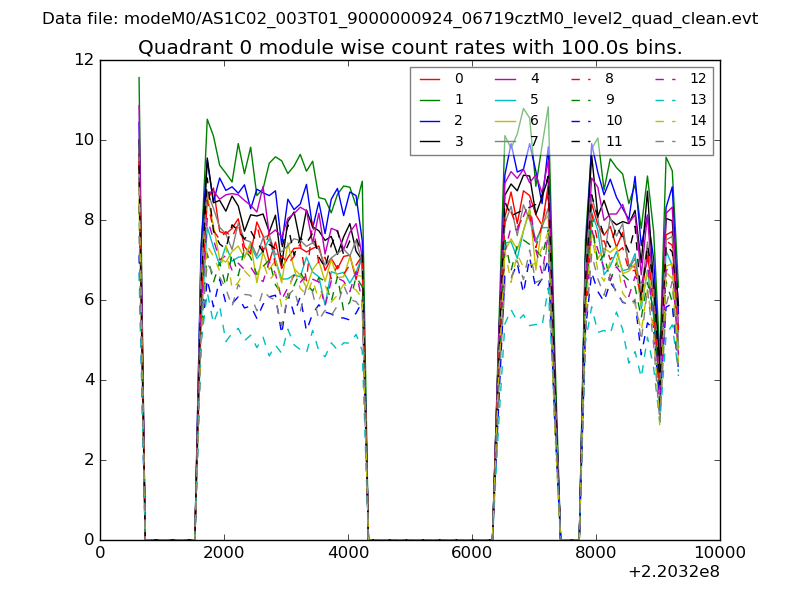 |
 |
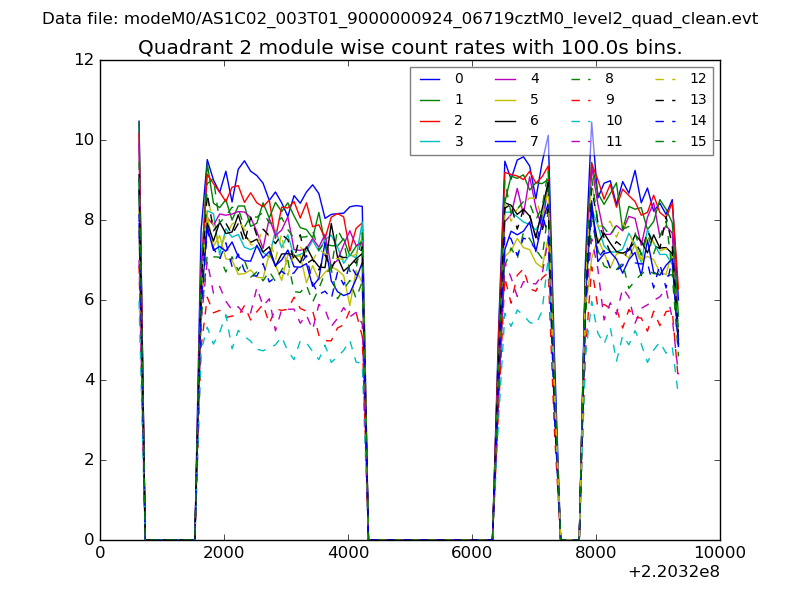
| Module-wise count rates for Quadrant B Data is divided into 100 sec bins |
 |
 |
| Module-wise count rates for Quadrant C Data is divided into 100 sec bins |
 |
 |
| Module-wise count rates for Quadrant D Data is divided into 100 sec bins |
 |
 |
| Parameter | Plot |
|---|---|
| CZT HV Monitor | 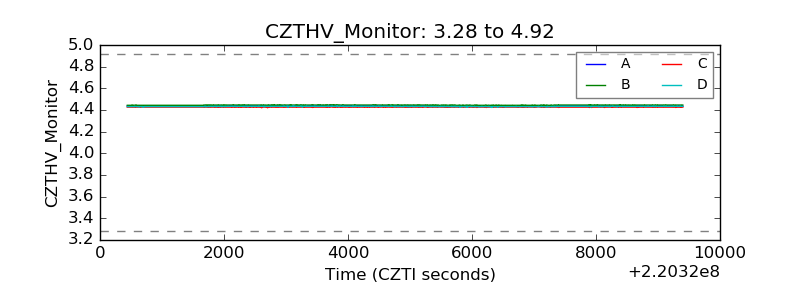 |
| D_VDD | 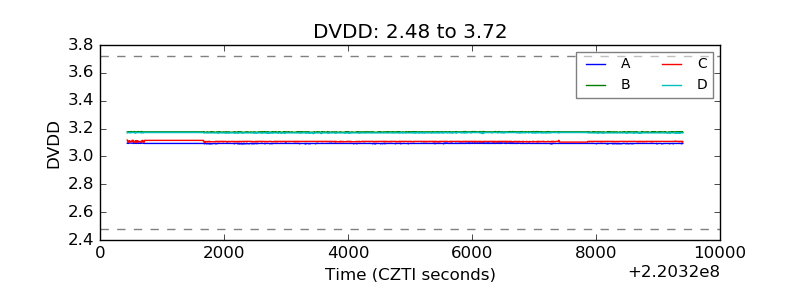 |
| Temperature 1 | 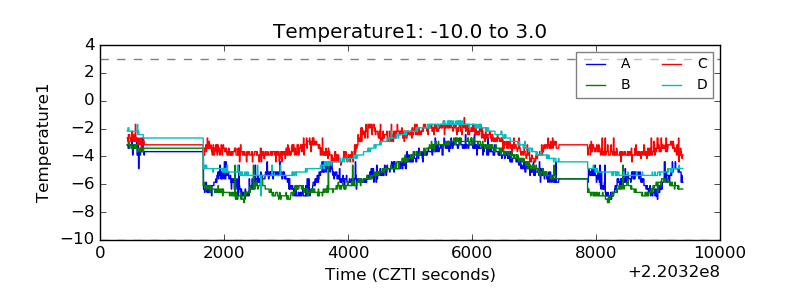 |
| Veto HV Monitor | 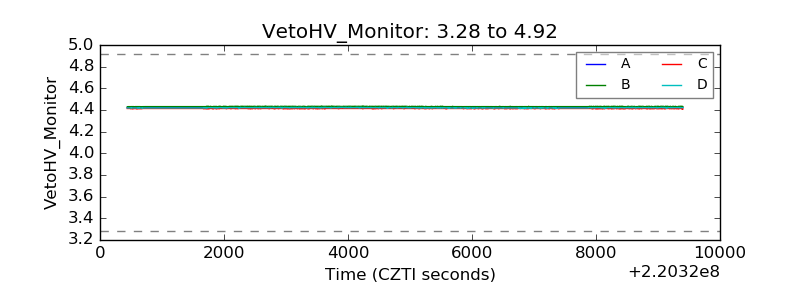 |
| Veto LLD | 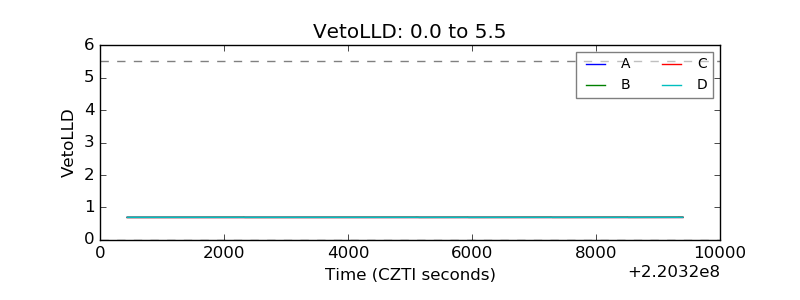 |
| Alpha Counter | 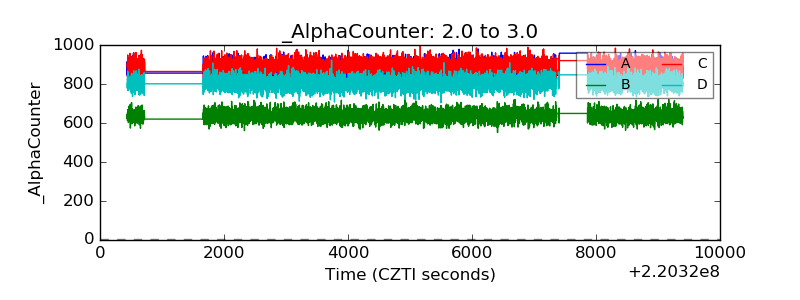 |
| _CPM_Rate | 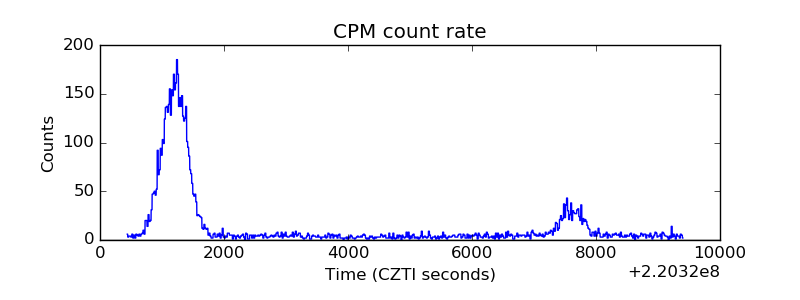 |
| CZT Counter |  |
| +2.5 Volts monitor | 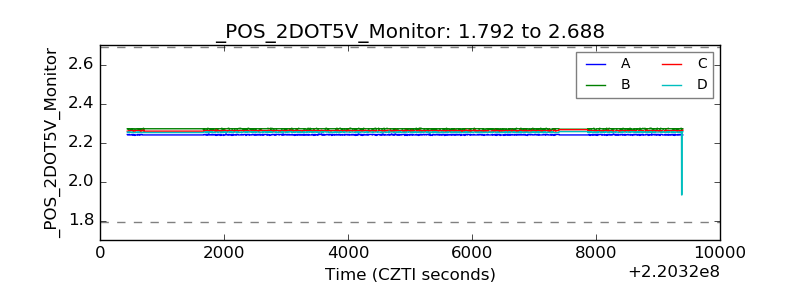 |
| +5 Volts monitor |  |
| _ROLL_ROT | 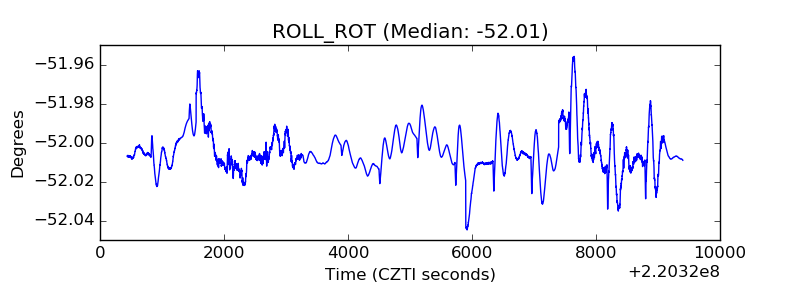 |
| _Roll_DEC | 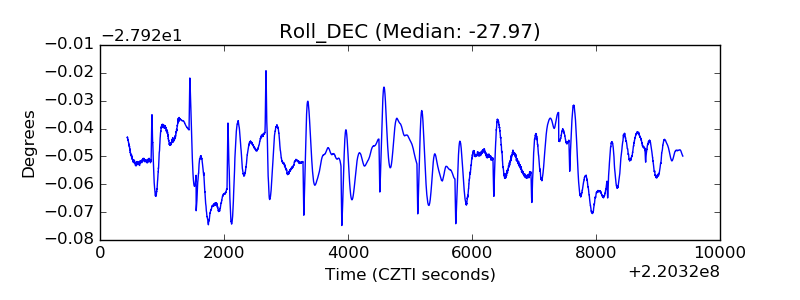 |
| _Roll_RA | 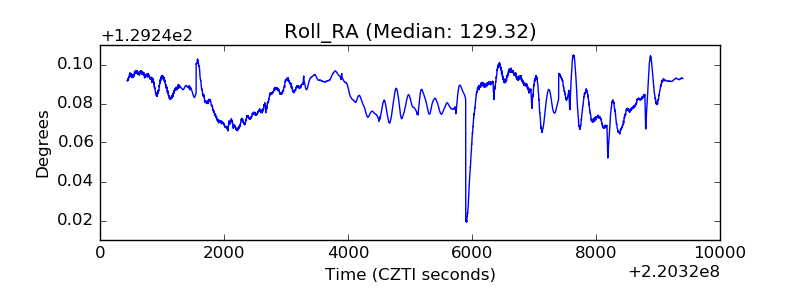 |
| Veto Counter |  |