| Param | Original file | Final file |
|---|---|---|
| Filename | modeM0/AS1C02_003T01_9000000924_06720cztM0_level2.evt | modeM0/AS1C02_003T01_9000000924_06720cztM0_level2_quad_clean.evt |
| Size (bytes) | 590,071,680 | 106,453,440 |
| Size | 562.7 MB | 101.5 MB |
| Events in quadrant A | 4,266,744 | 673,038 |
| Events in quadrant B | 3,643,131 | 698,174 |
| Events in quadrant C | 3,791,899 | 679,060 |
| Events in quadrant D | 5,629,323 | 620,843 |
| Mode M9 | |||
|---|---|---|---|
| Quadrant | BADHDUFLAG | Total packets | Discarded packets |
| A | 0 | 5 | 0 |
| B | 0 | 5 | 0 |
| C | 0 | 5 | 0 |
| D | 0 | 5 | 0 |
| Mode SS | |||
|---|---|---|---|
| Quadrant | BADHDUFLAG | Total packets | Discarded packets |
| A | 0 | 166 | 0 |
| B | 0 | 166 | 0 |
| C | 0 | 166 | 0 |
| D | 0 | 166 | 0 |
| Mode M0 | |||
|---|---|---|---|
| Quadrant | BADHDUFLAG | Total packets | Discarded packets |
| A | 0 | 18170 | 4 |
| B | 0 | 16497 | 3 |
| C | 0 | 17112 | 3 |
| D | 0 | 22146 | 7 |
| Quadrant | Total seconds | Saturated seconds | Saturation percentage |
|---|---|---|---|
| A | 7935 | 308 | 3.881537% |
| B | 7935 | 181 | 2.281033% |
| C | 7935 | 234 | 2.948960% |
| D | 7934 | 523 | 6.591883% |
Noise dominated data is calculated using 1-second bins in cleaned event files. If a bin has >2000 counts, and if more than 50% of those come from <1% of pixels, then it is considered to be noise-dominated and hence unusable.
| Quadrant | # 1 sec bins | Bins with >0 counts | Bins with >2000 counts | High rate bins dominated by noise | Noise dominated (total time) | Noise dominated (detector-on time) | Marked lightcurve |
|---|---|---|---|---|---|---|---|
| A | 8542 | 7939 | 155 | 155 | 1.81% | 1.95% | 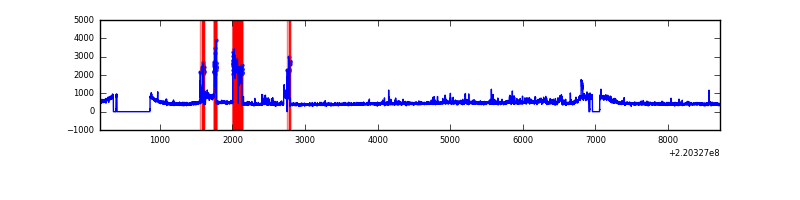 |
| B | 8542 | 7939 | 0 | 0 | 0.00% | 0.00% | 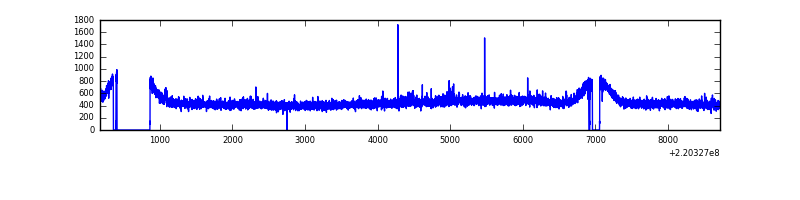 |
| C | 8542 | 7940 | 74 | 74 | 0.87% | 0.93% | 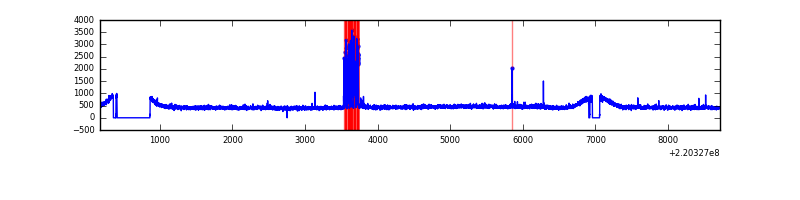 |
| D | 8541 | 7939 | 300 | 300 | 3.51% | 3.78% | 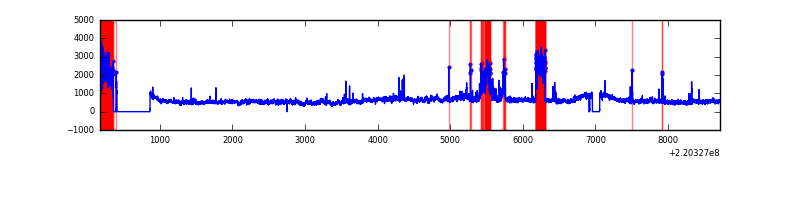 |
Top three noisy pixels from each quadrant. If the there are fewer than three noisy pixels in the level2.evt file, extra rows are filled as -1
| Pixel properties | Quadrant properties | ||||||
|---|---|---|---|---|---|---|---|
| Quadrant | DetID | PixID | Counts | Sigma | Mean | Median | Sigma |
| A | 14 | 111 | 624014 | 3340.8 | 911 | 891 | 186.5 |
| A | 8 | 15 | 83953 | 445.33 | 911 | 891 | 186.5 |
| A | 15 | 234 | 48731 | 256.49 | 911 | 891 | 186.5 |
| B | 12 | 111 | 19040 | 101.0 | 933 | 906 | 179.5 |
| B | 11 | 111 | 14901 | 77.95 | 933 | 906 | 179.5 |
| B | 10 | 252 | 10839 | 55.32 | 933 | 906 | 179.5 |
| C | 12 | 4 | 242256 | 1135.45 | 905 | 908 | 212.6 |
| C | 9 | 247 | 10531 | 45.27 | 905 | 908 | 212.6 |
| C | 13 | 61 | 7149 | 29.36 | 905 | 908 | 212.6 |
| D | 8 | 195 | 1262569 | 5961.73 | 869 | 839 | 211.6 |
| D | 2 | 33 | 996294 | 4703.57 | 869 | 839 | 211.6 |
| D | 2 | 152 | 39405 | 182.23 | 869 | 839 | 211.6 |
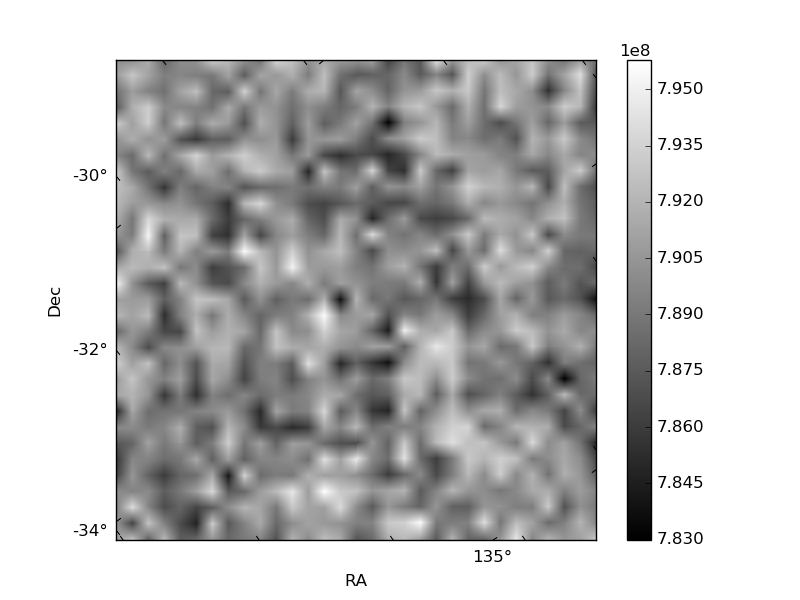
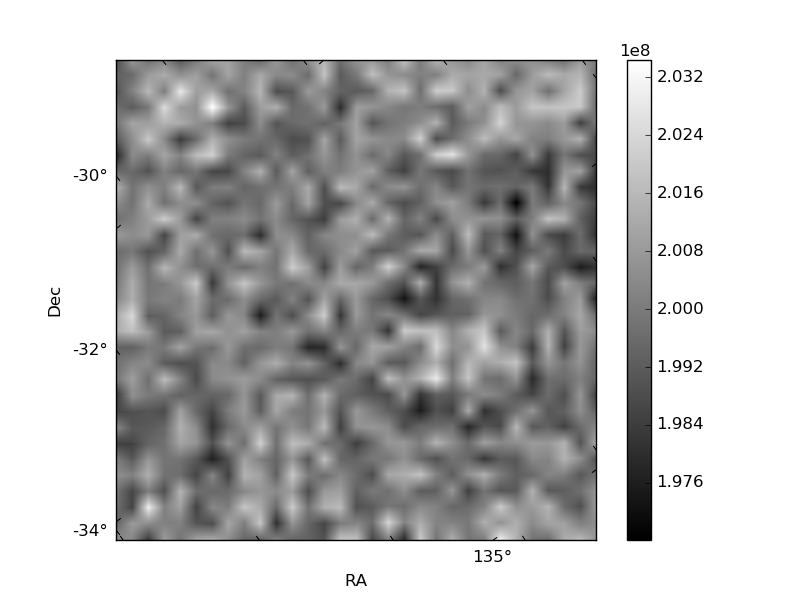
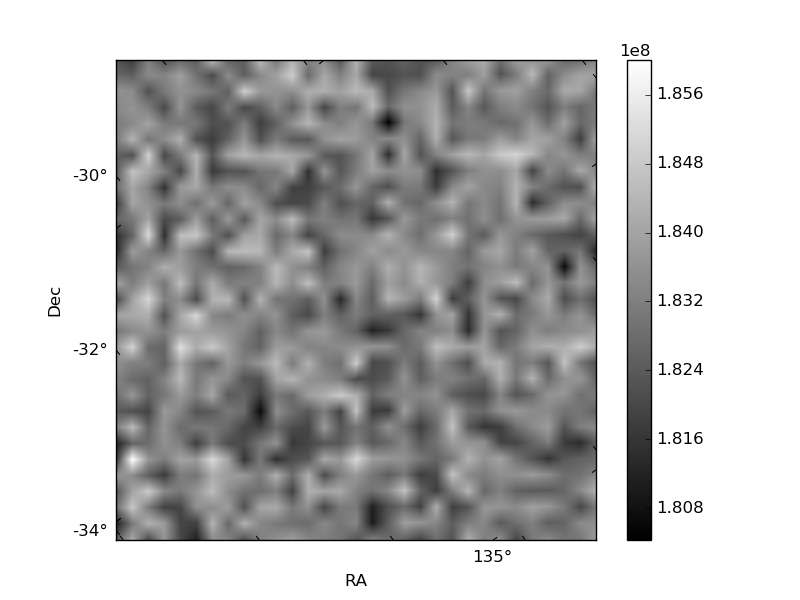
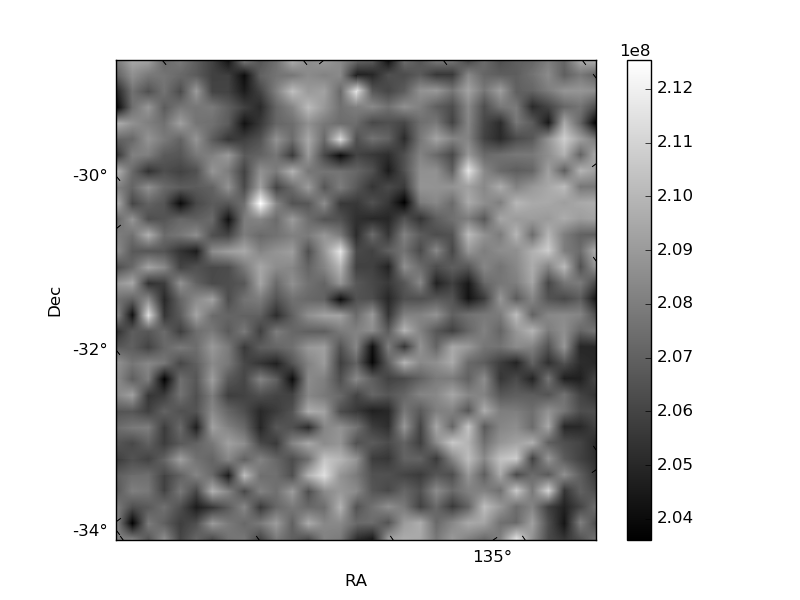
Histogram calculated using DETX and DETY for each event in the final _common_clean file
| Quadrant A | 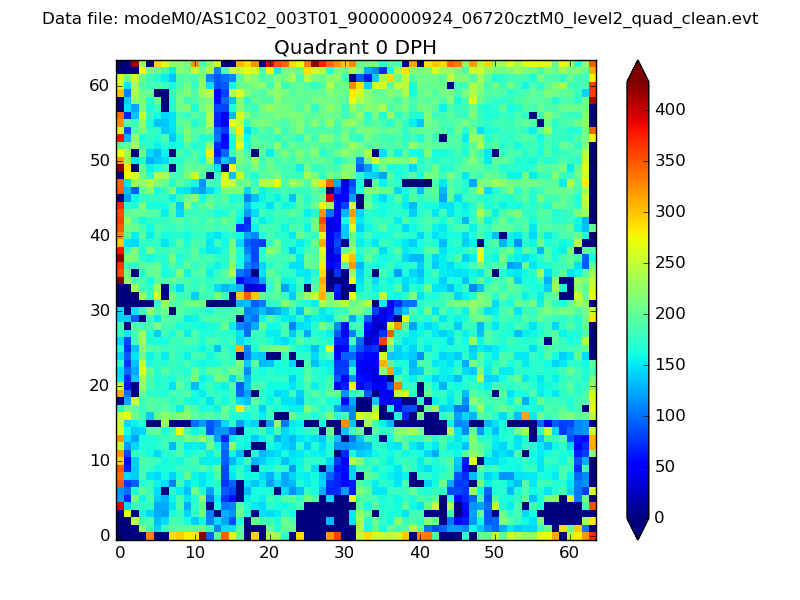 |
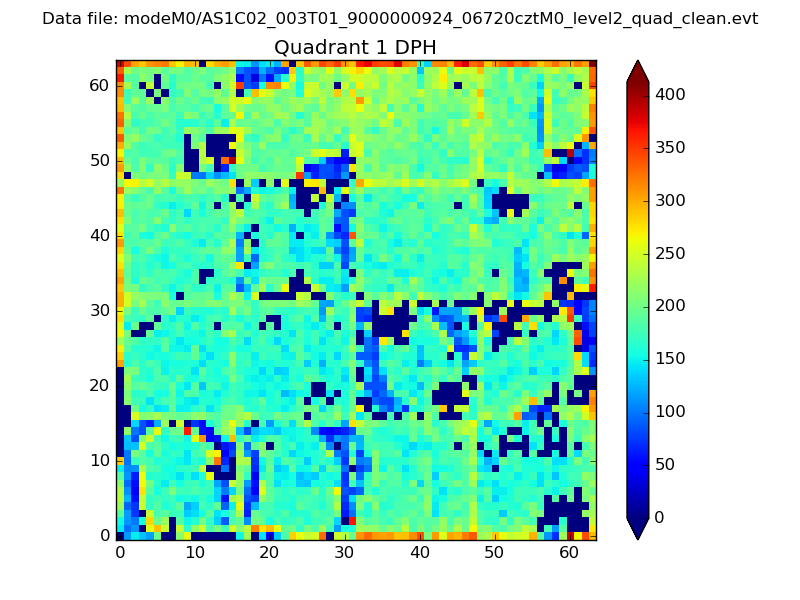 |
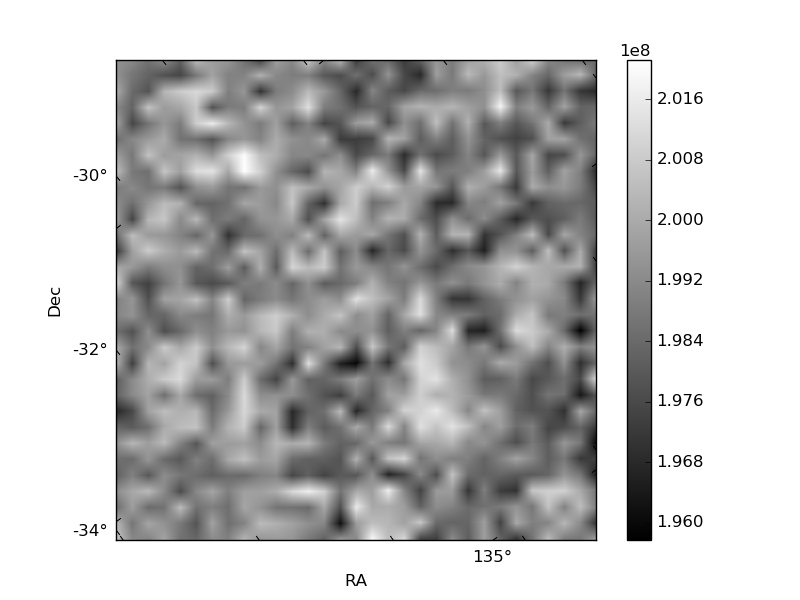
Quadrant B |
|---|---|---|---|
| Quadrant D | 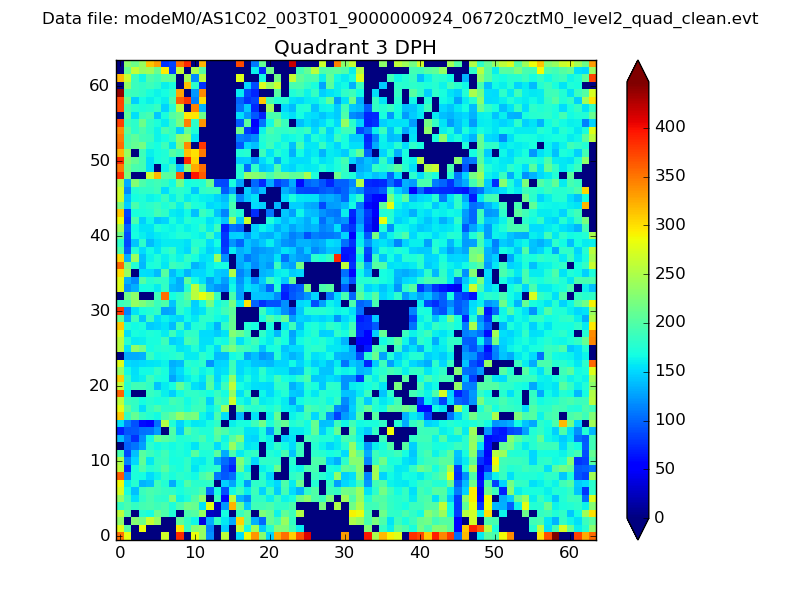 |
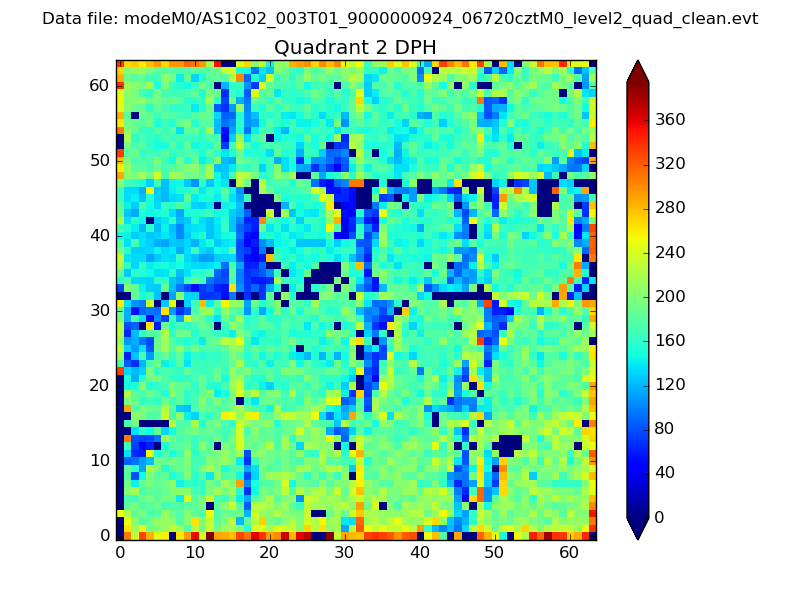 |
Quadrant C |
| Plot type | Count rate plots | Images |
|---|---|---|
| Comparison with Poisson distribution Blue bars denote a histogram of data divided into 1 sec bins. Red curve is a Poisson curve with rate = median count rate of data. |
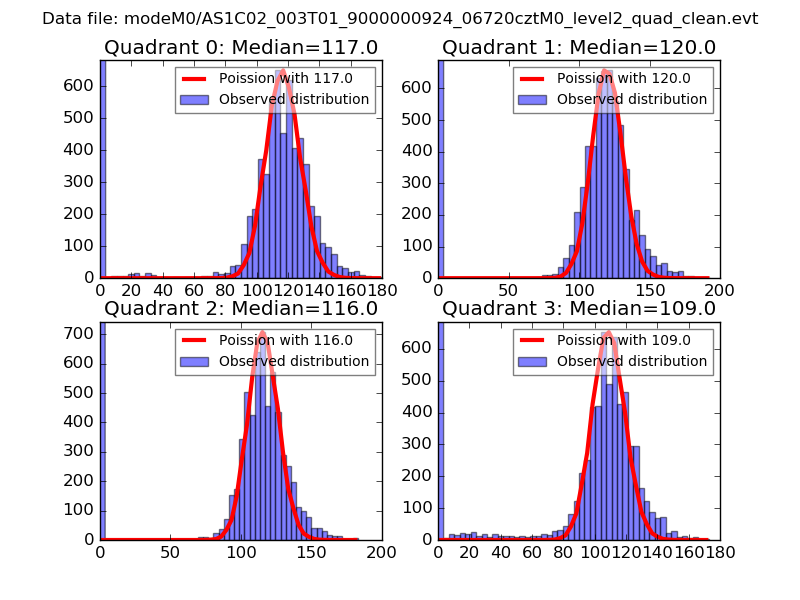 |
 |
| Quadrant-wise count rates Data is divided into 100 sec bins |
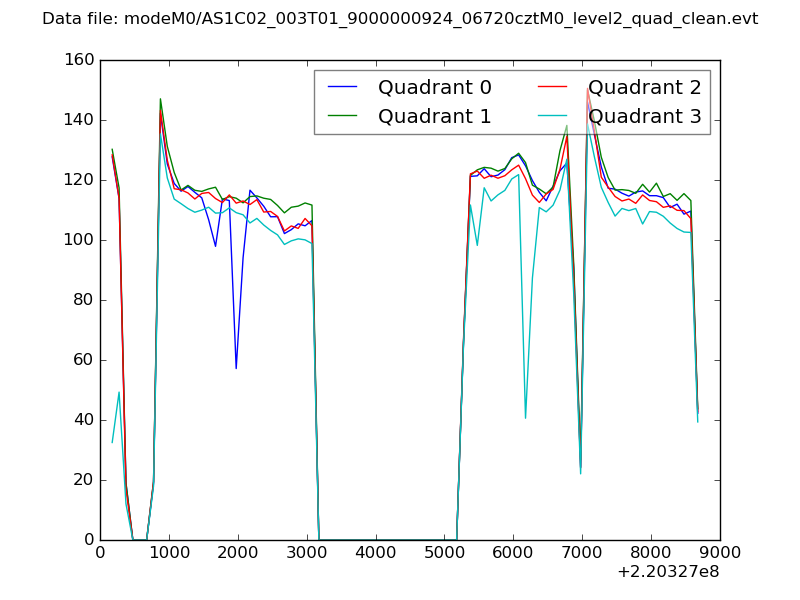 |
|
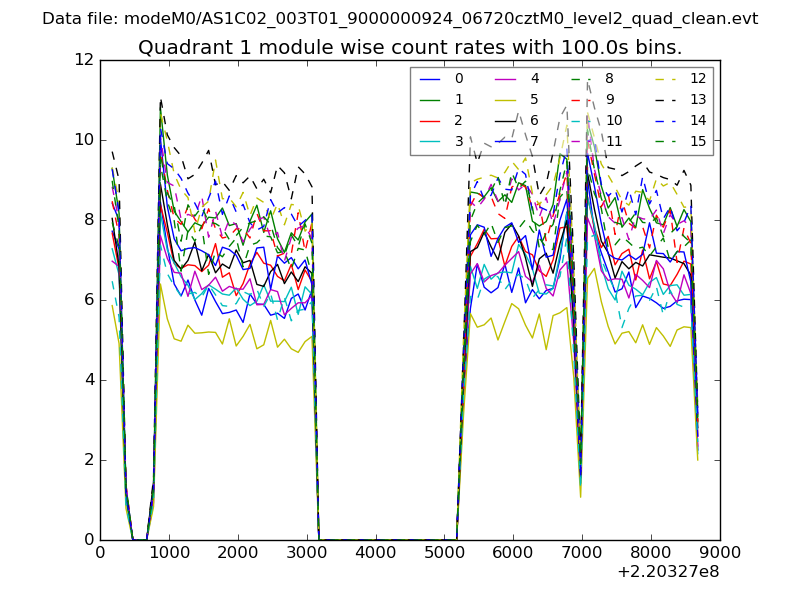
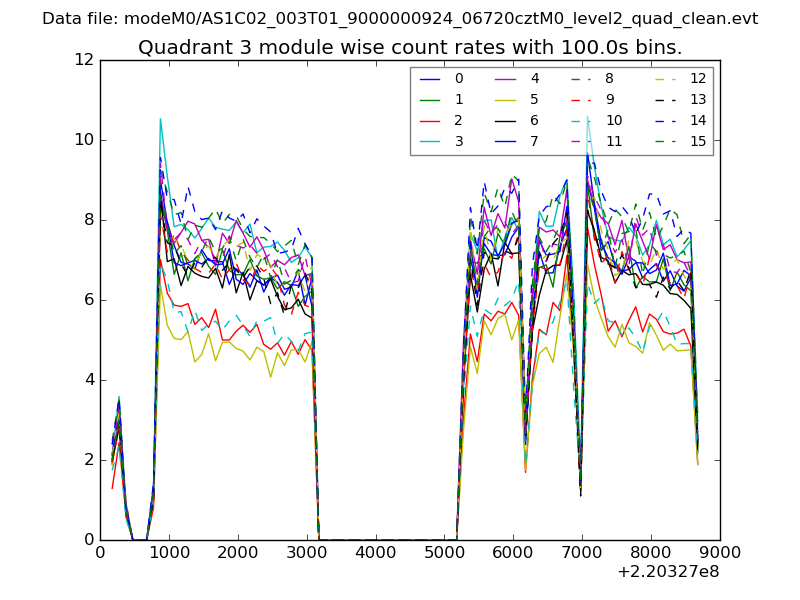
| Module-wise count rates for Quadrant A Data is divided into 100 sec bins |
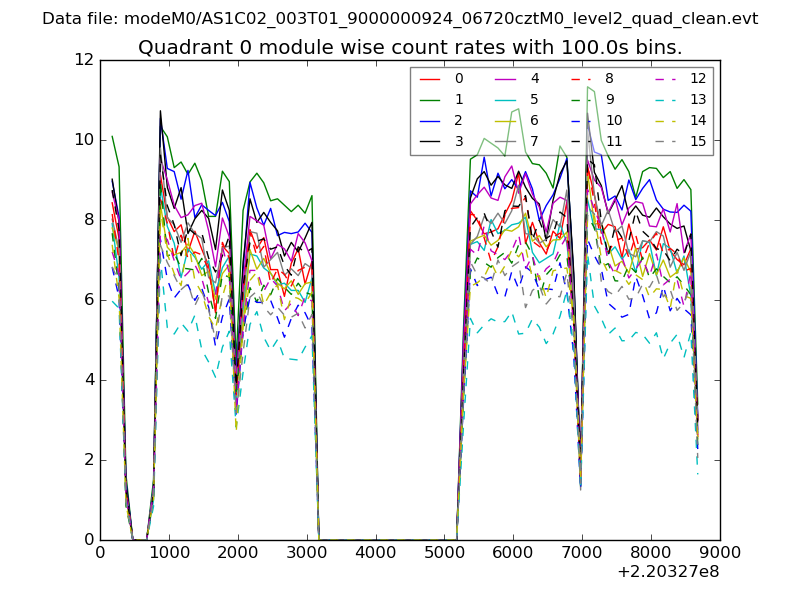 |
 |
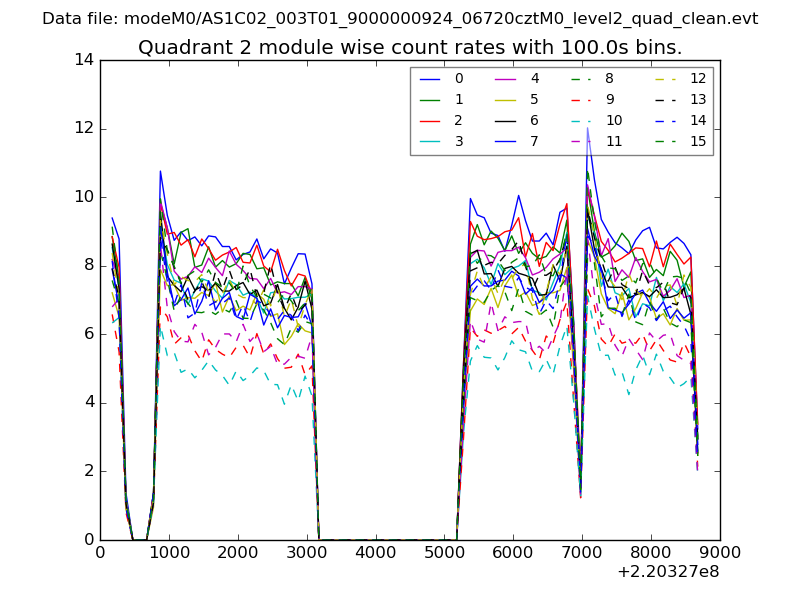
| Module-wise count rates for Quadrant B Data is divided into 100 sec bins |
 |
 |
| Module-wise count rates for Quadrant C Data is divided into 100 sec bins |
 |
 |
| Module-wise count rates for Quadrant D Data is divided into 100 sec bins |
 |
 |
| Parameter | Plot |
|---|---|
| CZT HV Monitor | 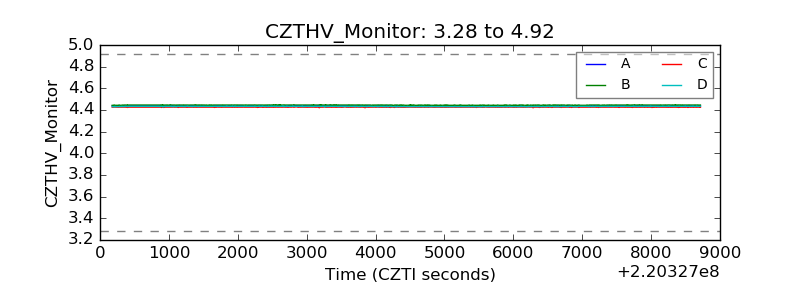 |
| D_VDD | 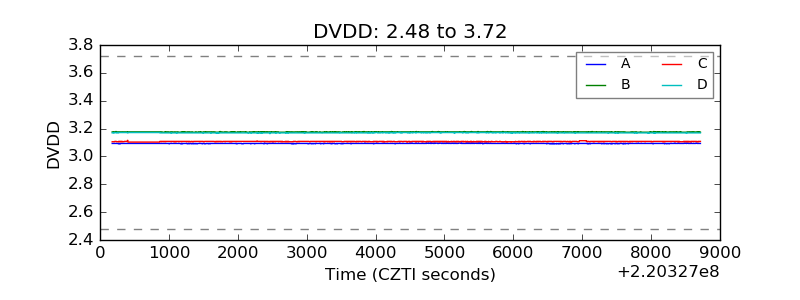 |
| Temperature 1 | 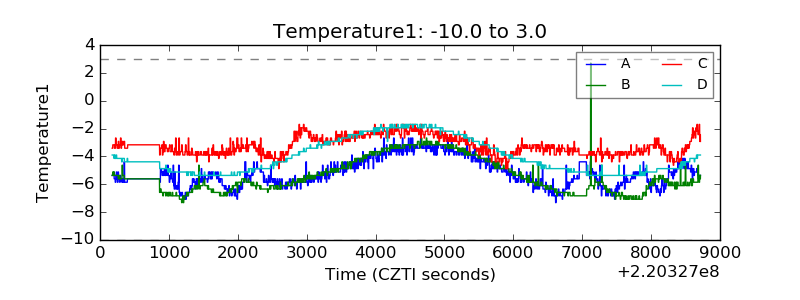 |
| Veto HV Monitor | 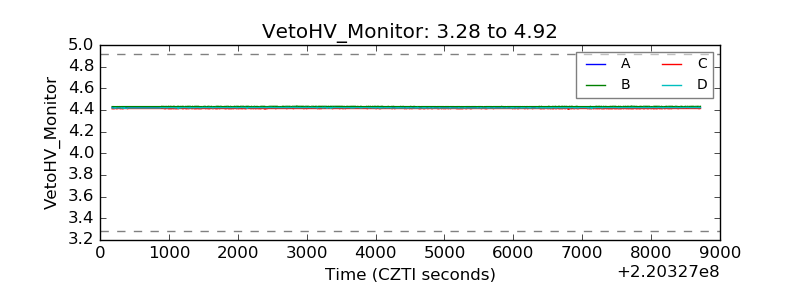 |
| Veto LLD | 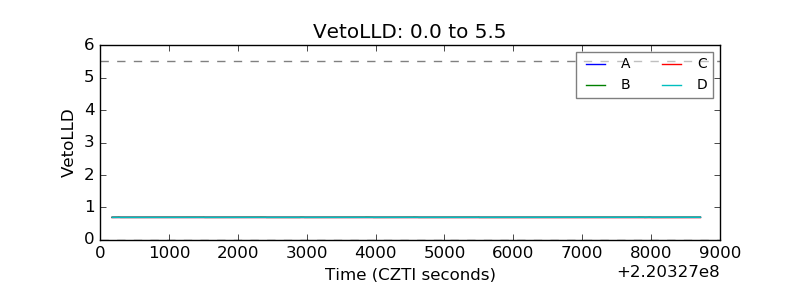 |
| Alpha Counter | 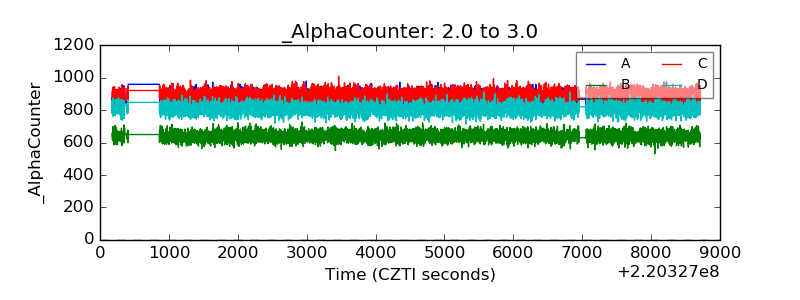 |
| _CPM_Rate | 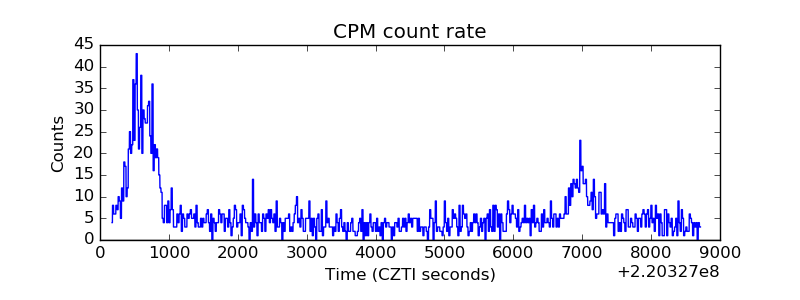 |
| CZT Counter |  |
| +2.5 Volts monitor | 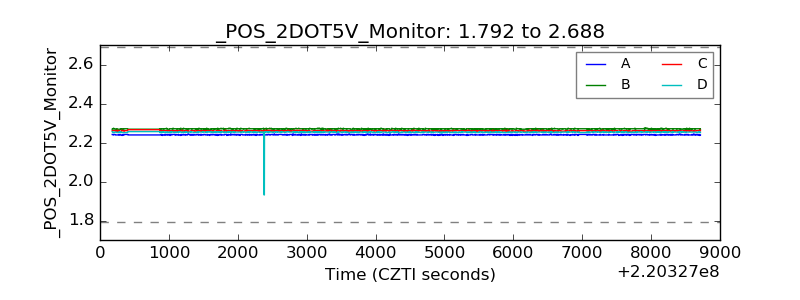 |
| +5 Volts monitor |  |
| _ROLL_ROT |  |
| _Roll_DEC | 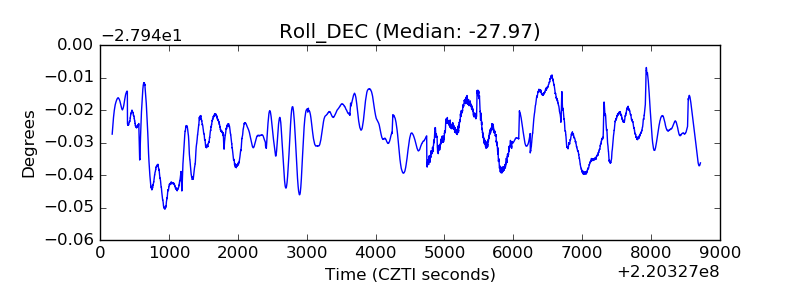 |
| _Roll_RA | 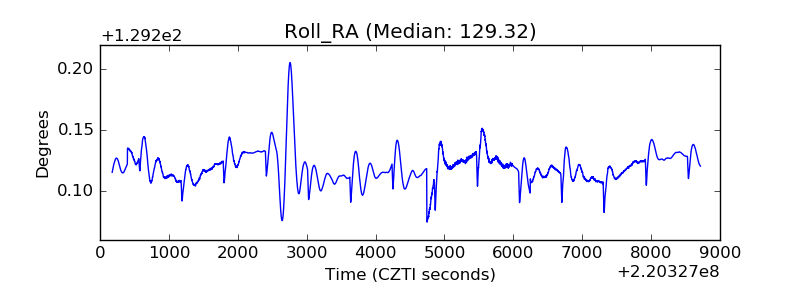 |
| Veto Counter |  |