| Param | Original file | Final file |
|---|---|---|
| Filename | modeM0/AS1C02_003T01_9000000924_06721cztM0_level2.evt | modeM0/AS1C02_003T01_9000000924_06721cztM0_level2_quad_clean.evt |
| Size (bytes) | 521,818,560 | 101,482,560 |
| Size | 497.6 MB | 96.8 MB |
| Events in quadrant A | 3,808,289 | 640,441 |
| Events in quadrant B | 3,576,160 | 650,431 |
| Events in quadrant C | 3,489,157 | 632,375 |
| Events in quadrant D | 4,401,633 | 609,254 |
| Mode M9 | |||
|---|---|---|---|
| Quadrant | BADHDUFLAG | Total packets | Discarded packets |
| A | 0 | 2 | 0 |
| B | 0 | 2 | 0 |
| C | 0 | 2 | 0 |
| D | 0 | 2 | 0 |
| Mode SS | |||
|---|---|---|---|
| Quadrant | BADHDUFLAG | Total packets | Discarded packets |
| A | 0 | 158 | 0 |
| B | 0 | 158 | 0 |
| C | 0 | 158 | 0 |
| D | 0 | 158 | 0 |
| Mode M0 | |||
|---|---|---|---|
| Quadrant | BADHDUFLAG | Total packets | Discarded packets |
| A | 0 | 16681 | 2 |
| B | 0 | 16096 | 1 |
| C | 0 | 16040 | 1 |
| D | 0 | 18126 | 1 |
| Quadrant | Total seconds | Saturated seconds | Saturation percentage |
|---|---|---|---|
| A | 7778 | 256 | 3.291335% |
| B | 7778 | 246 | 3.162767% |
| C | 7778 | 222 | 2.854204% |
| D | 7778 | 245 | 3.149910% |
Noise dominated data is calculated using 1-second bins in cleaned event files. If a bin has >2000 counts, and if more than 50% of those come from <1% of pixels, then it is considered to be noise-dominated and hence unusable.
| Quadrant | # 1 sec bins | Bins with >0 counts | Bins with >2000 counts | High rate bins dominated by noise | Noise dominated (total time) | Noise dominated (detector-on time) | Marked lightcurve |
|---|---|---|---|---|---|---|---|
| A | 7888 | 7781 | 0 | 0 | 0.00% | 0.00% | 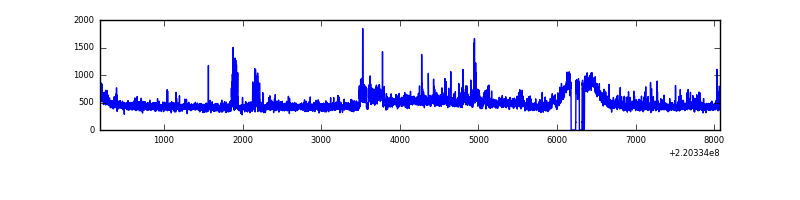 |
| B | 7888 | 7781 | 0 | 0 | 0.00% | 0.00% | 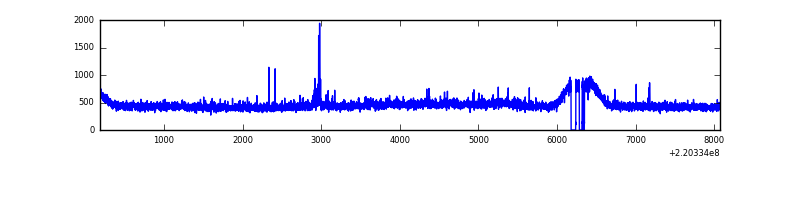 |
| C | 7888 | 7781 | 0 | 0 | 0.00% | 0.00% | 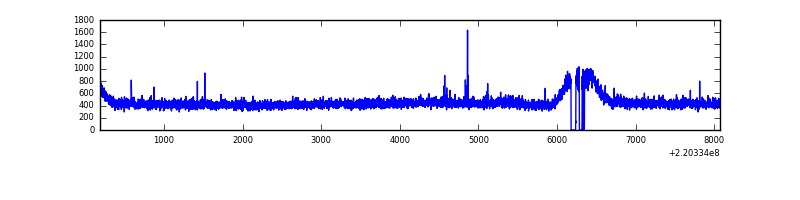 |
| D | 7888 | 7781 | 23 | 23 | 0.29% | 0.30% | 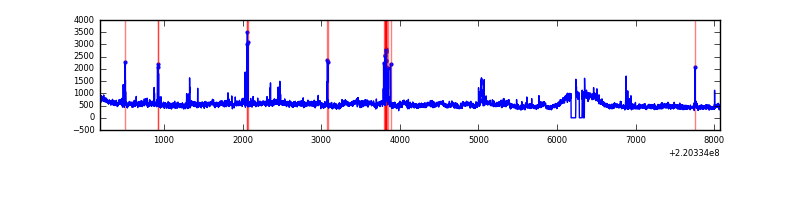 |
Top three noisy pixels from each quadrant. If the there are fewer than three noisy pixels in the level2.evt file, extra rows are filled as -1
| Pixel properties | Quadrant properties | ||||||
|---|---|---|---|---|---|---|---|
| Quadrant | DetID | PixID | Counts | Sigma | Mean | Median | Sigma |
| A | 14 | 111 | 208154 | 1117.53 | 899 | 877 | 185.5 |
| A | 8 | 15 | 120415 | 644.49 | 899 | 877 | 185.5 |
| A | 13 | 251 | 10673 | 52.81 | 899 | 877 | 185.5 |
| B | 0 | 198 | 21504 | 116.84 | 908 | 883 | 176.5 |
| B | 12 | 111 | 18704 | 100.98 | 908 | 883 | 176.5 |
| B | 4 | 170 | 16399 | 87.92 | 908 | 883 | 176.5 |
| C | 9 | 247 | 14669 | 66.1 | 885 | 886 | 208.5 |
| C | 10 | 22 | 8281 | 35.46 | 885 | 886 | 208.5 |
| C | 13 | 61 | 7043 | 29.53 | 885 | 886 | 208.5 |
| D | 8 | 195 | 868664 | 4035.77 | 877 | 849 | 215.0 |
| D | 2 | 33 | 102157 | 471.13 | 877 | 849 | 215.0 |
| D | 2 | 136 | 51025 | 233.34 | 877 | 849 | 215.0 |
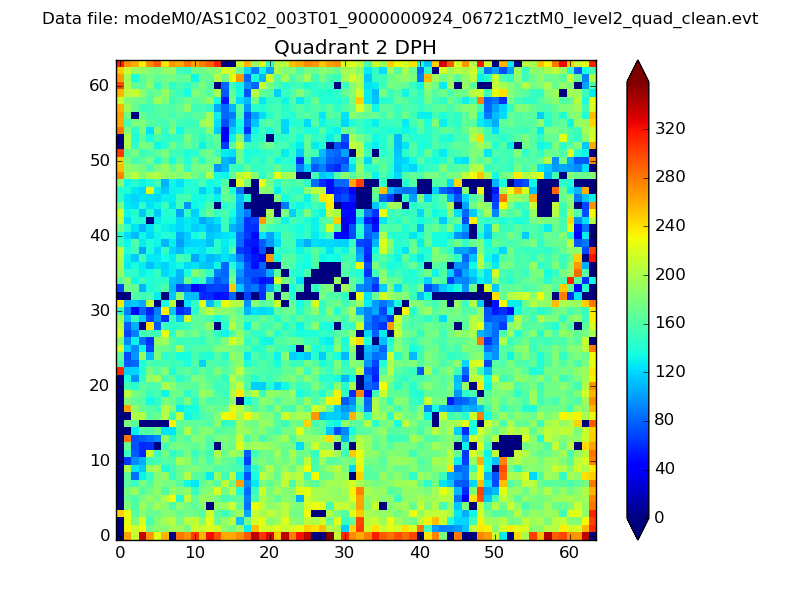
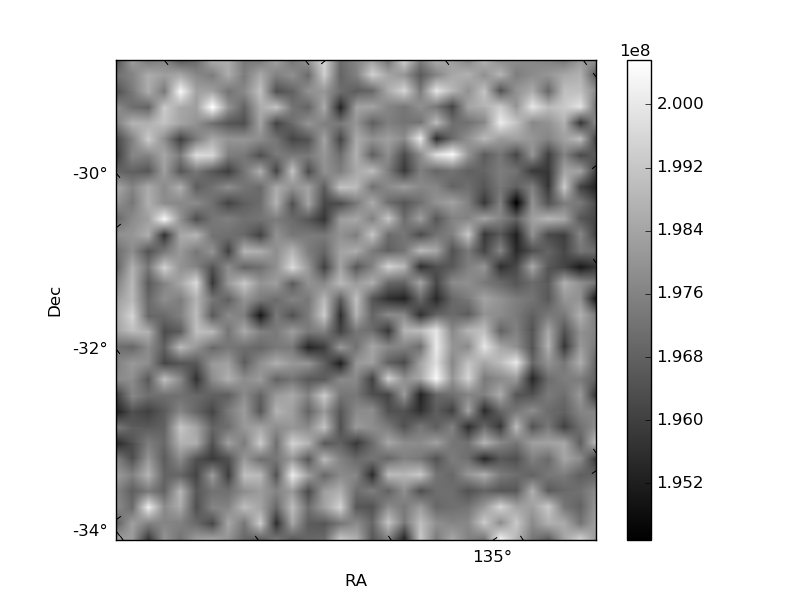
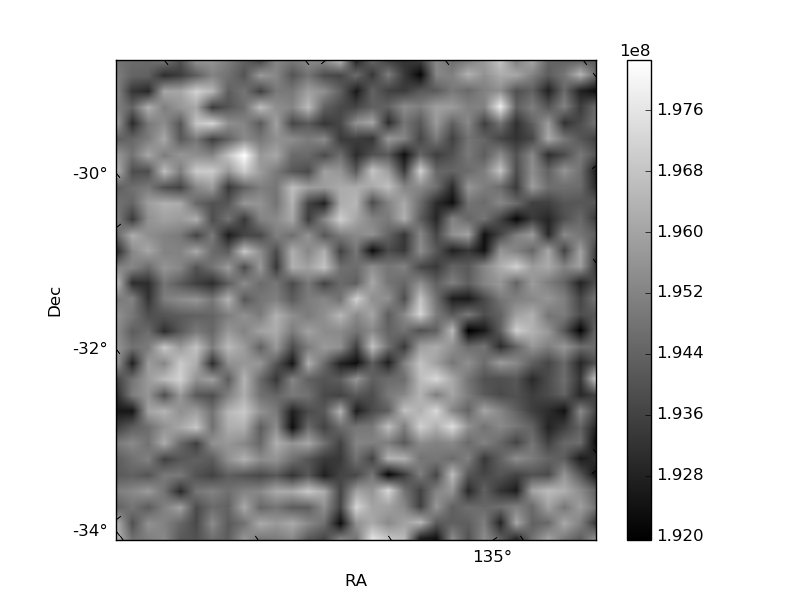
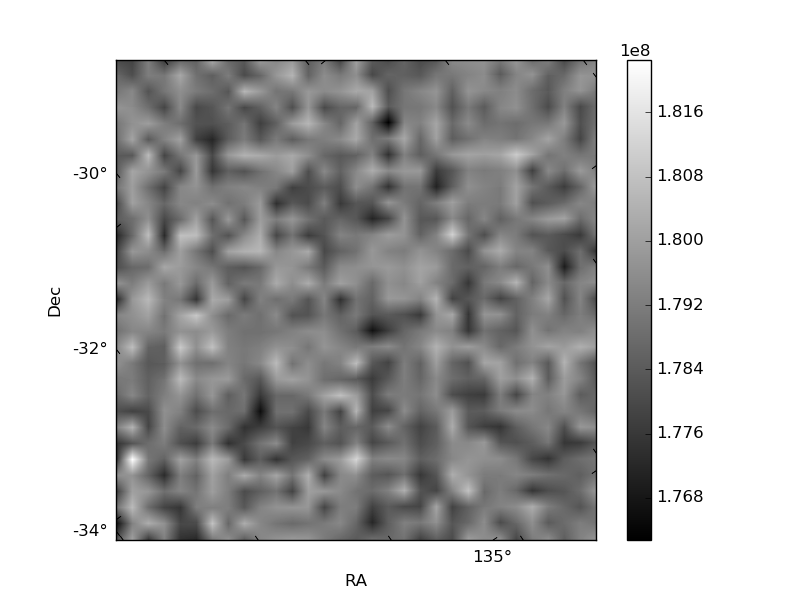
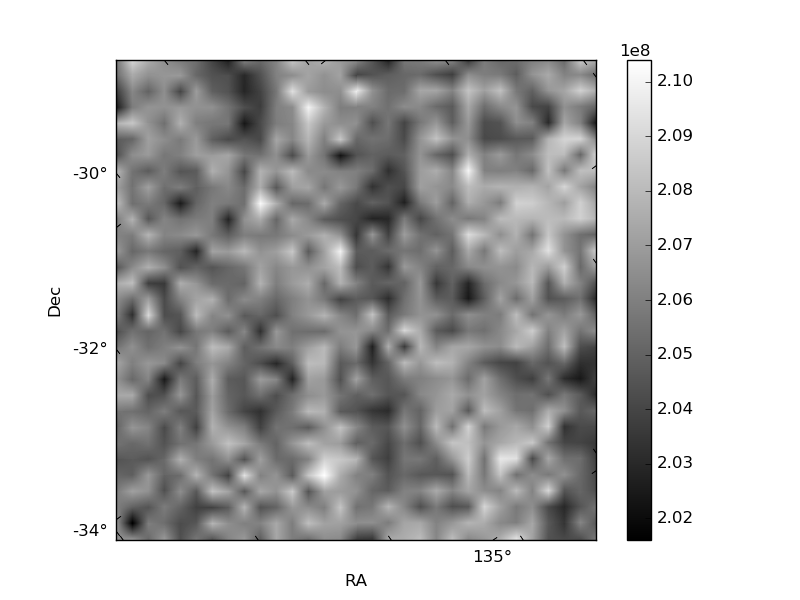
Histogram calculated using DETX and DETY for each event in the final _common_clean file
| Quadrant A | 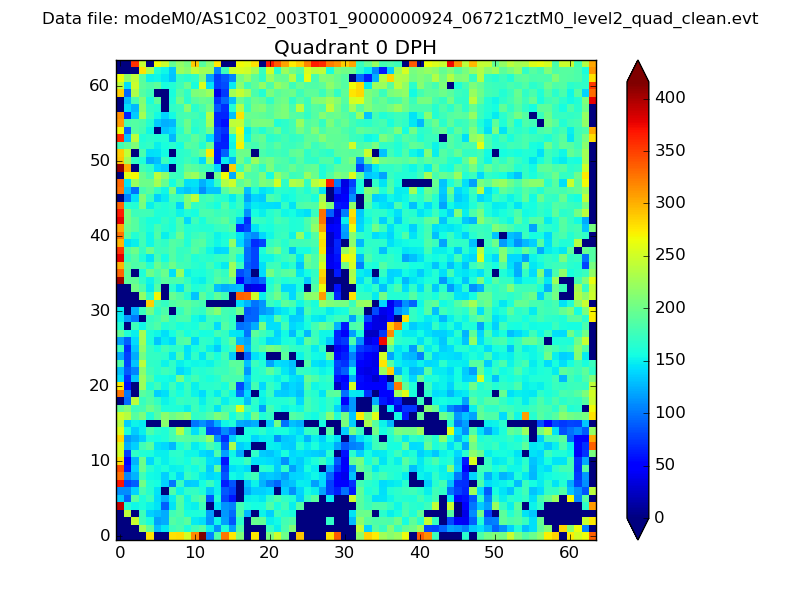 |
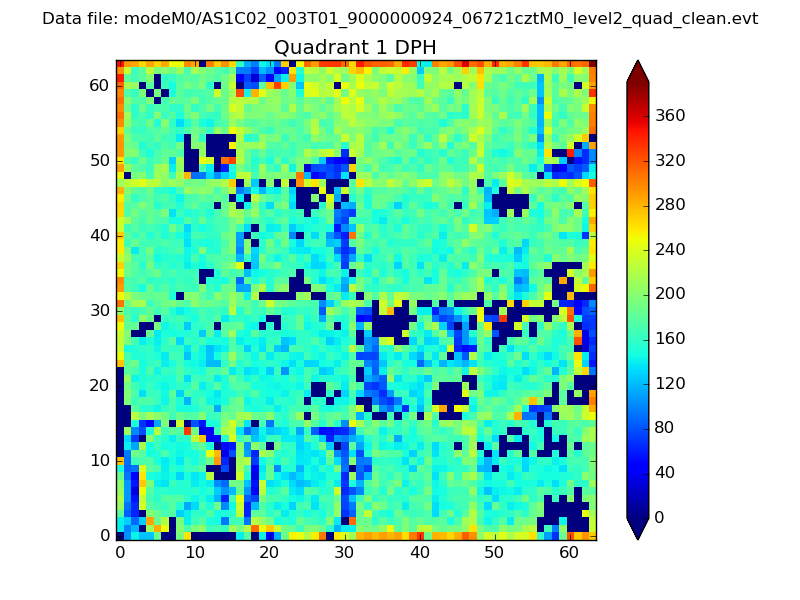 |
Quadrant B |
|---|---|---|---|
| Quadrant D | 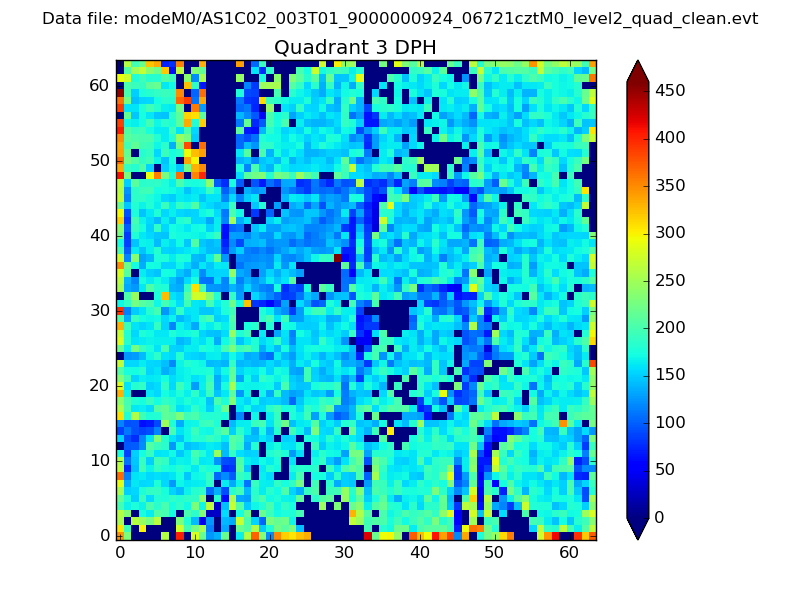 |
 |
Quadrant C |
| Plot type | Count rate plots | Images |
|---|---|---|
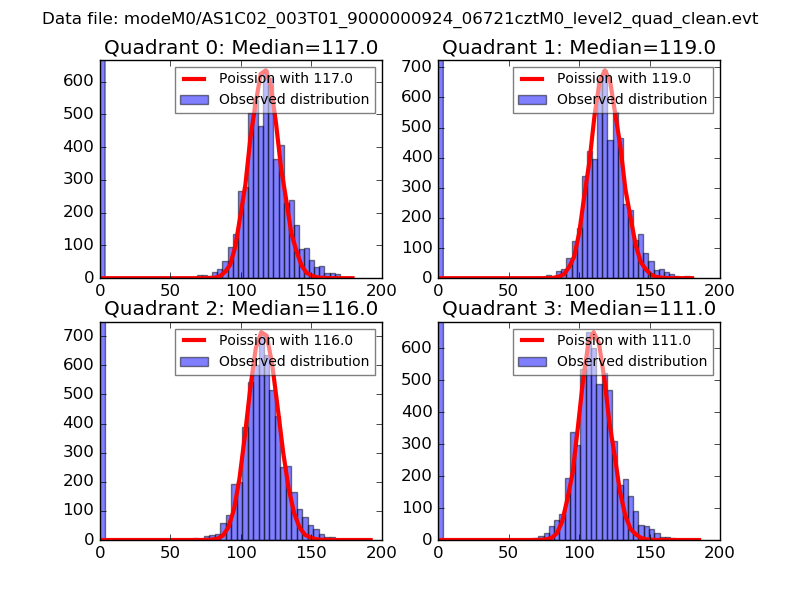
| Comparison with Poisson distribution Blue bars denote a histogram of data divided into 1 sec bins. Red curve is a Poisson curve with rate = median count rate of data. |
 |
 |
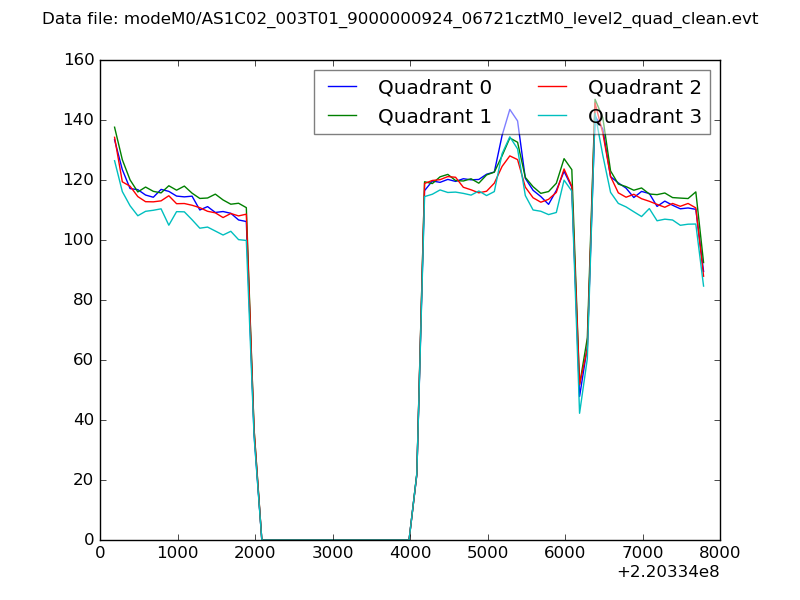
| Quadrant-wise count rates Data is divided into 100 sec bins |
 |
|
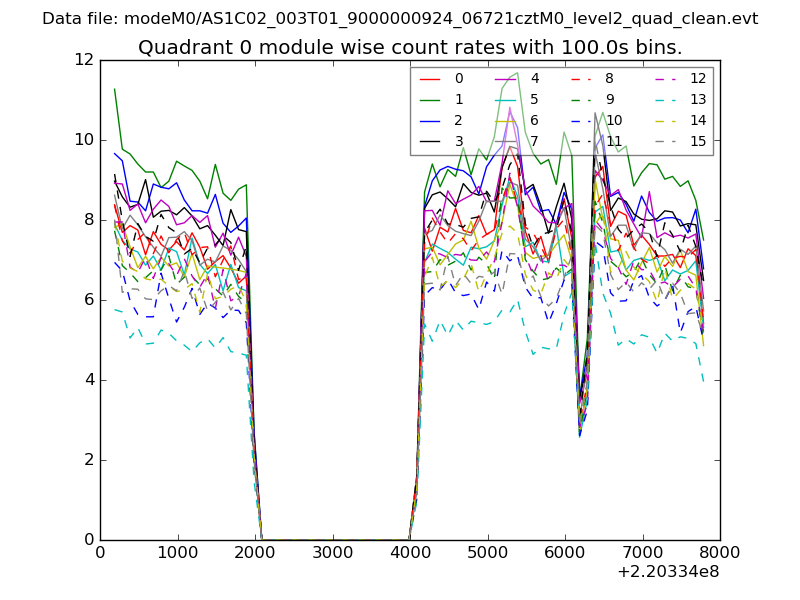
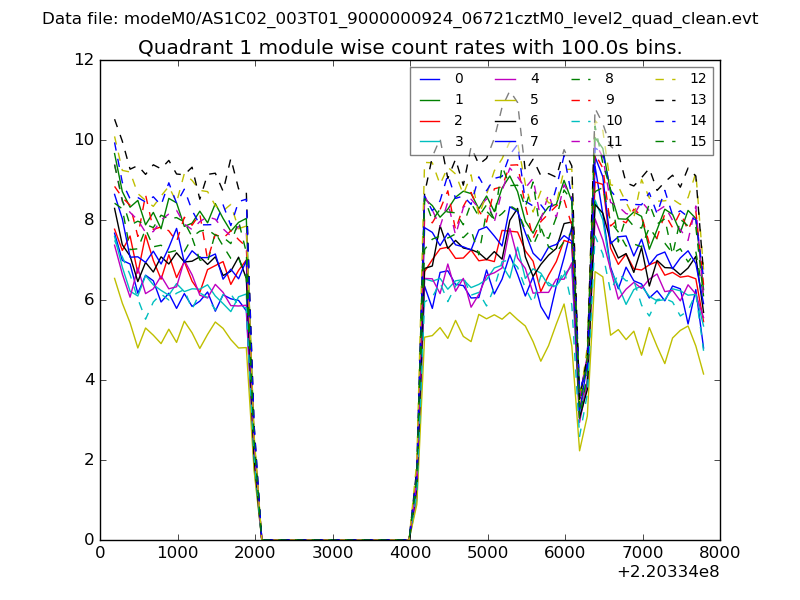
| Module-wise count rates for Quadrant A Data is divided into 100 sec bins |
 |
 |
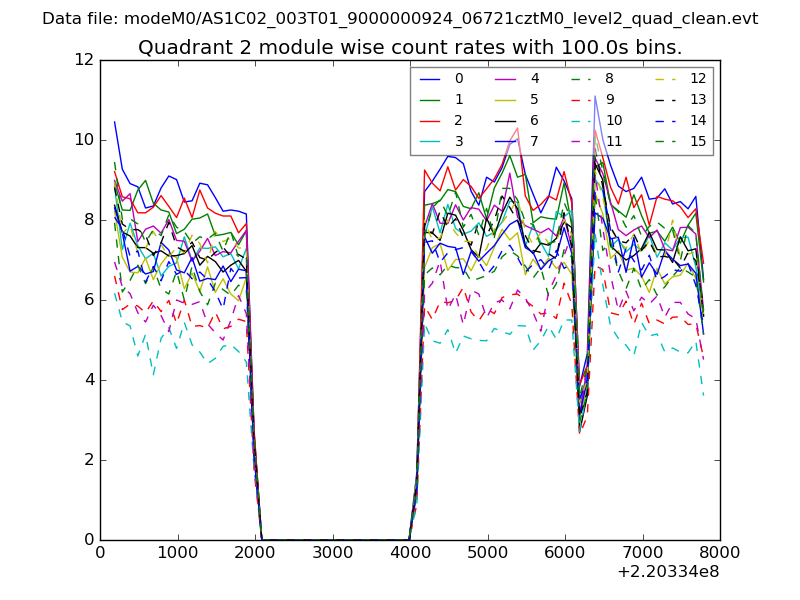
| Module-wise count rates for Quadrant B Data is divided into 100 sec bins |
 |
 |
| Module-wise count rates for Quadrant C Data is divided into 100 sec bins |
 |
 |
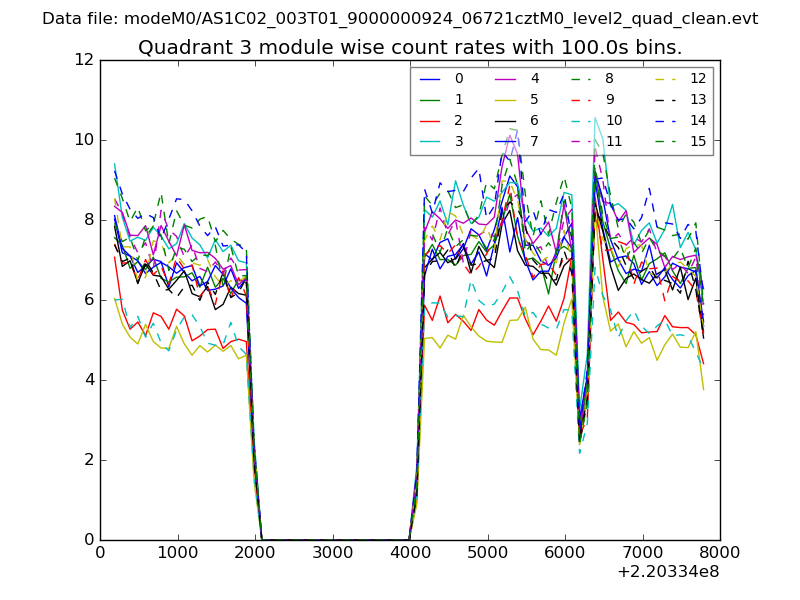
| Module-wise count rates for Quadrant D Data is divided into 100 sec bins |
 |
 |
| Parameter | Plot |
|---|---|
| CZT HV Monitor | 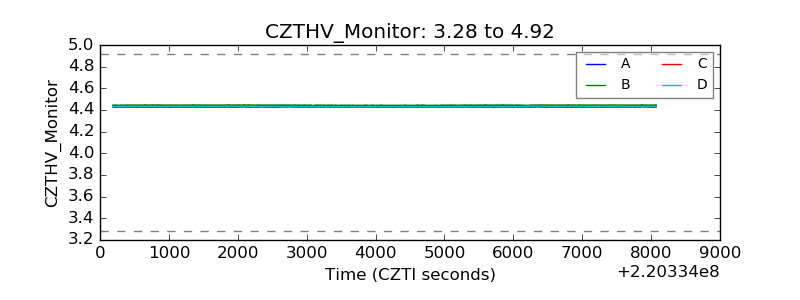 |
| D_VDD | 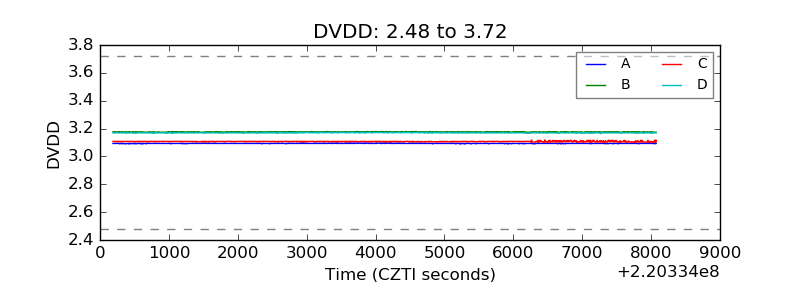 |
| Temperature 1 | 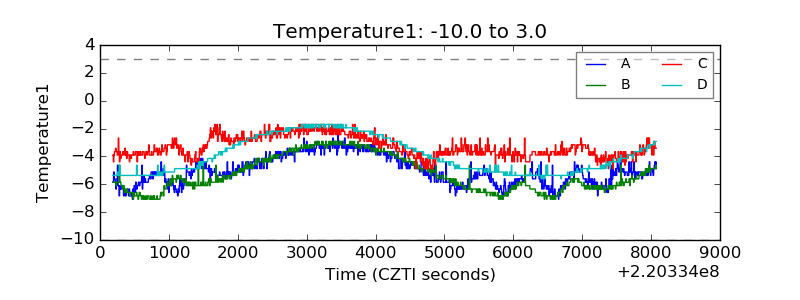 |
| Veto HV Monitor | 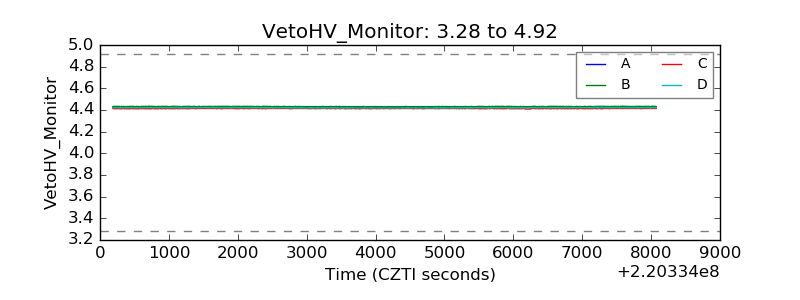 |
| Veto LLD |  |
| Alpha Counter | 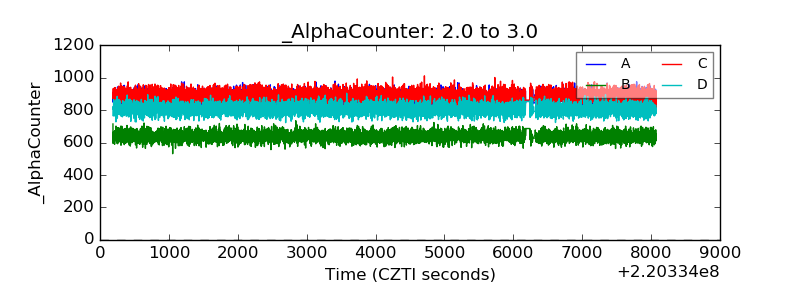 |
| _CPM_Rate | 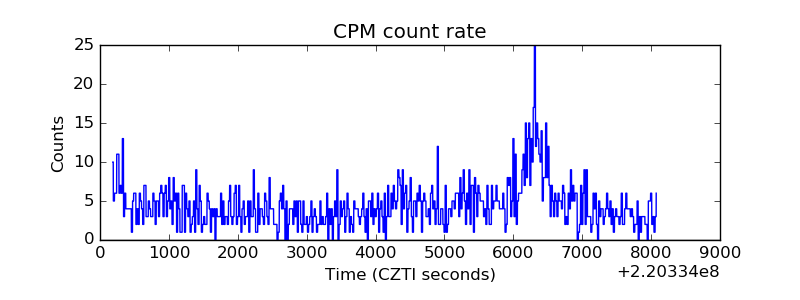 |
| CZT Counter | 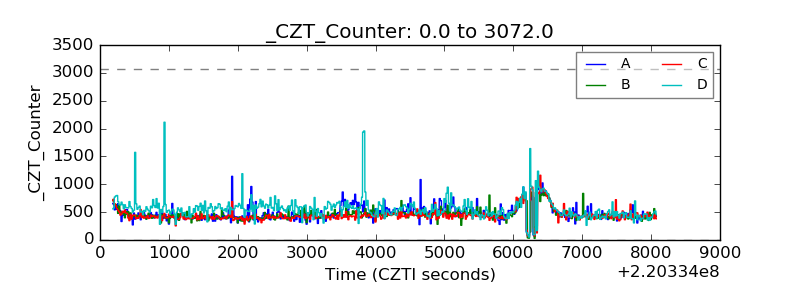 |
| +2.5 Volts monitor | 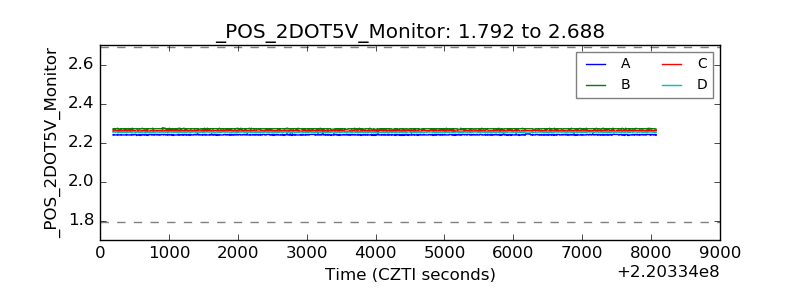 |
| +5 Volts monitor |  |
| _ROLL_ROT | 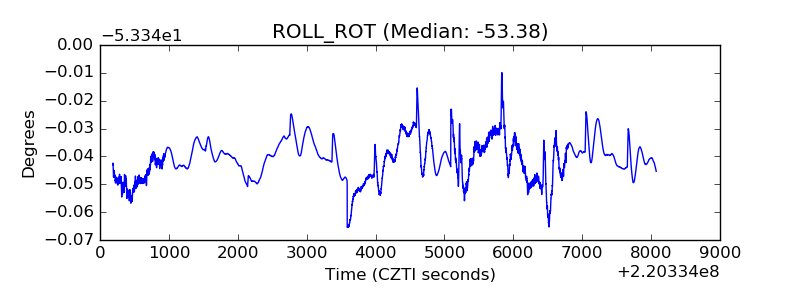 |
| _Roll_DEC | 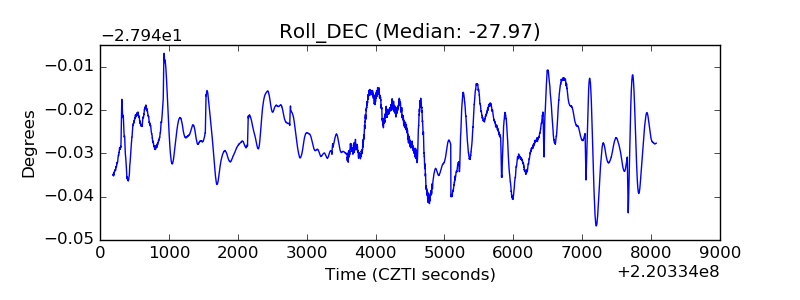 |
| _Roll_RA | 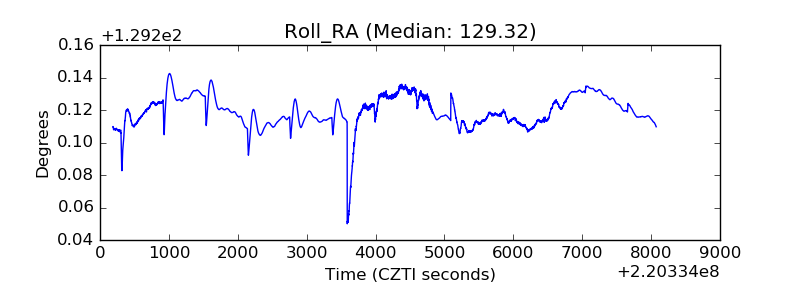 |
| Veto Counter | 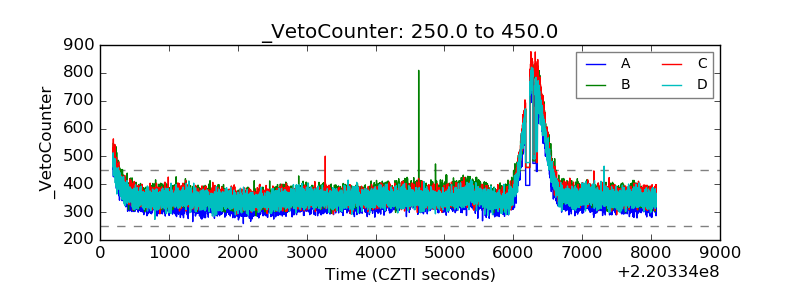 |