| Param | Original file | Final file |
|---|---|---|
| Filename | modeM0/AS1C02_003T01_9000000924_06724cztM0_level2.evt | modeM0/AS1C02_003T01_9000000924_06724cztM0_level2_quad_clean.evt |
| Size (bytes) | 235,080,000 | 30,389,760 |
| Size | 224.2 MB | 29.0 MB |
| Events in quadrant A | 1,612,889 | 167,278 |
| Events in quadrant B | 1,556,558 | 170,500 |
| Events in quadrant C | 1,548,995 | 168,037 |
| Events in quadrant D | 2,153,289 | 157,797 |
| Mode SS | |||
|---|---|---|---|
| Quadrant | BADHDUFLAG | Total packets | Discarded packets |
| A | 0 | 72 | 0 |
| B | 0 | 72 | 0 |
| C | 0 | 72 | 0 |
| D | 0 | 72 | 0 |
| Mode M0 | |||
|---|---|---|---|
| Quadrant | BADHDUFLAG | Total packets | Discarded packets |
| A | 0 | 7346 | 1 |
| B | 0 | 7288 | 0 |
| C | 0 | 7260 | 0 |
| D | 0 | 8744 | 0 |
| Quadrant | Total seconds | Saturated seconds | Saturation percentage |
|---|---|---|---|
| A | 3616 | 5 | 0.138274% |
| B | 3616 | 6 | 0.165929% |
| C | 3616 | 6 | 0.165929% |
| D | 3616 | 124 | 3.429204% |
Noise dominated data is calculated using 1-second bins in cleaned event files. If a bin has >2000 counts, and if more than 50% of those come from <1% of pixels, then it is considered to be noise-dominated and hence unusable.
| Quadrant | # 1 sec bins | Bins with >0 counts | Bins with >2000 counts | High rate bins dominated by noise | Noise dominated (total time) | Noise dominated (detector-on time) | Marked lightcurve |
|---|---|---|---|---|---|---|---|
| A | 3616 | 3616 | 0 | 0 | 0.00% | 0.00% | 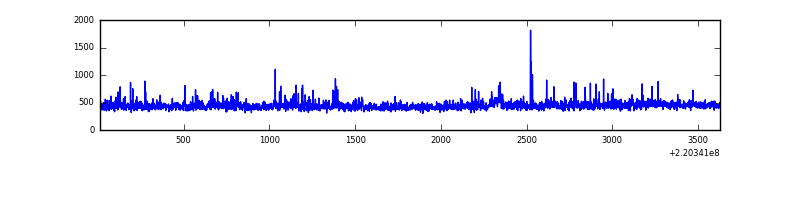 |
| B | 3616 | 3616 | 5 | 5 | 0.14% | 0.14% | 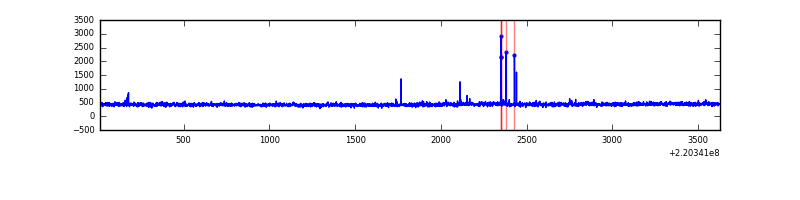 |
| C | 3616 | 3616 | 0 | 0 | 0.00% | 0.00% | 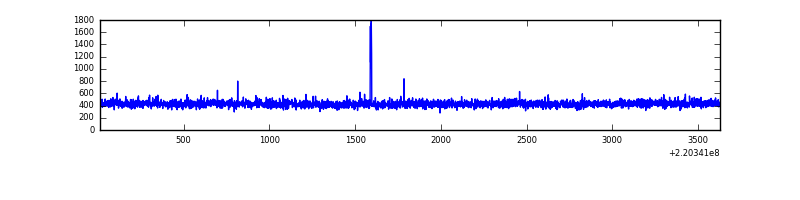 |
| D | 3616 | 3616 | 112 | 112 | 3.10% | 3.10% | 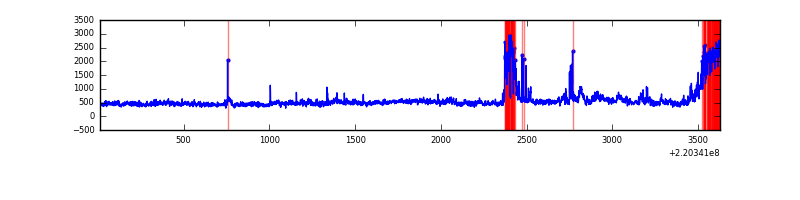 |
Top three noisy pixels from each quadrant. If the there are fewer than three noisy pixels in the level2.evt file, extra rows are filled as -1
| Pixel properties | Quadrant properties | ||||||
|---|---|---|---|---|---|---|---|
| Quadrant | DetID | PixID | Counts | Sigma | Mean | Median | Sigma |
| A | 8 | 15 | 70198 | 851.19 | 394 | 386 | 82.0 |
| A | 14 | 111 | 13456 | 159.36 | 394 | 386 | 82.0 |
| A | 13 | 251 | 10718 | 125.97 | 394 | 386 | 82.0 |
| B | 10 | 252 | 14223 | 178.89 | 394 | 384 | 77.4 |
| B | 4 | 81 | 8273 | 101.98 | 394 | 384 | 77.4 |
| B | 12 | 111 | 7627 | 93.63 | 394 | 384 | 77.4 |
| C | 10 | 22 | 11781 | 124.47 | 388 | 388 | 91.5 |
| C | 8 | 128 | 10096 | 106.06 | 388 | 388 | 91.5 |
| C | 8 | 144 | 3981 | 39.25 | 388 | 388 | 91.5 |
| D | 2 | 33 | 403651 | 4188.93 | 384 | 371 | 96.3 |
| D | 8 | 195 | 225599 | 2339.48 | 384 | 371 | 96.3 |
| D | 12 | 221 | 48910 | 504.18 | 384 | 371 | 96.3 |
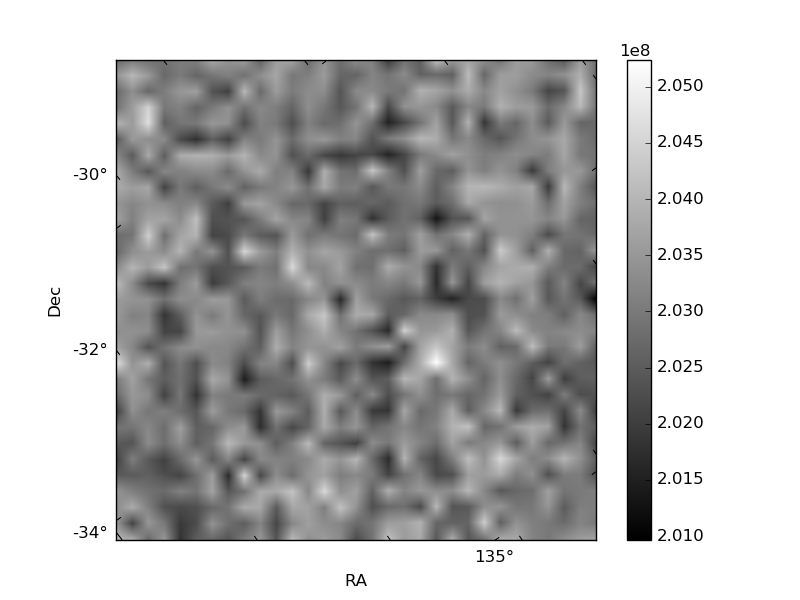
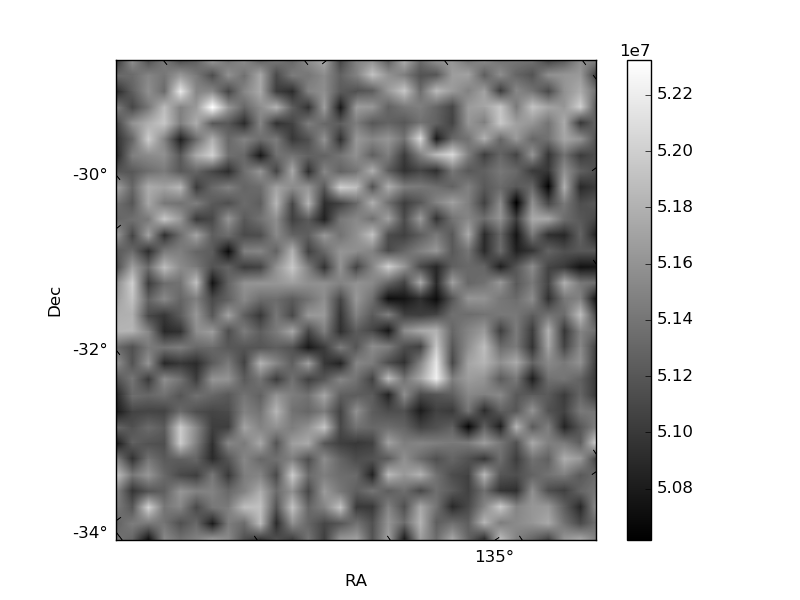
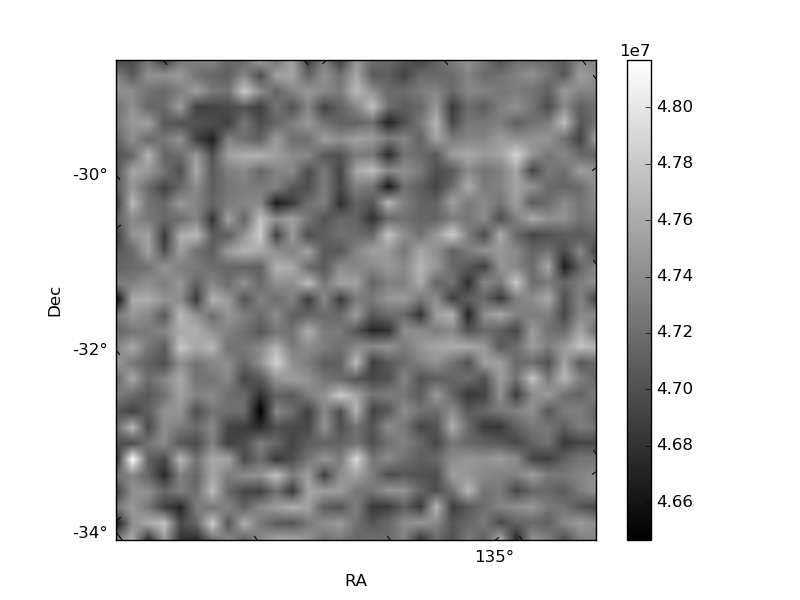
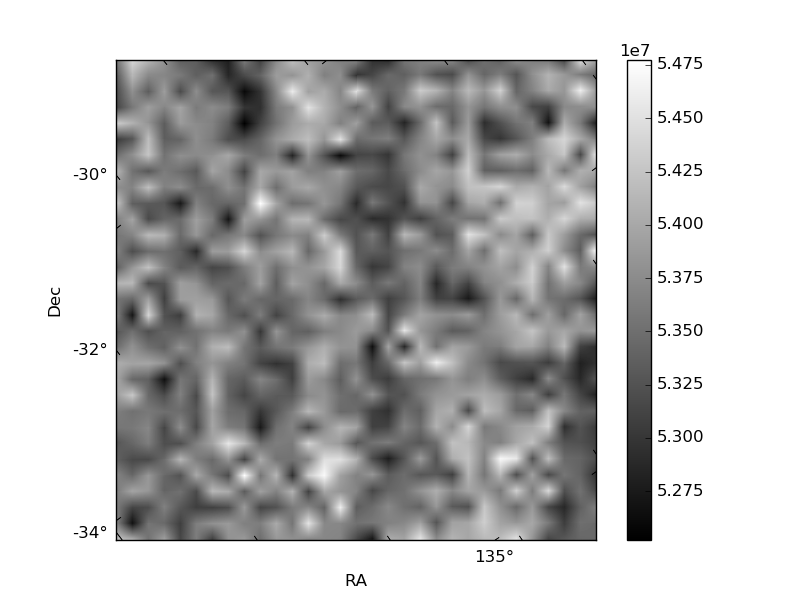
Histogram calculated using DETX and DETY for each event in the final _common_clean file
| Quadrant A | 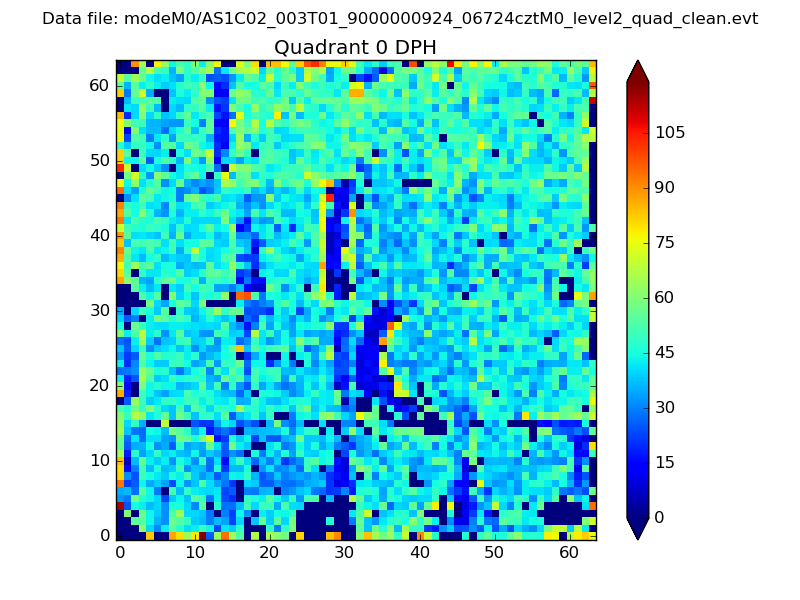 |
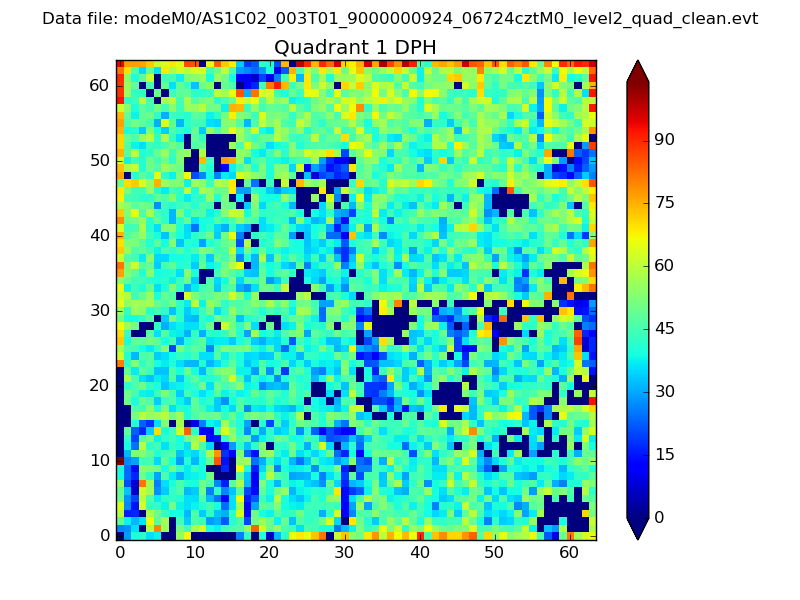 |
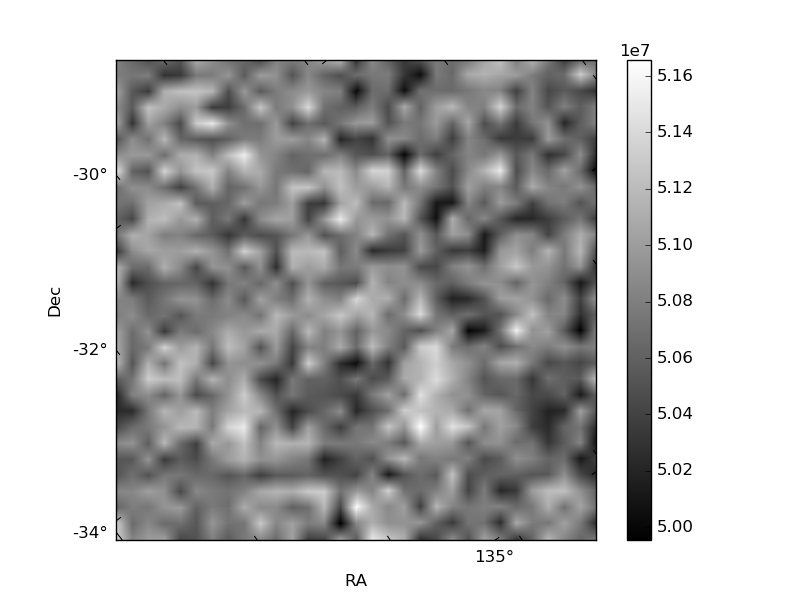
Quadrant B |
|---|---|---|---|
| Quadrant D | 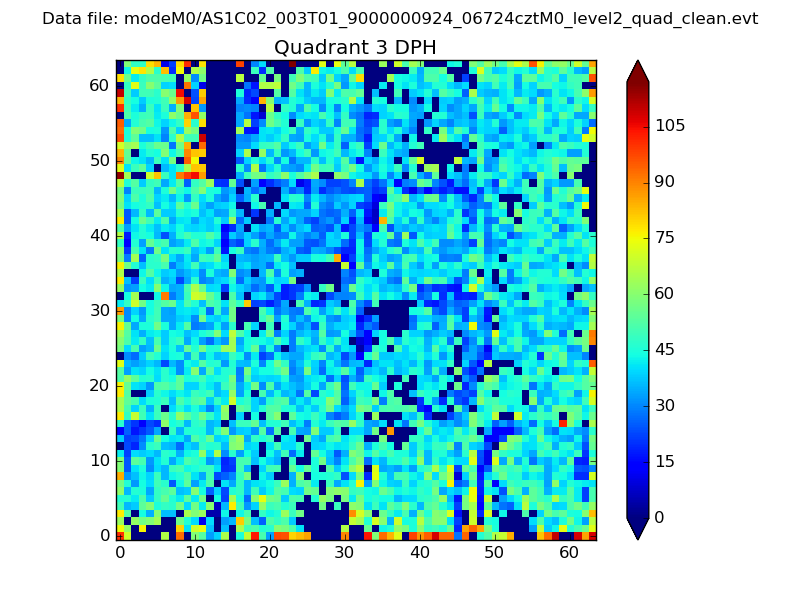 |
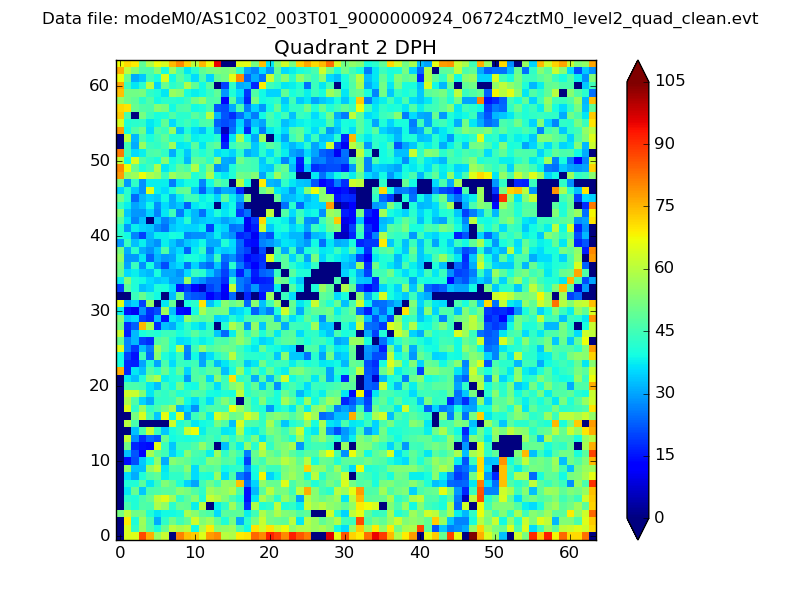 |
Quadrant C |
| Plot type | Count rate plots | Images |
|---|---|---|
| Comparison with Poisson distribution Blue bars denote a histogram of data divided into 1 sec bins. Red curve is a Poisson curve with rate = median count rate of data. |
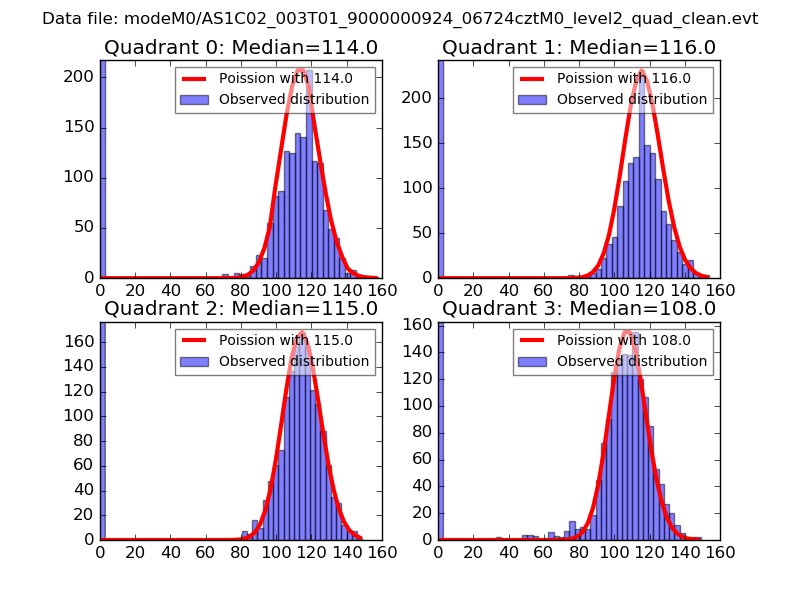 |
 |
| Quadrant-wise count rates Data is divided into 100 sec bins |
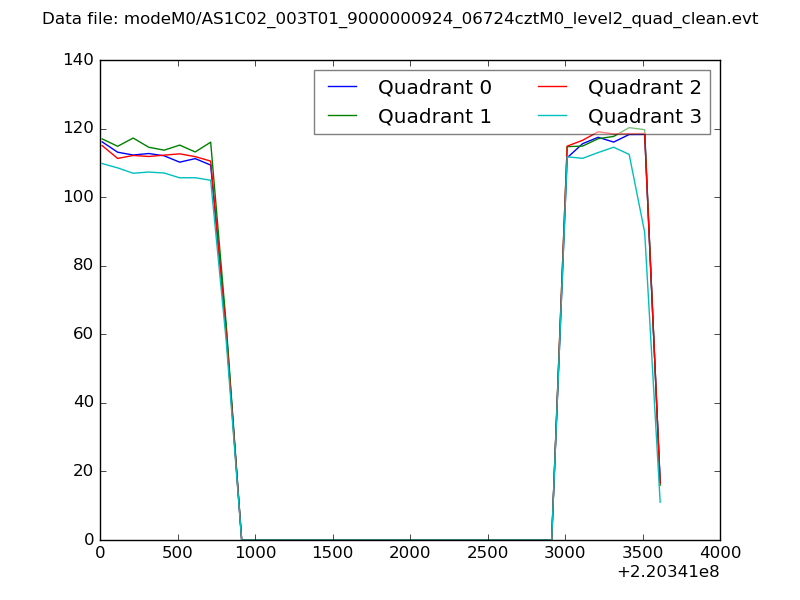 |
|
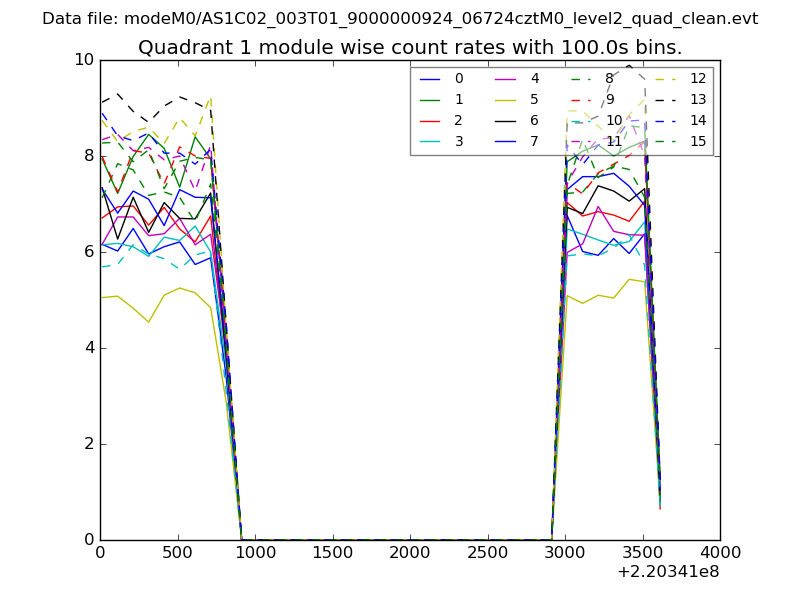
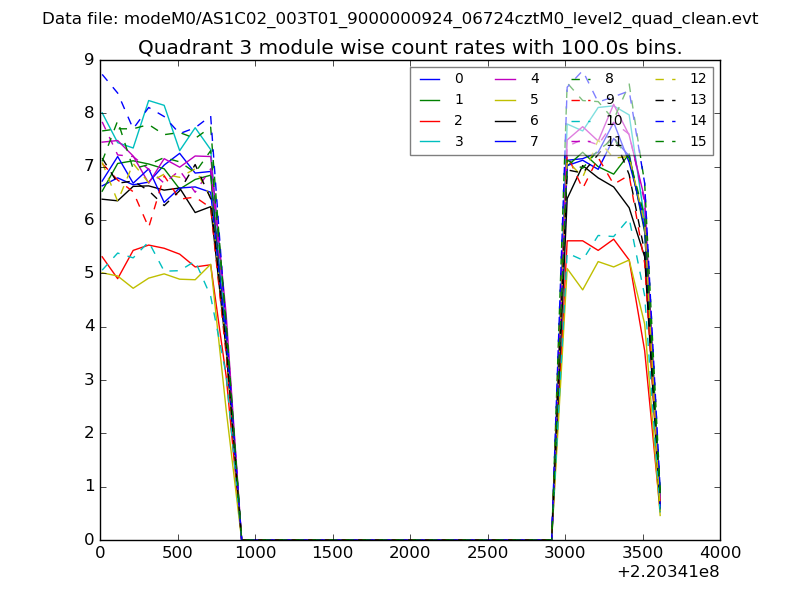
| Module-wise count rates for Quadrant A Data is divided into 100 sec bins |
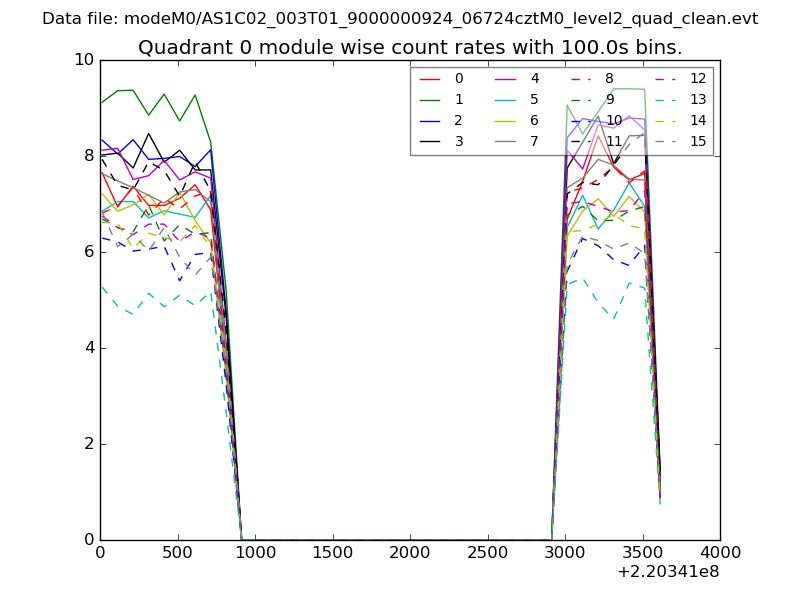 |
 |
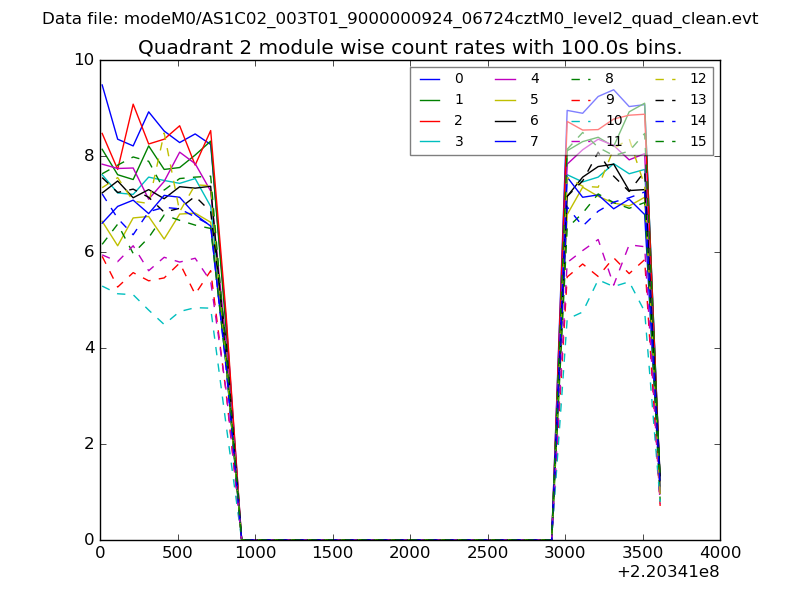
| Module-wise count rates for Quadrant B Data is divided into 100 sec bins |
 |
 |
| Module-wise count rates for Quadrant C Data is divided into 100 sec bins |
 |
 |
| Module-wise count rates for Quadrant D Data is divided into 100 sec bins |
 |
 |
| Parameter | Plot |
|---|---|
| CZT HV Monitor | 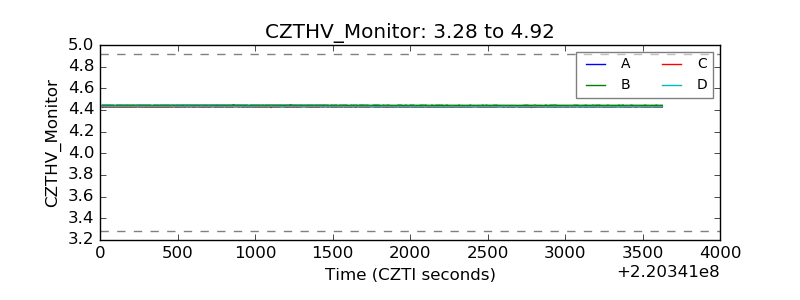 |
| D_VDD | 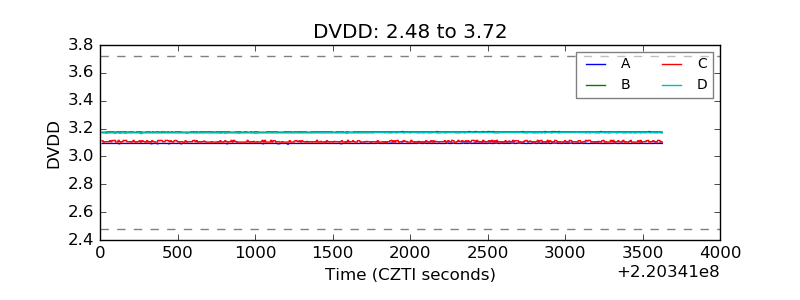 |
| Temperature 1 | 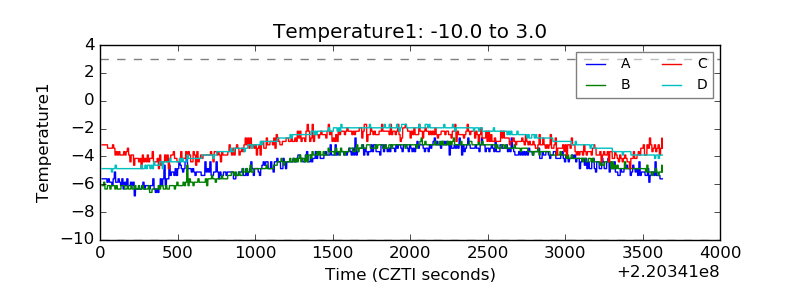 |
| Veto HV Monitor | 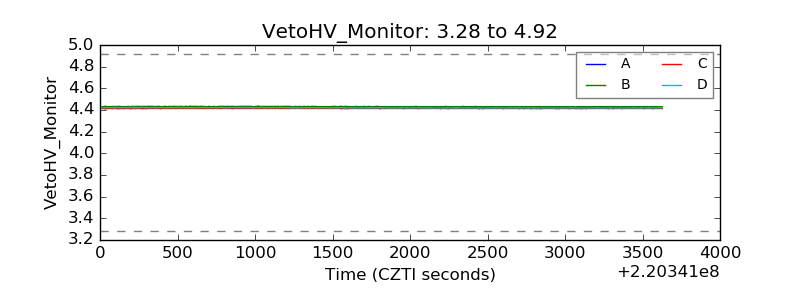 |
| Veto LLD | 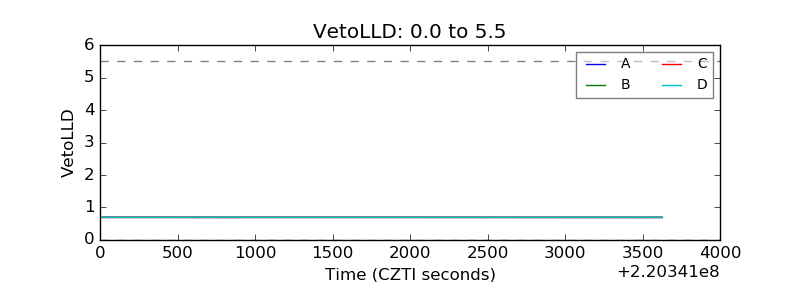 |
| Alpha Counter | 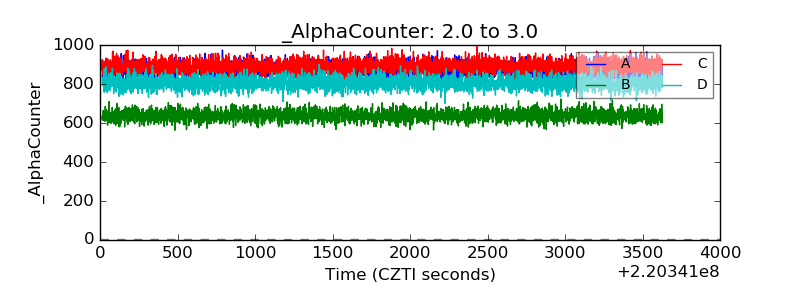 |
| _CPM_Rate | 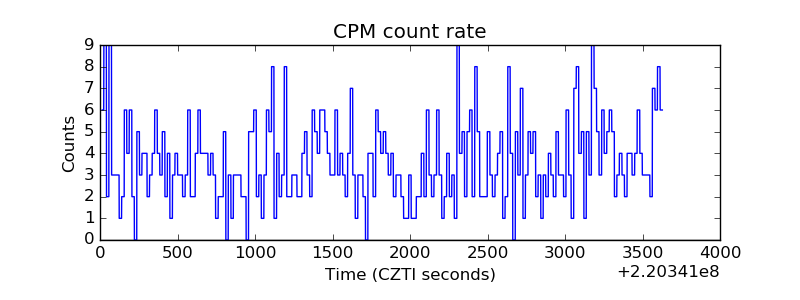 |
| CZT Counter | 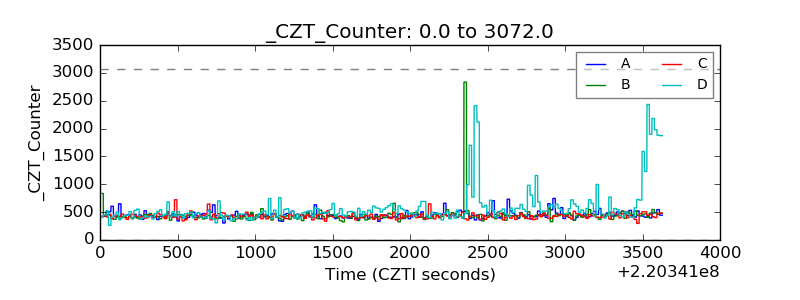 |
| +2.5 Volts monitor | 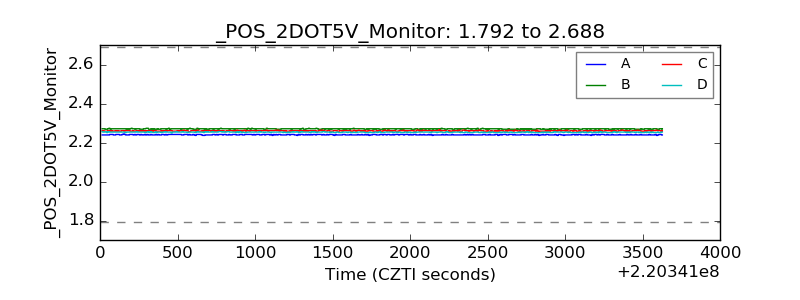 |
| +5 Volts monitor |  |
| _ROLL_ROT | 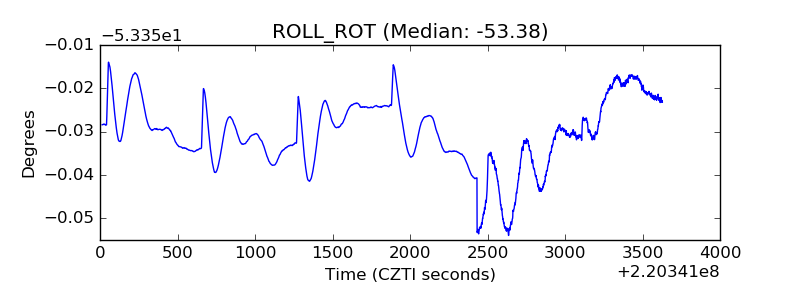 |
| _Roll_DEC | 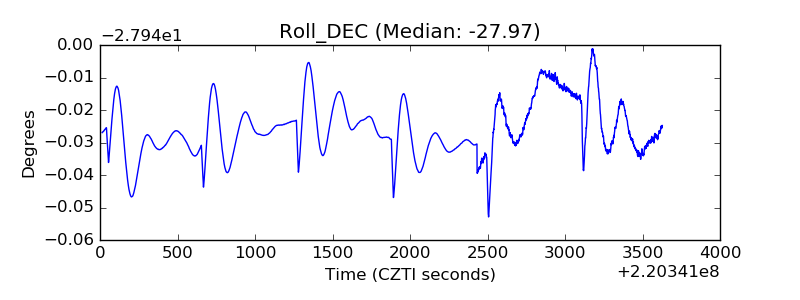 |
| _Roll_RA | 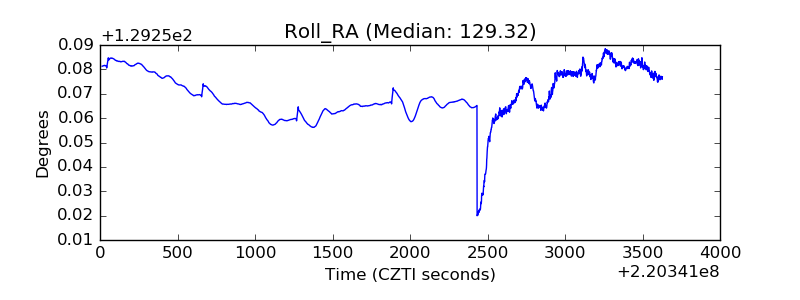 |
| Veto Counter | 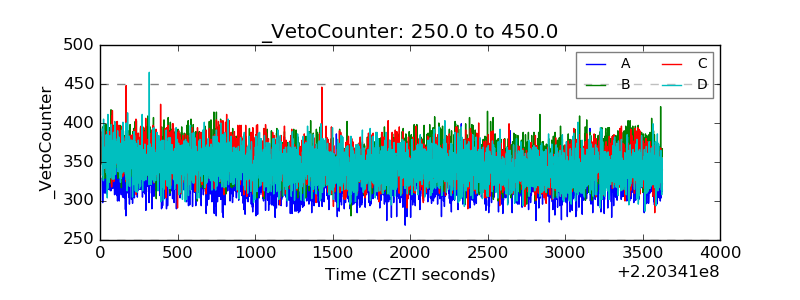 |