| Param | Original file | Final file |
|---|---|---|
| Filename | modeM0/AS1C02_003T01_9000000924_06725cztM0_level2.evt | modeM0/AS1C02_003T01_9000000924_06725cztM0_level2_quad_clean.evt |
| Size (bytes) | 300,257,280 | 60,995,520 |
| Size | 286.3 MB | 58.2 MB |
| Events in quadrant A | 2,219,714 | 390,998 |
| Events in quadrant B | 1,972,770 | 397,940 |
| Events in quadrant C | 1,927,122 | 389,923 |
| Events in quadrant D | 2,684,458 | 369,652 |
| Mode M9 | |||
|---|---|---|---|
| Quadrant | BADHDUFLAG | Total packets | Discarded packets |
| A | 0 | 4 | 0 |
| B | 0 | 4 | 0 |
| C | 0 | 4 | 0 |
| D | 0 | 4 | 0 |
| Mode SS | |||
|---|---|---|---|
| Quadrant | BADHDUFLAG | Total packets | Discarded packets |
| A | 0 | 86 | 0 |
| B | 0 | 86 | 0 |
| C | 0 | 86 | 0 |
| D | 0 | 86 | 0 |
| Mode M0 | |||
|---|---|---|---|
| Quadrant | BADHDUFLAG | Total packets | Discarded packets |
| A | 0 | 9447 | 2 |
| B | 0 | 8770 | 1 |
| C | 0 | 8734 | 1 |
| D | 0 | 10790 | 1 |
| Quadrant | Total seconds | Saturated seconds | Saturation percentage |
|---|---|---|---|
| A | 4237 | 130 | 3.068209% |
| B | 4237 | 105 | 2.478169% |
| C | 4237 | 91 | 2.147746% |
| D | 4237 | 266 | 6.278027% |
Noise dominated data is calculated using 1-second bins in cleaned event files. If a bin has >2000 counts, and if more than 50% of those come from <1% of pixels, then it is considered to be noise-dominated and hence unusable.
| Quadrant | # 1 sec bins | Bins with >0 counts | Bins with >2000 counts | High rate bins dominated by noise | Noise dominated (total time) | Noise dominated (detector-on time) | Marked lightcurve |
|---|---|---|---|---|---|---|---|
| A | 4647 | 4238 | 16 | 16 | 0.34% | 0.38% | 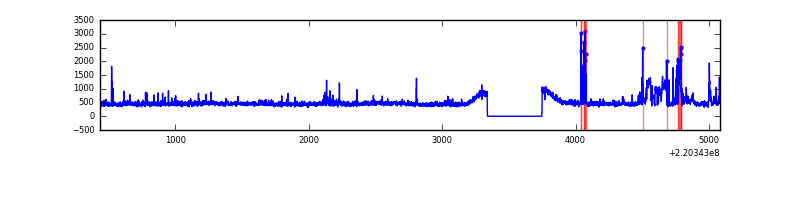 |
| B | 4647 | 4238 | 5 | 5 | 0.11% | 0.12% | 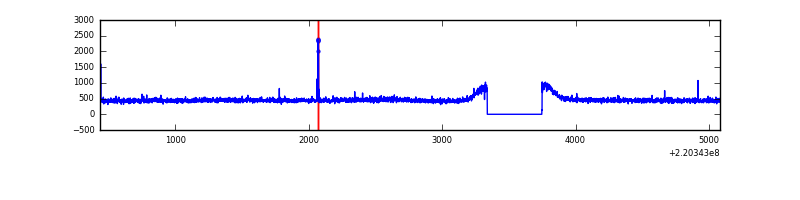 |
| C | 4647 | 4238 | 0 | 0 | 0.00% | 0.00% | 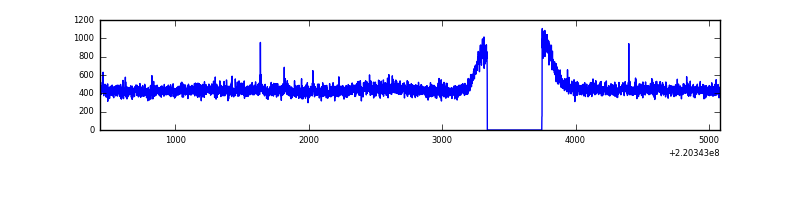 |
| D | 4647 | 4238 | 149 | 149 | 3.21% | 3.52% | 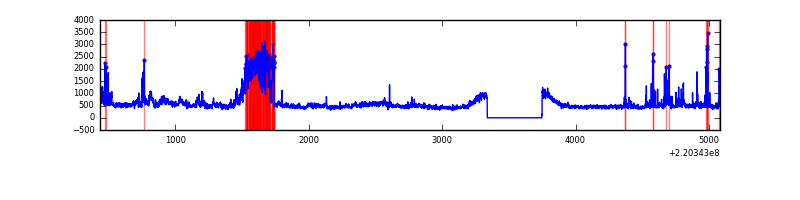 |
Top three noisy pixels from each quadrant. If the there are fewer than three noisy pixels in the level2.evt file, extra rows are filled as -1
| Pixel properties | Quadrant properties | ||||||
|---|---|---|---|---|---|---|---|
| Quadrant | DetID | PixID | Counts | Sigma | Mean | Median | Sigma |
| A | 14 | 111 | 185807 | 1789.78 | 498 | 485 | 103.5 |
| A | 8 | 15 | 63253 | 606.19 | 498 | 485 | 103.5 |
| A | 13 | 251 | 54455 | 521.22 | 498 | 485 | 103.5 |
| B | 3 | 220 | 14849 | 143.99 | 503 | 490 | 99.7 |
| B | 12 | 111 | 10480 | 100.18 | 503 | 490 | 99.7 |
| B | 11 | 111 | 8153 | 76.85 | 503 | 490 | 99.7 |
| C | 9 | 247 | 8305 | 67.79 | 487 | 489 | 115.3 |
| C | 8 | 128 | 7256 | 58.69 | 487 | 489 | 115.3 |
| C | 13 | 61 | 3722 | 28.04 | 487 | 489 | 115.3 |
| D | 2 | 33 | 473809 | 3945.31 | 480 | 464 | 120.0 |
| D | 8 | 195 | 151356 | 1257.68 | 480 | 464 | 120.0 |
| D | 12 | 221 | 118484 | 983.69 | 480 | 464 | 120.0 |
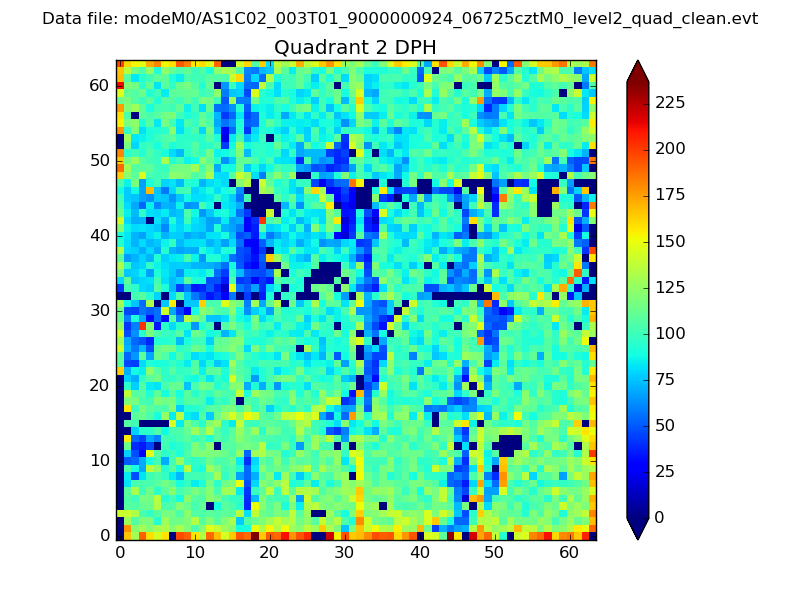
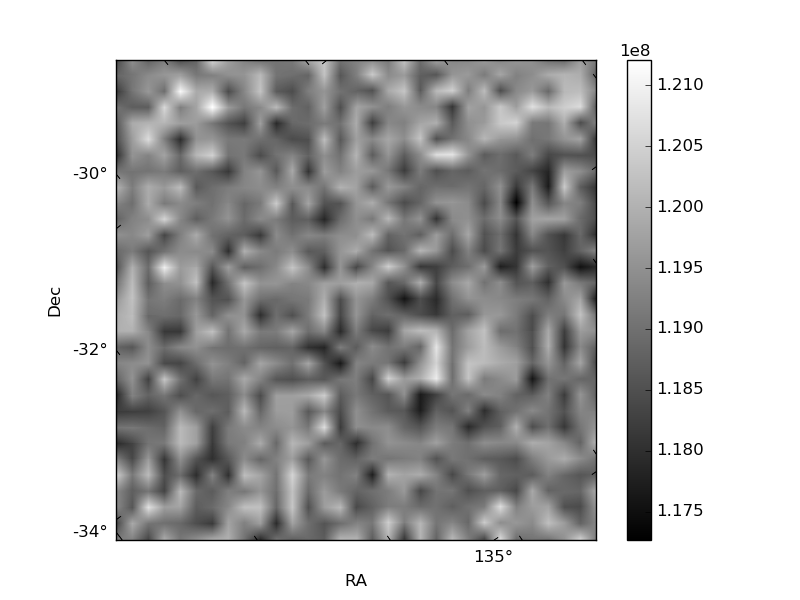
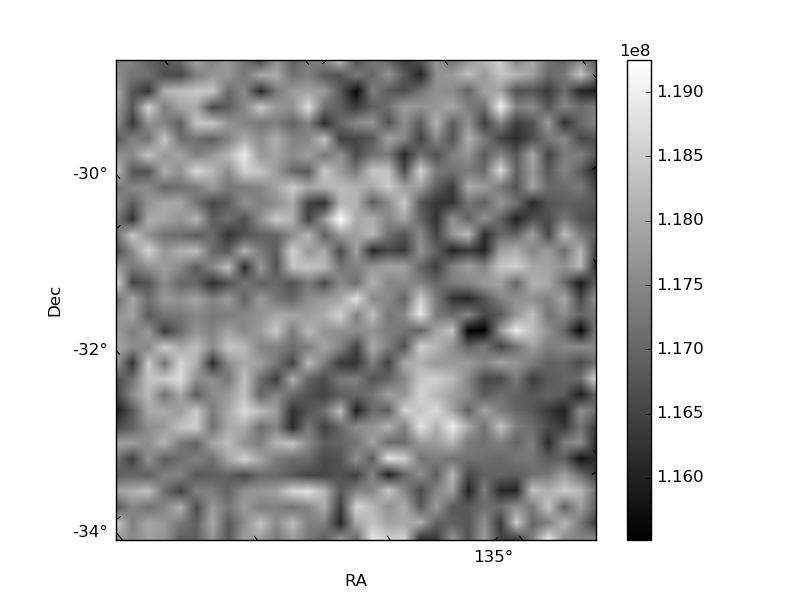
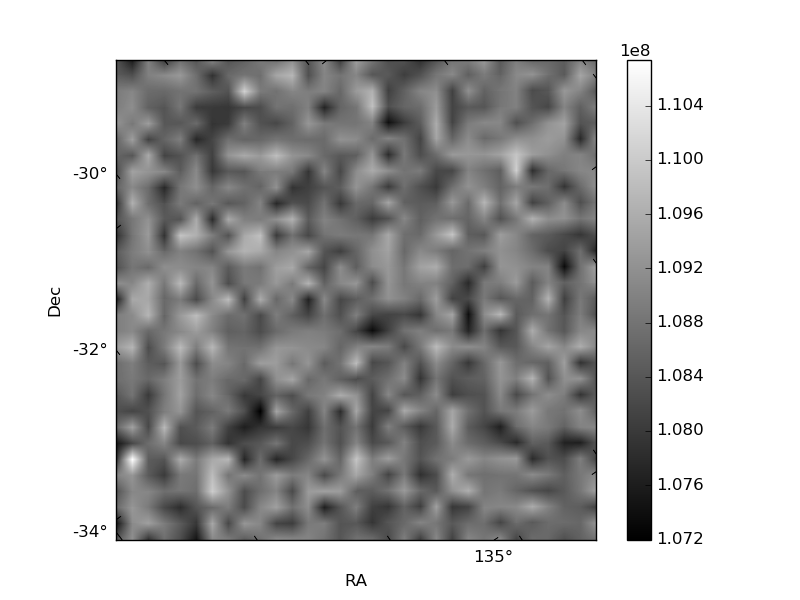
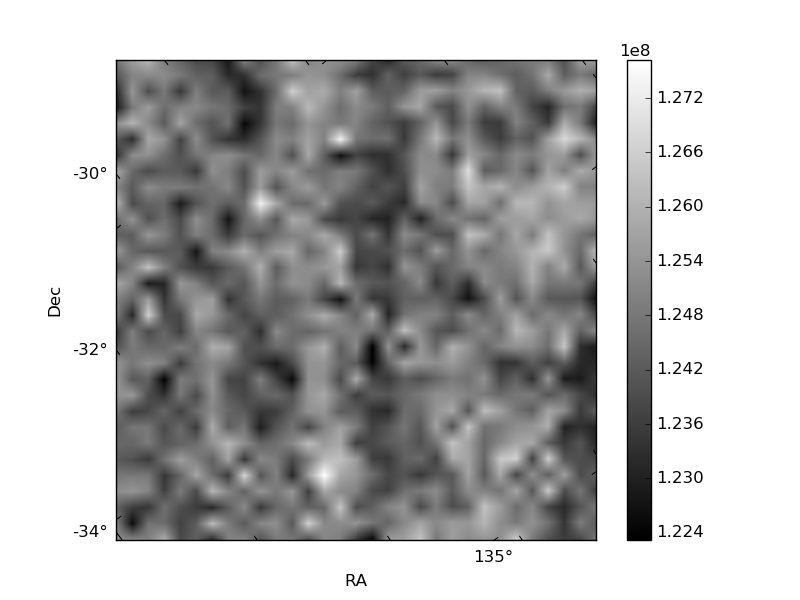
Histogram calculated using DETX and DETY for each event in the final _common_clean file
| Quadrant A | 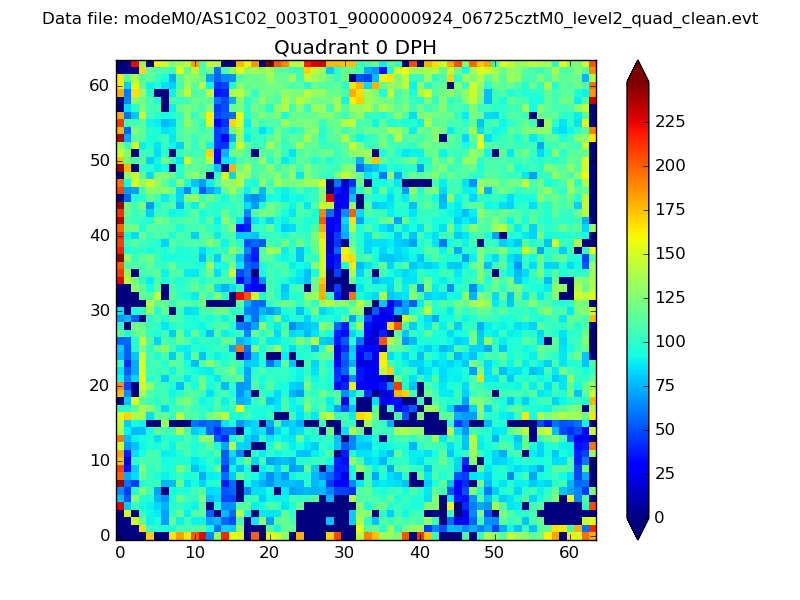 |
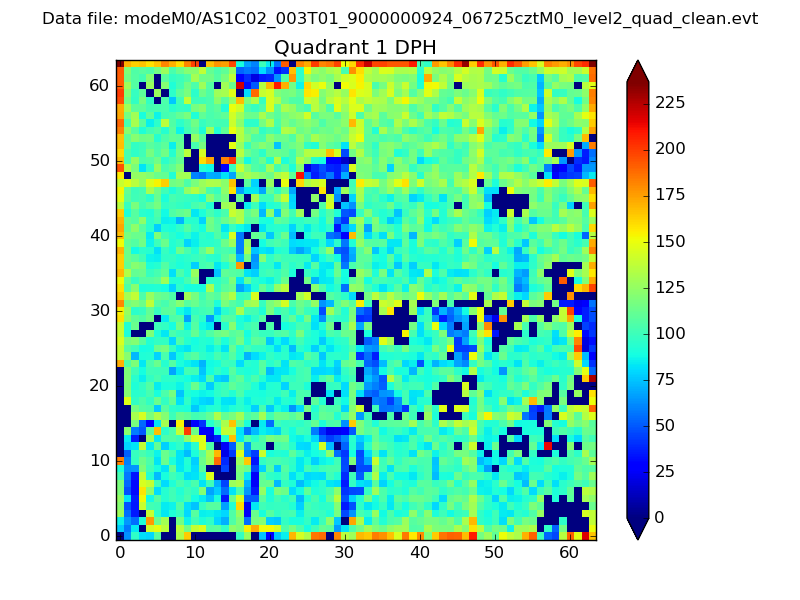 |
Quadrant B |
|---|---|---|---|
| Quadrant D | 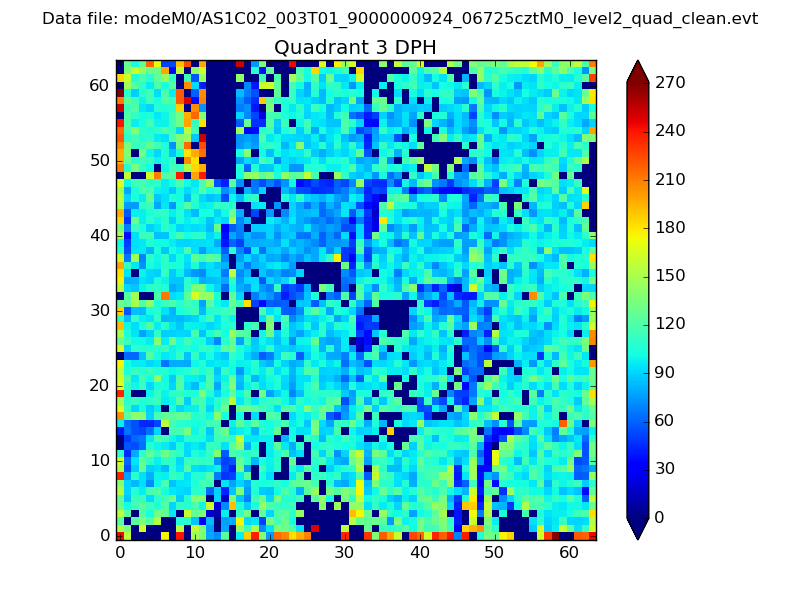 |
 |
Quadrant C |
| Plot type | Count rate plots | Images |
|---|---|---|
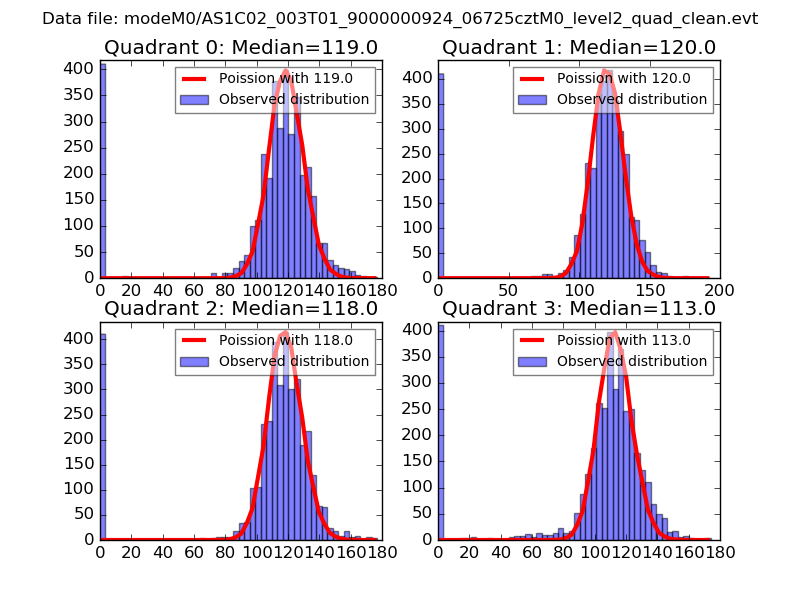
| Comparison with Poisson distribution Blue bars denote a histogram of data divided into 1 sec bins. Red curve is a Poisson curve with rate = median count rate of data. |
 |
 |
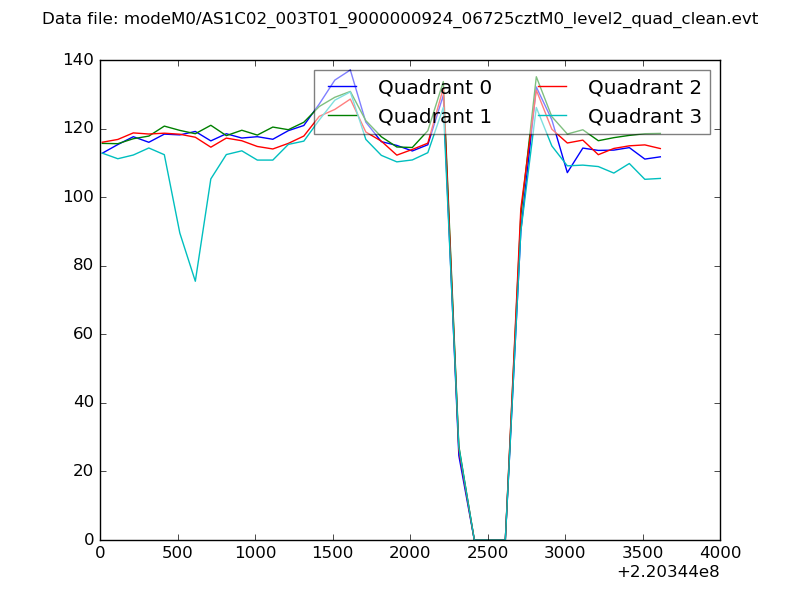
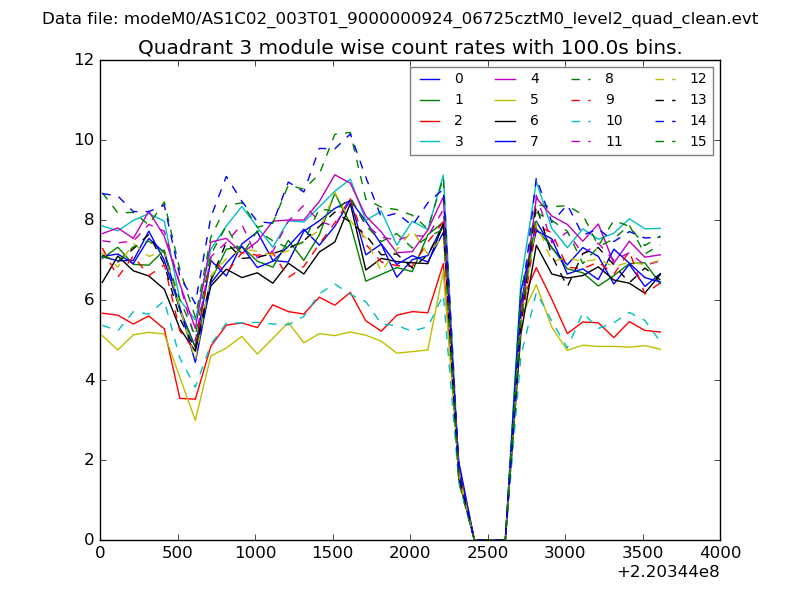
| Quadrant-wise count rates Data is divided into 100 sec bins |
 |
|
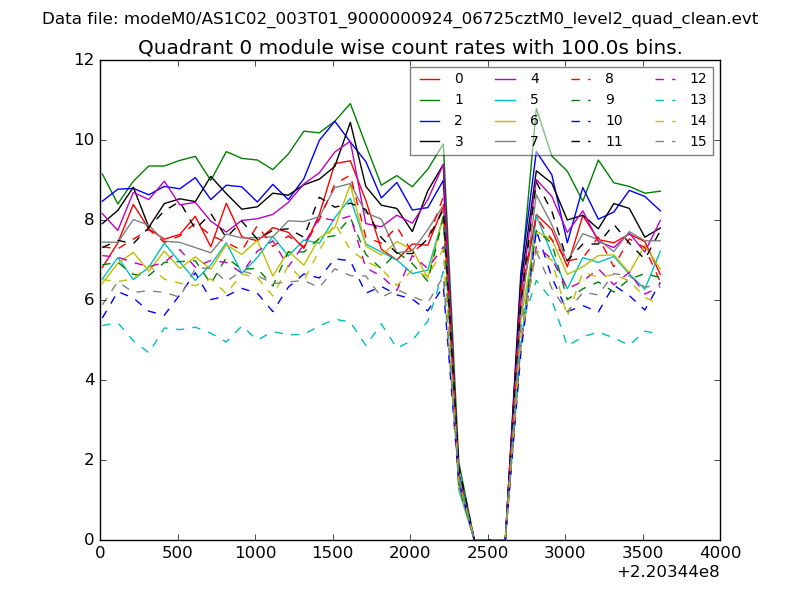
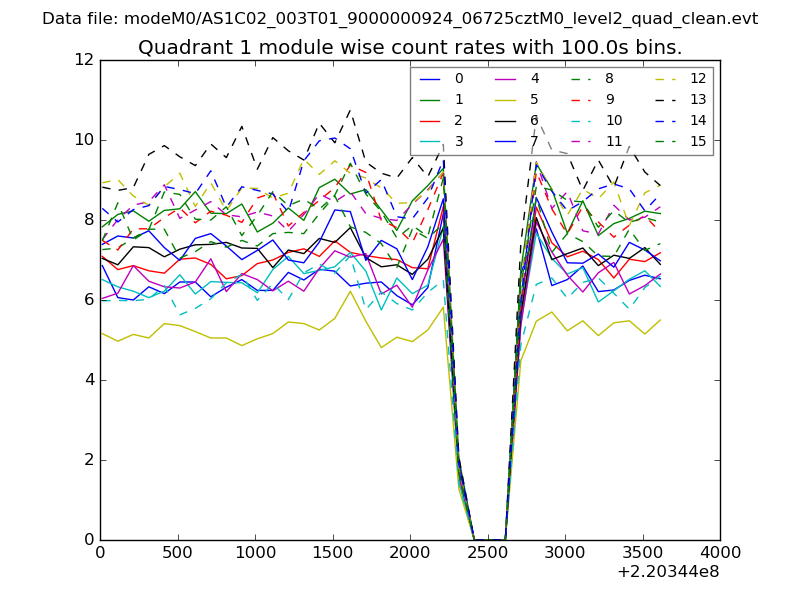
| Module-wise count rates for Quadrant A Data is divided into 100 sec bins |
 |
 |
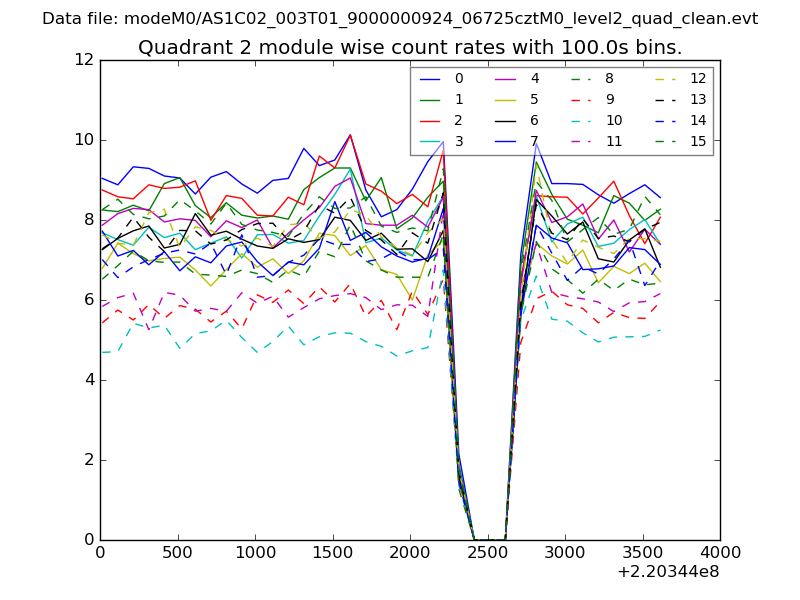
| Module-wise count rates for Quadrant B Data is divided into 100 sec bins |
 |
 |
| Module-wise count rates for Quadrant C Data is divided into 100 sec bins |
 |
 |
| Module-wise count rates for Quadrant D Data is divided into 100 sec bins |
 |
 |
| Parameter | Plot |
|---|---|
| CZT HV Monitor | 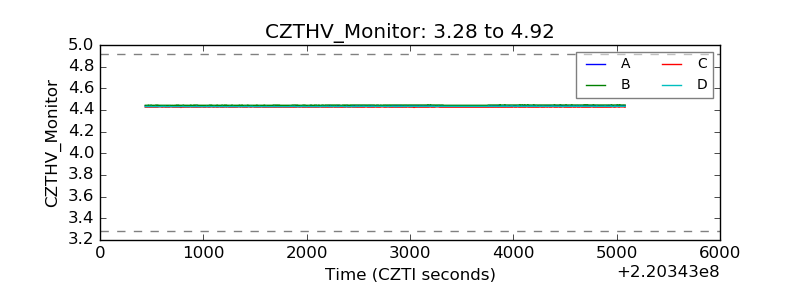 |
| D_VDD | 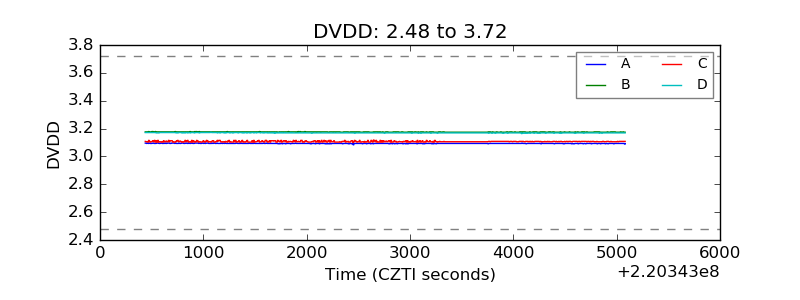 |
| Temperature 1 | 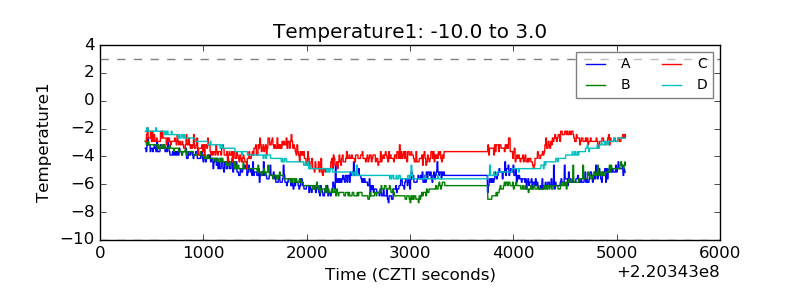 |
| Veto HV Monitor | 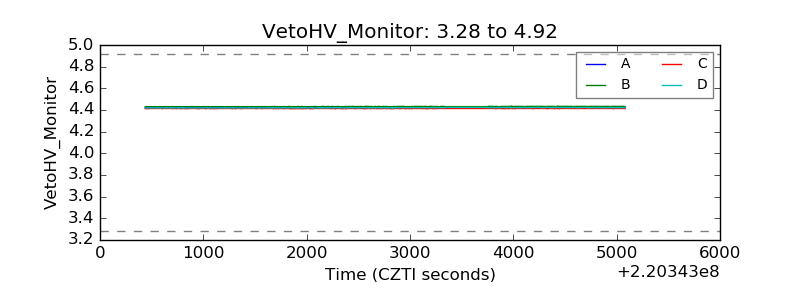 |
| Veto LLD | 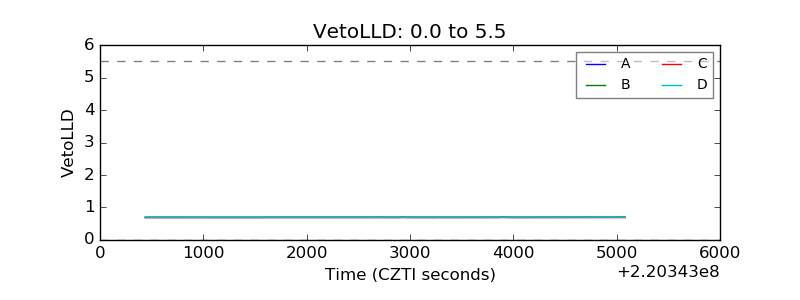 |
| Alpha Counter | 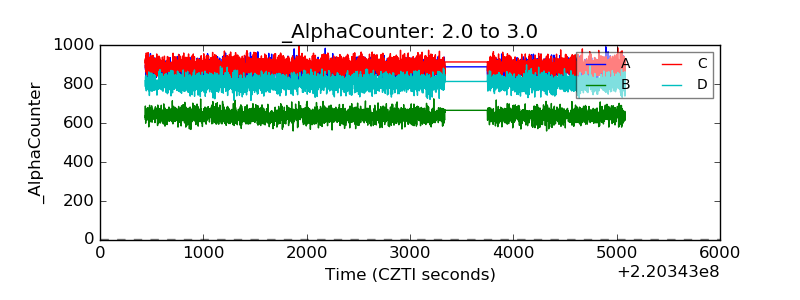 |
| _CPM_Rate | 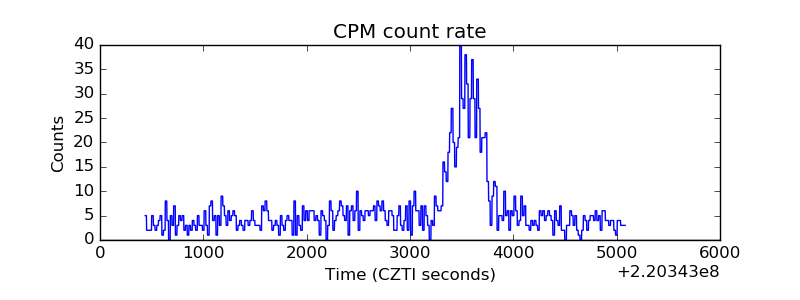 |
| CZT Counter | 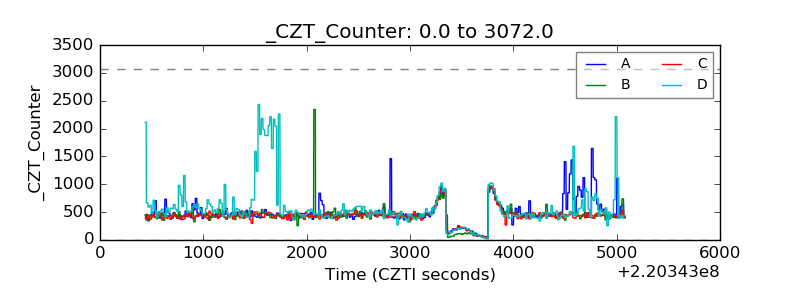 |
| +2.5 Volts monitor | 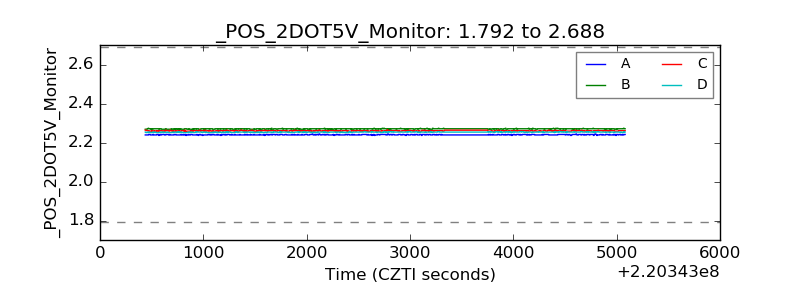 |
| +5 Volts monitor |  |
| _ROLL_ROT | 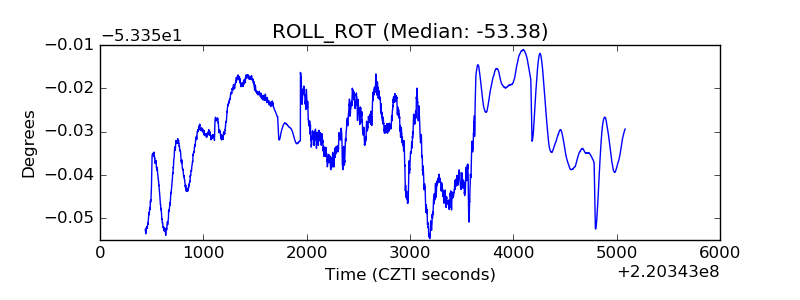 |
| _Roll_DEC | 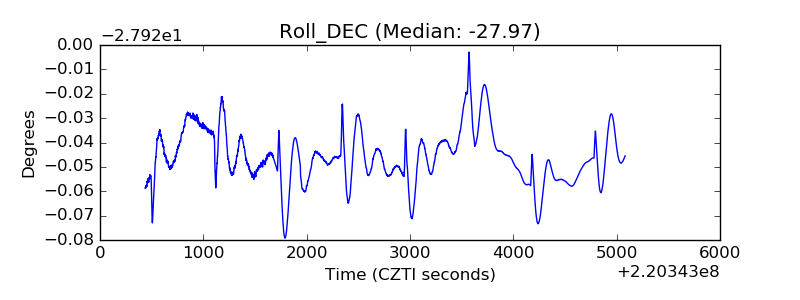 |
| _Roll_RA | 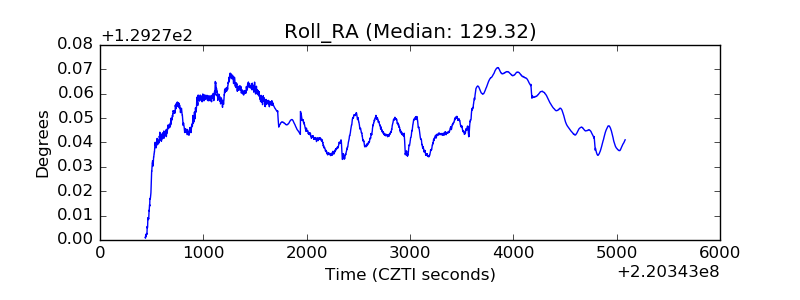 |
| Veto Counter | 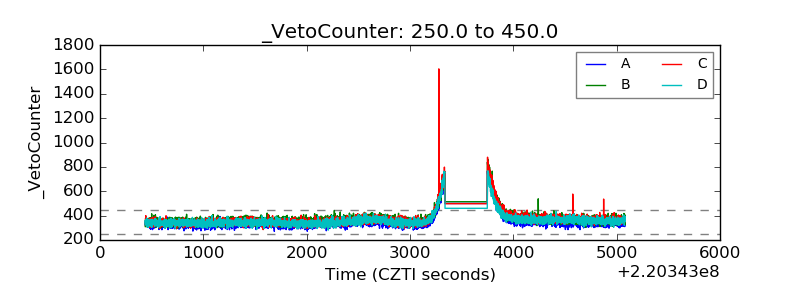 |