| Param | Original file | Final file |
|---|---|---|
| Filename | modeM0/AS1C02_003T01_9000000924_06727cztM0_level2.evt | modeM0/AS1C02_003T01_9000000924_06727cztM0_level2_quad_clean.evt |
| Size (bytes) | 920,315,520 | 147,487,680 |
| Size | 877.7 MB | 140.7 MB |
| Events in quadrant A | 6,514,950 | 886,461 |
| Events in quadrant B | 6,393,253 | 889,312 |
| Events in quadrant C | 6,087,982 | 879,940 |
| Events in quadrant D | 7,926,597 | 842,919 |
| Mode M9 | |||
|---|---|---|---|
| Quadrant | BADHDUFLAG | Total packets | Discarded packets |
| A | 0 | 13 | 0 |
| B | 0 | 13 | 0 |
| C | 0 | 13 | 0 |
| D | 0 | 13 | 0 |
| Mode SS | |||
|---|---|---|---|
| Quadrant | BADHDUFLAG | Total packets | Discarded packets |
| A | 0 | 286 | 0 |
| B | 0 | 286 | 0 |
| C | 0 | 286 | 0 |
| D | 0 | 286 | 0 |
| Mode M0 | |||
|---|---|---|---|
| Quadrant | BADHDUFLAG | Total packets | Discarded packets |
| A | 0 | 29376 | 3 |
| B | 0 | 28912 | 2 |
| C | 0 | 28484 | 2 |
| D | 0 | 32478 | 2 |
| Quadrant | Total seconds | Saturated seconds | Saturation percentage |
|---|---|---|---|
| A | 14005 | 181 | 1.292396% |
| B | 14005 | 180 | 1.285255% |
| C | 14005 | 122 | 0.871117% |
| D | 14005 | 326 | 2.327740% |
Noise dominated data is calculated using 1-second bins in cleaned event files. If a bin has >2000 counts, and if more than 50% of those come from <1% of pixels, then it is considered to be noise-dominated and hence unusable.
| Quadrant | # 1 sec bins | Bins with >0 counts | Bins with >2000 counts | High rate bins dominated by noise | Noise dominated (total time) | Noise dominated (detector-on time) | Marked lightcurve |
|---|---|---|---|---|---|---|---|
| A | 15370 | 14007 | 12 | 12 | 0.08% | 0.09% | 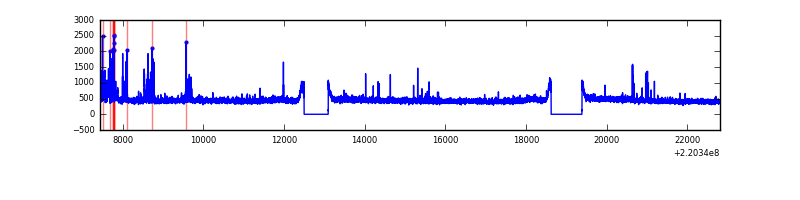 |
| B | 15370 | 14007 | 30 | 30 | 0.20% | 0.21% | 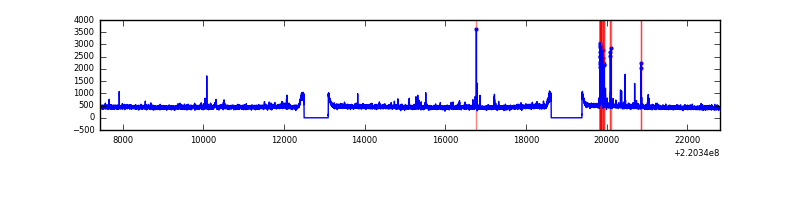 |
| C | 15370 | 14007 | 3 | 3 | 0.02% | 0.02% | 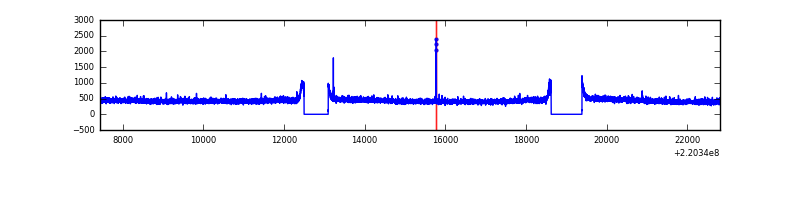 |
| D | 15370 | 14007 | 181 | 181 | 1.18% | 1.29% | 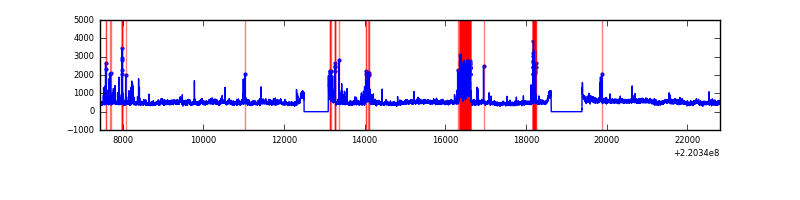 |
Top three noisy pixels from each quadrant. If the there are fewer than three noisy pixels in the level2.evt file, extra rows are filled as -1
| Pixel properties | Quadrant properties | ||||||
|---|---|---|---|---|---|---|---|
| Quadrant | DetID | PixID | Counts | Sigma | Mean | Median | Sigma |
| A | 14 | 111 | 228568 | 700.36 | 1586 | 1547 | 324.2 |
| A | 13 | 251 | 116961 | 356.05 | 1586 | 1547 | 324.2 |
| A | 8 | 15 | 67287 | 202.81 | 1586 | 1547 | 324.2 |
| B | 10 | 252 | 160044 | 517.01 | 1598 | 1559 | 306.5 |
| B | 12 | 111 | 32194 | 99.94 | 1598 | 1559 | 306.5 |
| B | 11 | 111 | 25639 | 78.55 | 1598 | 1559 | 306.5 |
| C | 12 | 4 | 20709 | 53.15 | 1551 | 1555 | 360.4 |
| C | 9 | 247 | 18145 | 46.03 | 1551 | 1555 | 360.4 |
| C | 13 | 61 | 12080 | 29.2 | 1551 | 1555 | 360.4 |
| D | 8 | 195 | 963742 | 2542.97 | 1543 | 1494 | 378.4 |
| D | 2 | 33 | 498640 | 1313.83 | 1543 | 1494 | 378.4 |
| D | 2 | 14 | 146812 | 384.04 | 1543 | 1494 | 378.4 |
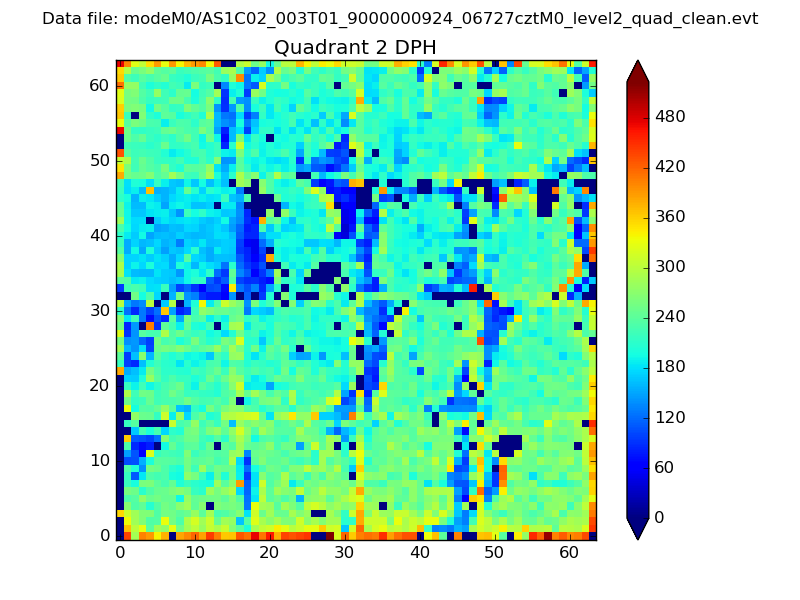
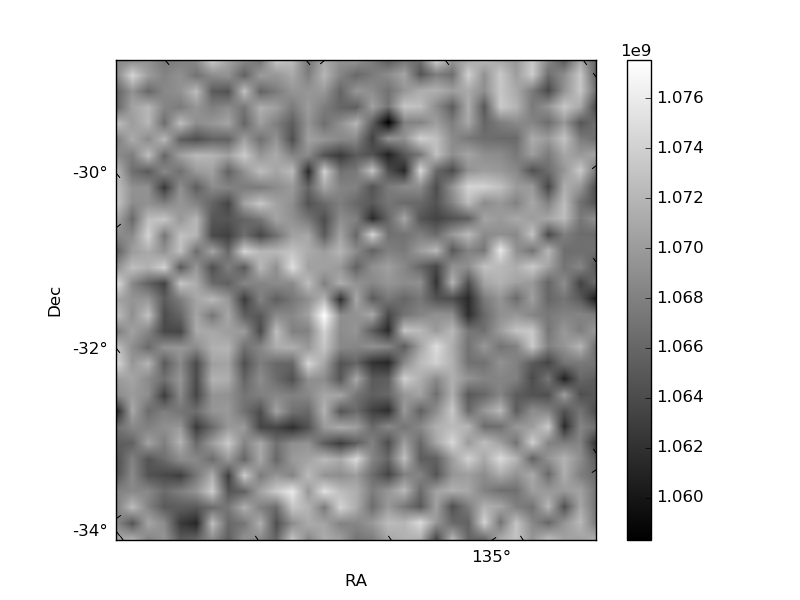
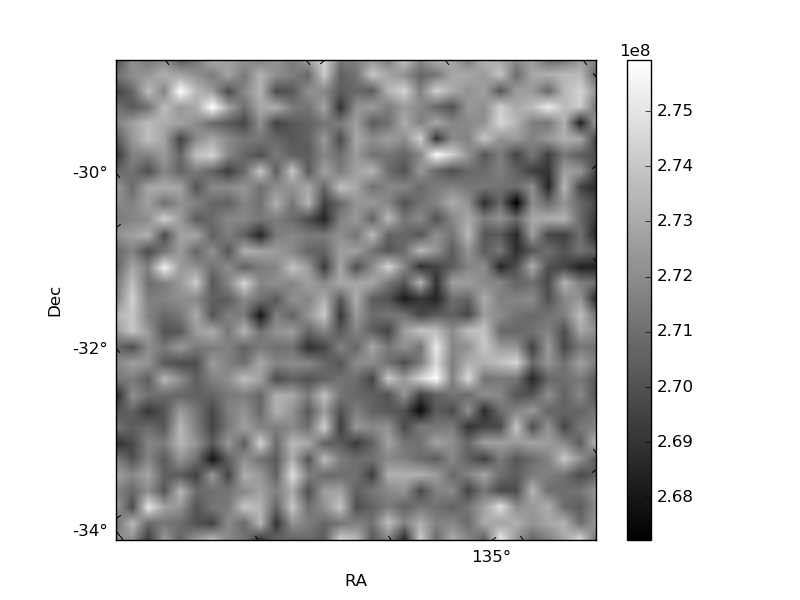
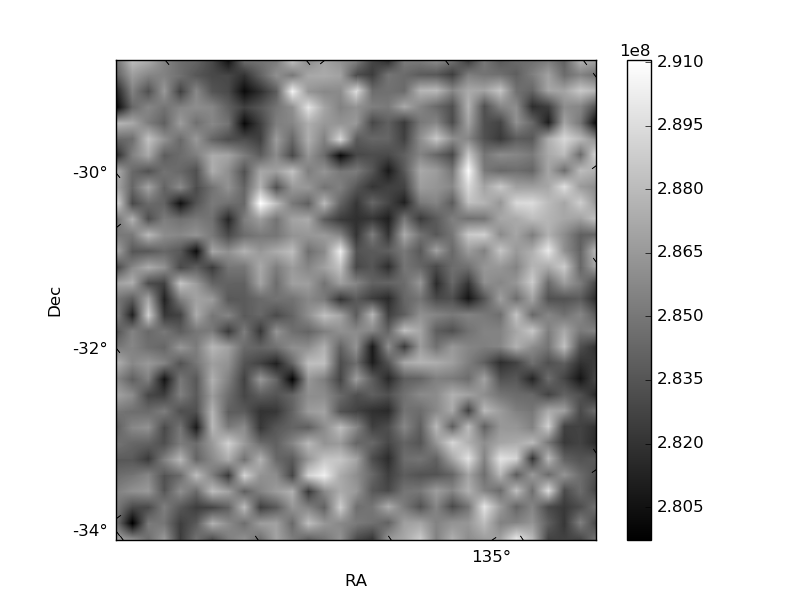
Histogram calculated using DETX and DETY for each event in the final _common_clean file
| Quadrant A | 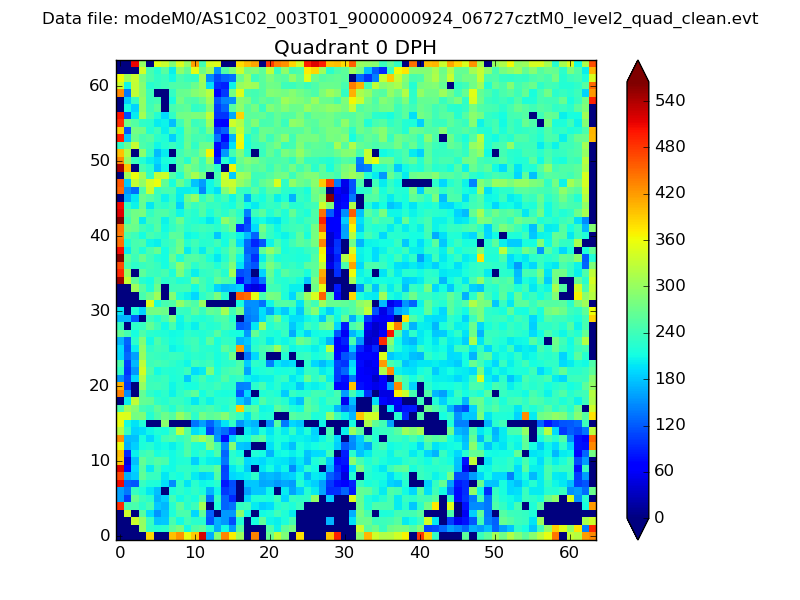 |
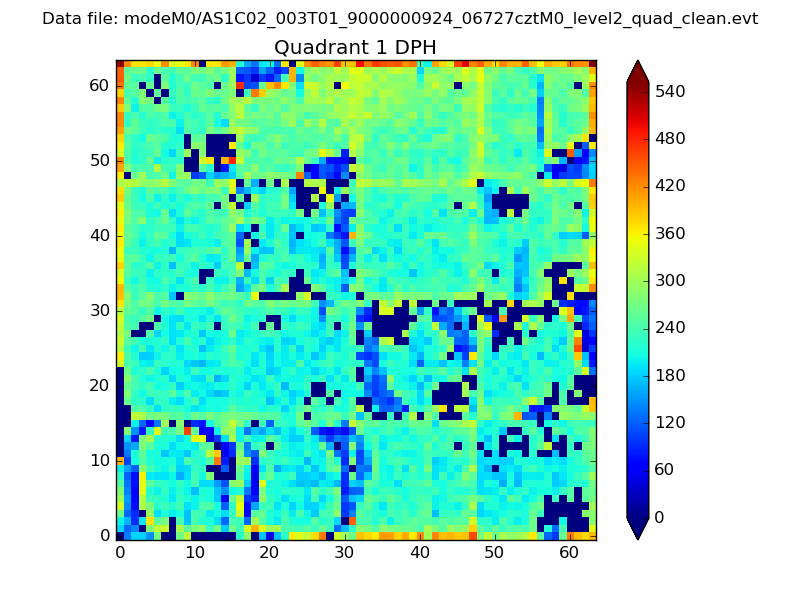 |
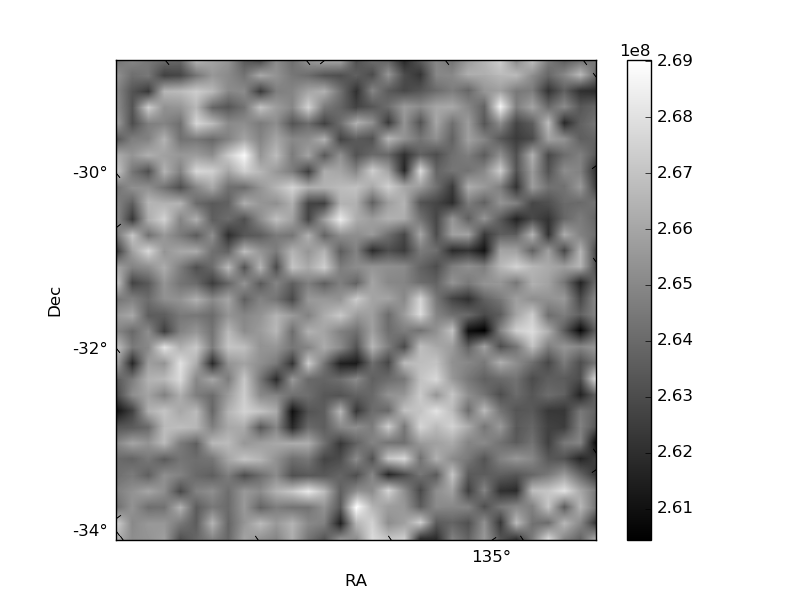
Quadrant B |
|---|---|---|---|
| Quadrant D | 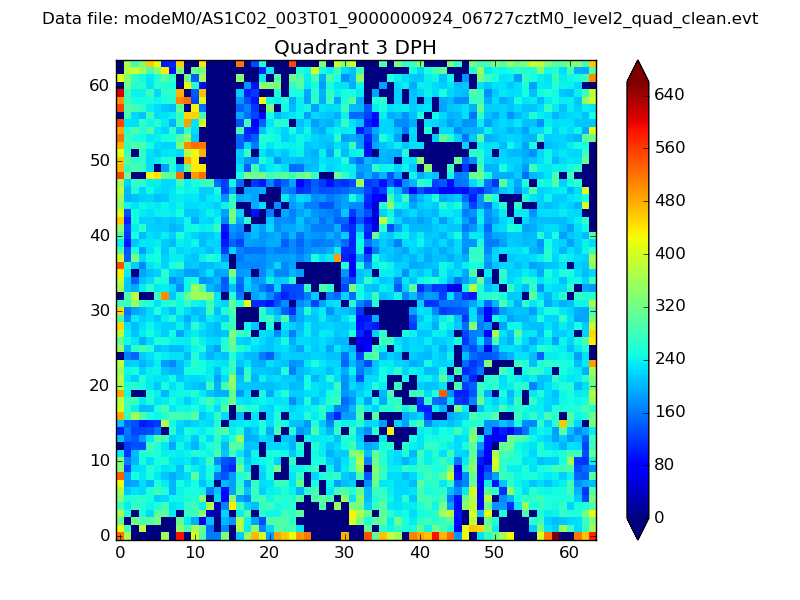 |
 |
Quadrant C |
| Plot type | Count rate plots | Images |
|---|---|---|
| Comparison with Poisson distribution Blue bars denote a histogram of data divided into 1 sec bins. Red curve is a Poisson curve with rate = median count rate of data. |
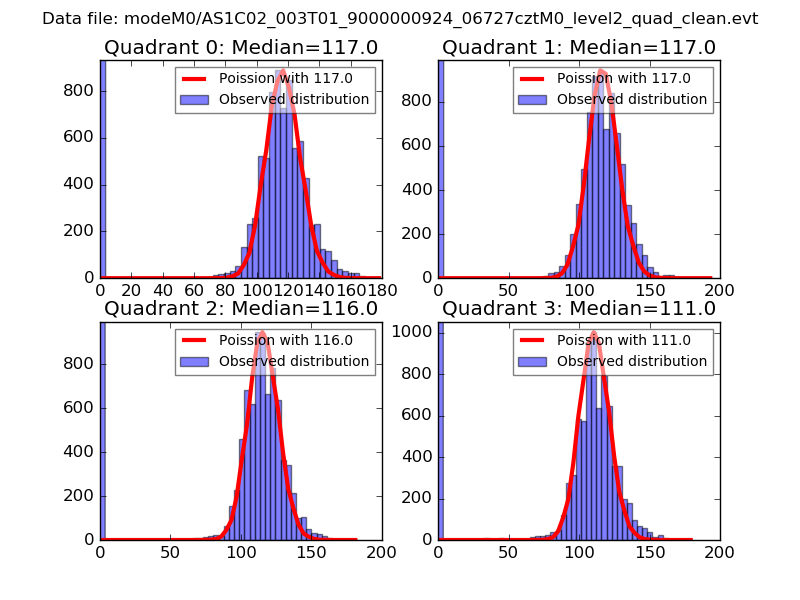 |
 |
| Quadrant-wise count rates Data is divided into 100 sec bins |
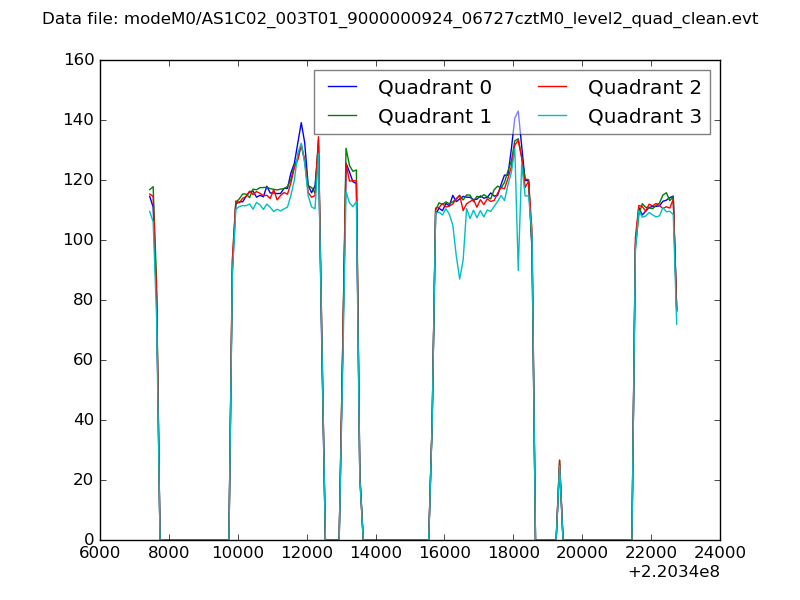 |
|
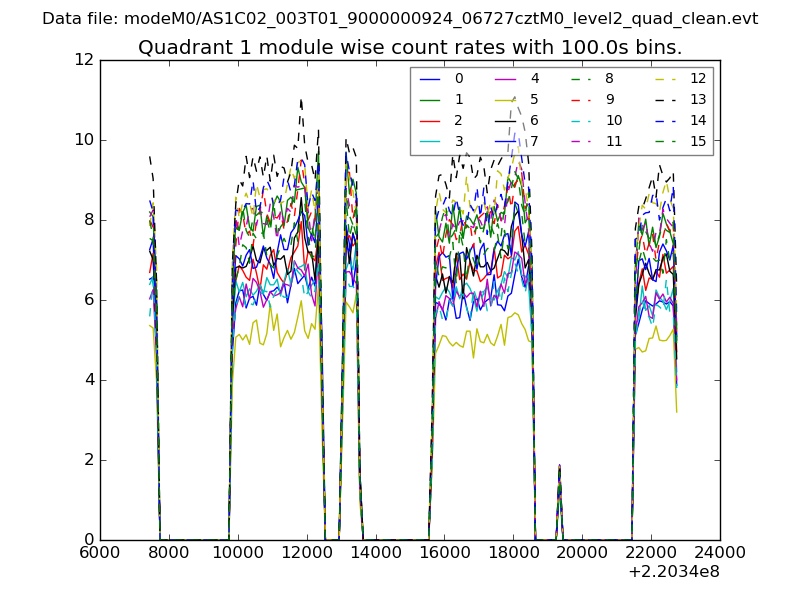
| Module-wise count rates for Quadrant A Data is divided into 100 sec bins |
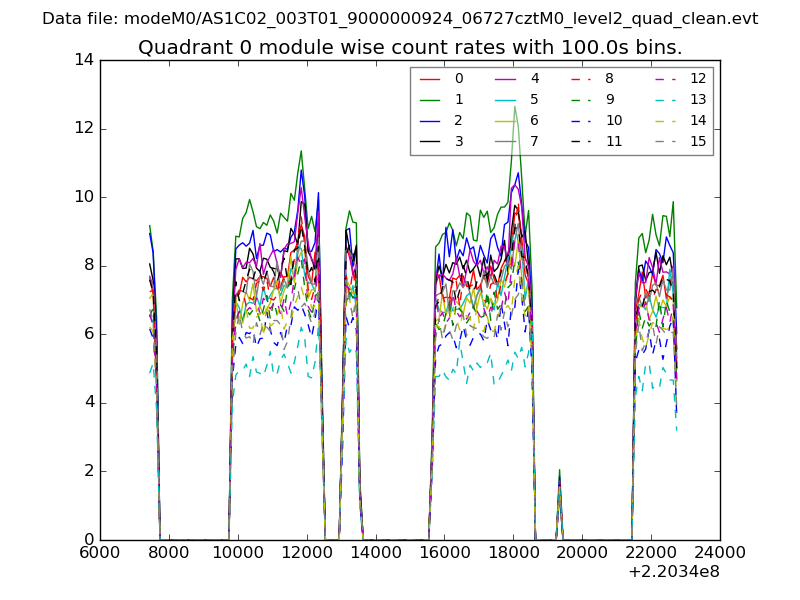 |
 |
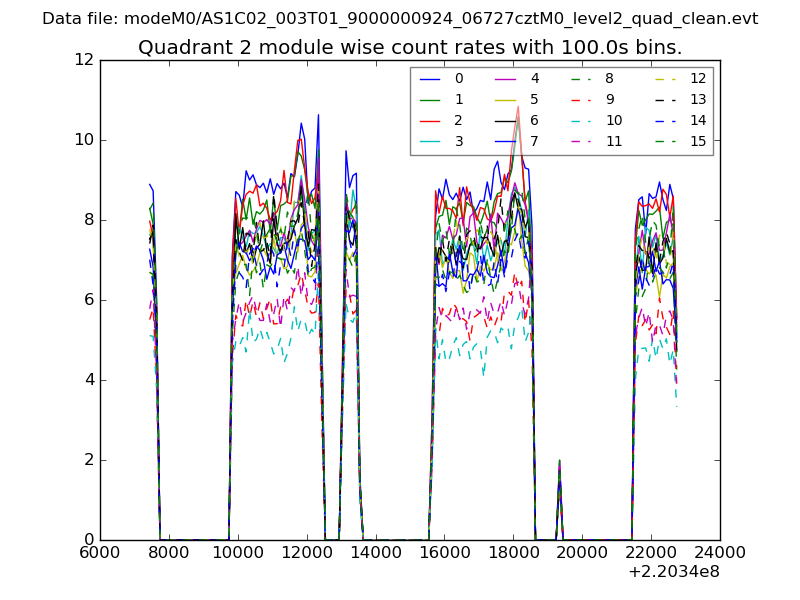
| Module-wise count rates for Quadrant B Data is divided into 100 sec bins |
 |
 |
| Module-wise count rates for Quadrant C Data is divided into 100 sec bins |
 |
 |
| Module-wise count rates for Quadrant D Data is divided into 100 sec bins |
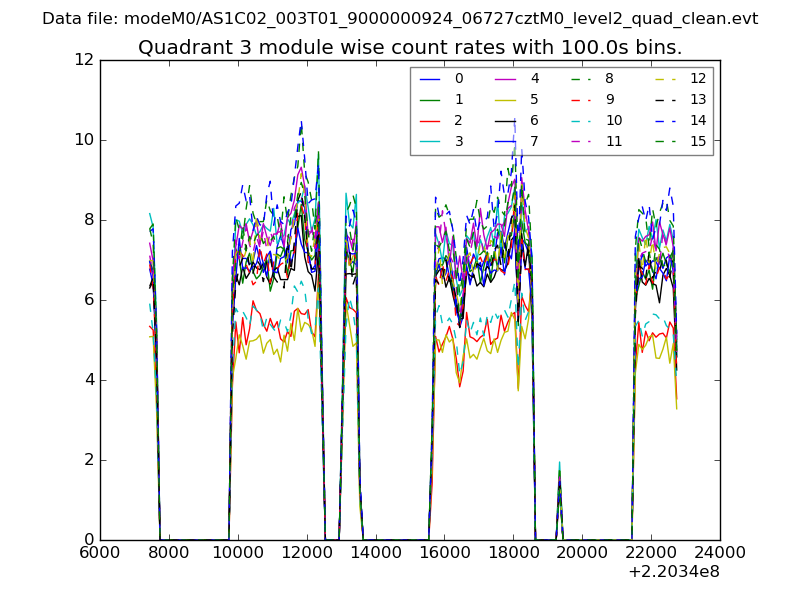 |
 |
| Parameter | Plot |
|---|---|
| CZT HV Monitor | 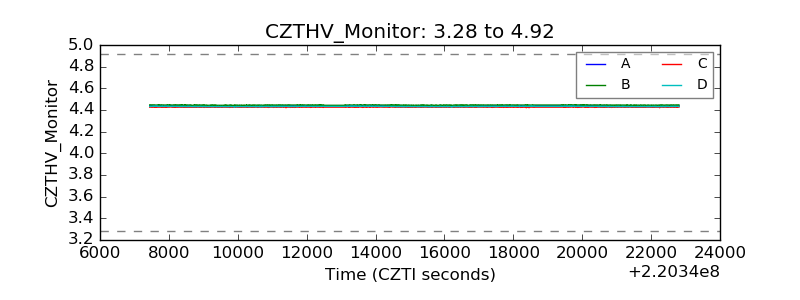 |
| D_VDD | 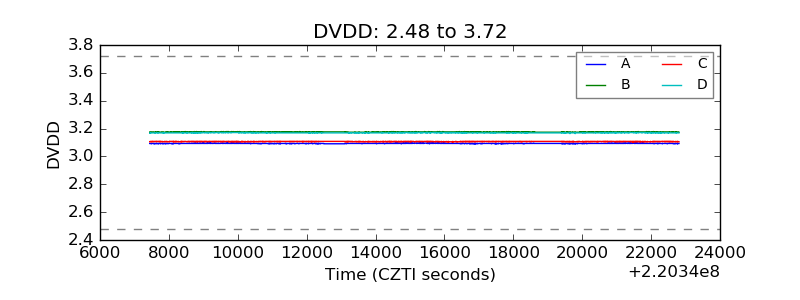 |
| Temperature 1 | 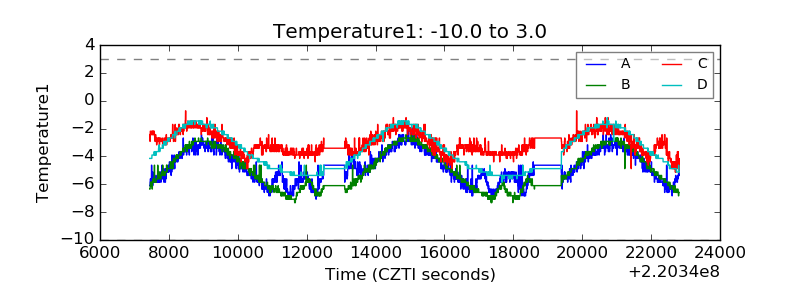 |
| Veto HV Monitor | 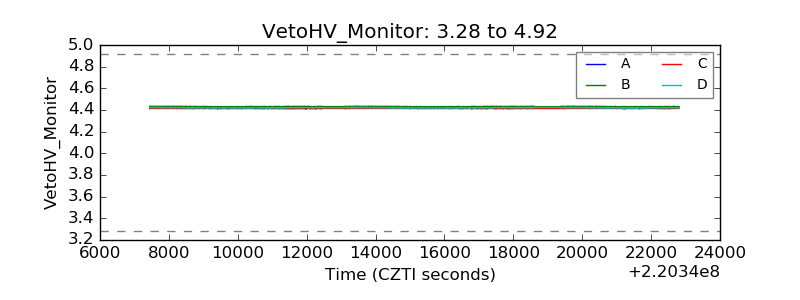 |
| Veto LLD | 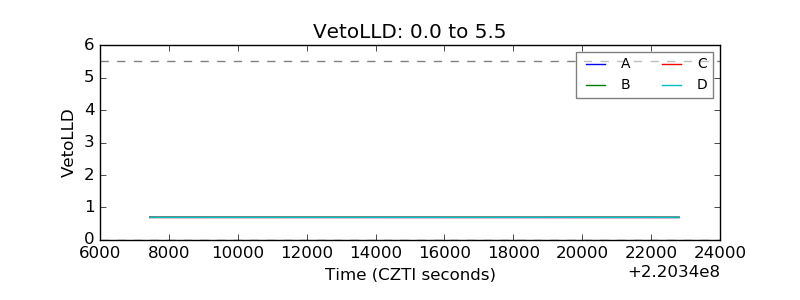 |
| Alpha Counter | 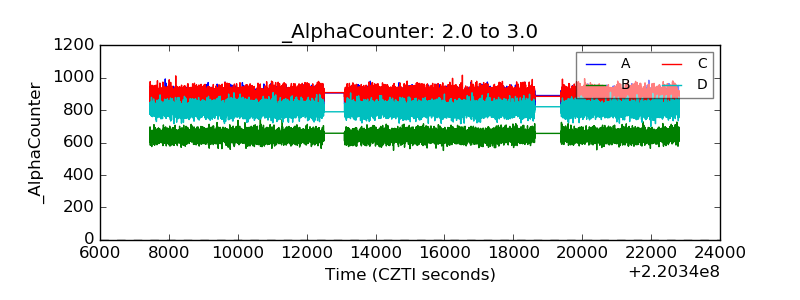 |
| _CPM_Rate | 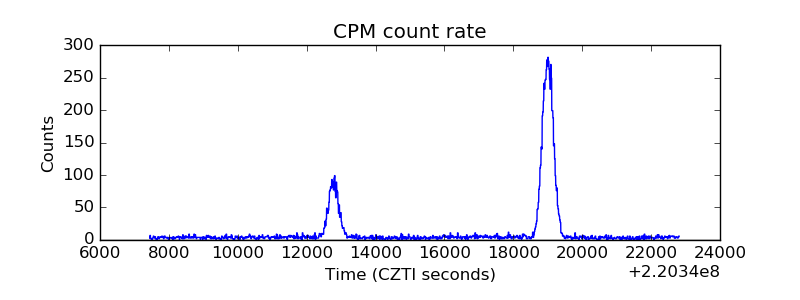 |
| CZT Counter | 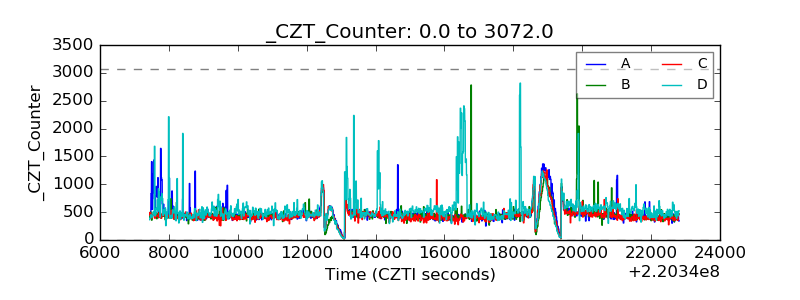 |
| +2.5 Volts monitor | 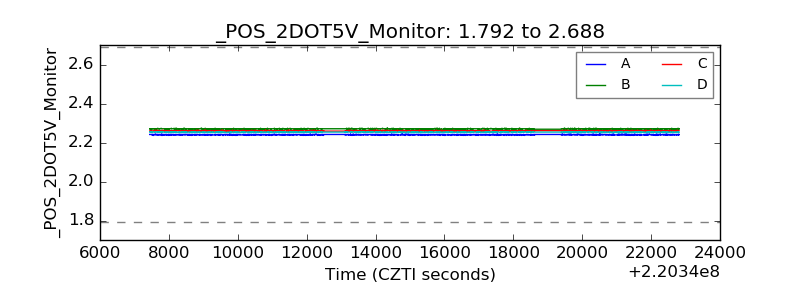 |
| +5 Volts monitor |  |
| _ROLL_ROT | 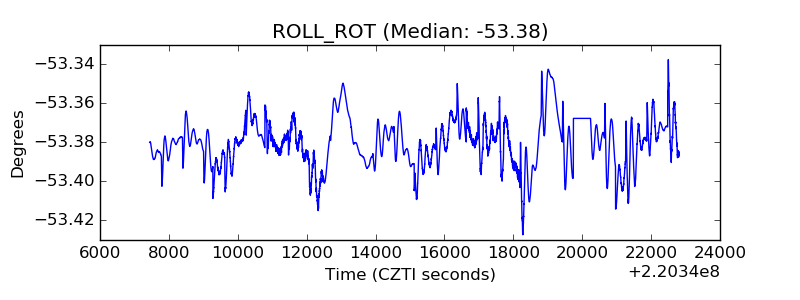 |
| _Roll_DEC | 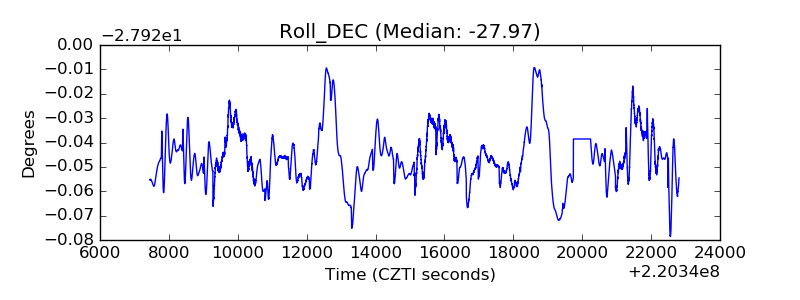 |
| _Roll_RA | 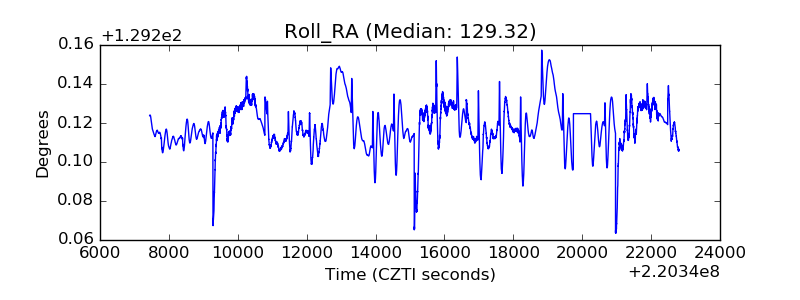 |
| Veto Counter | 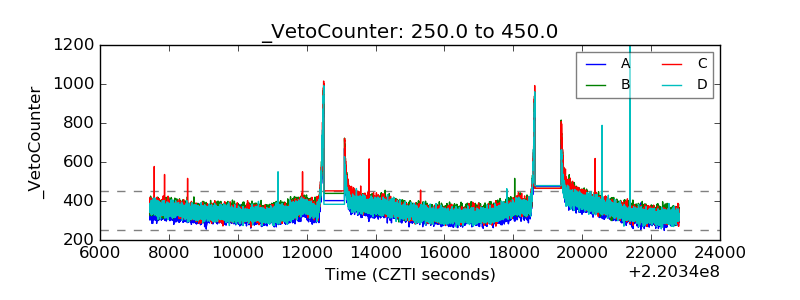 |